

Abstract
The purpose of this study was to evaluate the feasibility of using global positioning system (GPS) methods to understand the spatial context of obesity and hypertension risk among a sample of low-income housing residents in New York City (n = 120). GPS feasibility among participants was measured with a pre- and post-survey as well as adherence to a protocol which included returning the GPS device as well as objective data analysed from the GPS devices. We also conducted qualitative interviews with 21 of the participants. Most of the sample was overweight (26.7%) or obese (40.0%). Almost one-third (30.8%) was pre-hypertensive and 39.2% was hypertensive. Participants reported high ratings of GPS acceptability, ease of use and low levels of wear-related concerns in addition to few concerns related to safety, loss or appearance, which were maintained after the baseline GPS feasibility data collection. Results show that GPS feasibility increased over time. The overall GPS return rate was 95.6%. Out of the total of 114 participants with GPS, 112 (98.2%) delivered at least one hour of GPS data for one day and 84 (73.7%) delivered at least one hour on 7 or more days. The qualitative interviews indicated that overall, participants enjoyed wearing the GPS devices, that they were easy to use and charge and that they generally forgot about the GPS device when wearing it daily. Findings demonstrate that GPS devices may be used in spatial epidemiology research in low-income and potentially other key vulnerable populations to understand geospatial determinants of obesity, hypertension and other diseases that these populations disproportionately experience.
Keywords: spatial epidemiology, neighbourhoods, global positioning system, feasibility, low-income housing residents, health disparities, United States of America
Introduction
A large body of research displays connections between many neighbourhood characteristics and a large variety of health outcomes (Ellen et al., 2001; Kawachi and Berkman, 2003), including obesity (Bennett et al., 2008) and hypertension (Mujahid et al., 2008). This research has defined neighbourhood boundaries in multiple ways (Duncan et al., 2014). For example, one could evaluate using geographic information system (GIS) methods - which typically involves defining one's neighbourhood using an administrative unit, such as a census tract or defining a spatial buffer around a geocoded location (also known as a static, ego-centric buffer) (Duncan et al., 2014). However, GIS methods can result in spatial misclassification (i.e. characterising a neighbourhood-level exposure incorrectly) (Duncan et al., 2014). In addition, these standard techniques do not capture individual travel patterns and behaviours, e.g. they do not recognise that locations where individuals spend time can cut across administrative and ego-centric neighbourhood definitions. Finally, GIS methods make isotropic assumptions regarding one's exposure to specific neighbourhood environments, i.e. the assumption that individuals' exposure to environmental characteristics is spread out uniformly in all directions of the administrative or ego-centric neighbourhood definitions.
The best currently available method to define neighbourhood boundaries in spatial epidemiology is through the use of global positioning system (GPS) methods, assuming that the goal is to understand the overall context of where one spends time (Boruff et al., 2012; Chaix et al., 2013). In 1973, the GPS satellite-based technology (originally run with 24 satellites) was created by the U.S. Department of Defense. The introduction of GPS methods overcame the aforementioned constraints of static GIS methods and researchers can now, for example, define a neighbourhood as the exact area wherein individuals actually move by collecting the relevant GPS data. Consequently, GPS methods allow researchers to examine the multiple, spatial contexts one experiences (not just the residential neighbourhood environment) giving researchers the possibility to understand the timing and duration of when people experience certain spatial contexts, a significant advance in the field of spatial epidemiology (Chaix et al., 2009; Matthews, 2011; Kwan 2012a, 2012b).
While GPS studies have been conducted in various populations, to our knowledge, no study has been conducted using GPS methods in low-income housing residents, a population with high health needs. It is therefore not known if GPS methods are feasible to use among low-income housing residents and there may be possible reasons that such methods might not be, including concerns regarding whether the unit would audio/videotape them, concerns regarding the confidentiality of information and fear that they will not return the devices (Paz-Soldan et al., 2010). Compared to the general population, low-income housing residents disproportionately experience health conditions such as obesity and hypertension (Digenis-Bury et al., 2008) and relatively little is known about neighbourhood influences on health among low-income housing residents (Lovasi et al., 2009). Previous research though has found that certain built environment attributes derived from GIS methods, such as sidewalk connectivity, were associated with reduced obesity risk among this population (Heinrich et al., 2008; McAlexander et al., 2009). Moreover, while GPS studies have been conducted in various locations, only few GPS studies have been conducted in New York City (NYC) (Morabia et al., 2009, 2010), a unique spatial context due to its diverse neighbourhoods and ease with which individuals can move across neighbourhoods thanks to a robust public transportation system. Due to their utility in understanding relationships between neighbourhoods and health, the purpose of this study was to evaluate the feasibility of GPS methods among a sample of low-income housing residents in NYC as part of a larger study to understand the spatial context of obesity and hypertension.
Methods
Study design and overview
Data come from the NYC Low-Income Housing, Neighborhoods and Health Study (n = 120). Recruitment was conducted through community-based approaches, which included distributing flyers outside three selected public housing developments in three different Manhattan neighbourhoods and outside one public housing development in Queens. We chose these places to achieve borough representation and get diverse participants in the study. The public housing developments were quite different, e.g. one had few buildings in a mixed-income neighbourhood, while another had several buildings in a neighbourhood marked with concentrated poverty. In addition, we recruited through flyers posted and circulated by community-based organisations that work with low-income individuals (especially public housing residents), flyers posted in community locations (e.g. local stores) and through word of mouth (social networks). Participants were considered eligible for participation in the study if they: (i) reported living in public or low-income housing in NYC; (ii) were 18 years of age or older; (iii) could speak and read English; (iv) were not pregnant (self-reported); (v) had no restrictions to usual physical activity (self-reported); and (vi) were willing to wear a GPS device for a week. While most of the participants (80%) reported living in public housing, some of the low-income housing residents did not and many told us they heard about the study from public housing friends and family.
The data of the core survey (including the sections: “your neighbourhood”, “your health”, “your feelings” and “your background” as well as the pre-GPS feasibility survey) objectively measured health (body mass index (BMI) and blood pressure) were collected between June and July 2014 using a research electronic data capture (REDCap) electronic tool (also used for data management) hosted at the New York University (NYU) Langone Medical Center. Participants took the survey either directly online or they took a paper version (which was subsequently entered into the computer) with research assistants checking for potential key stroke errors. REDCap is a secure, web-based application designed to support data capture for research studies, providing (i) an intuitive interface for validated data entry; (ii) audit trails for tracking data manipulation and export procedures; (iii) automated export procedures for seamless data downloads to common statistical packages; and (iv) procedures for importing data from external sources (Harris et al., 2009). The objectively measured health data were collected in private rooms to ensure maximum privacy for participants, who were given US$ 25 for completing the baseline surveys and health screening. They were given another US$ 75 for returning the GPS device and completing the post-GPS survey. Table 1 provides information on the sample size by study phase, including numbers of participants, who were screened and enrolled, completed the core survey, screened for obesity and hypertension, given the GPS device and completed the post-GPS feasibility survey. Informed consent was obtained from all participants prior to data collection at our research office at NYU School of Medicine, where the baseline surveys and health screening were conducted. Our Institutional Review Board reviewed and approved the research protocol.
Table 1.
Number of participants by study phase.
| Study phase | N |
|---|---|
| Screened and enrolled | 120 |
| Completed the core survey | 120 |
| Completed the pre-GPS feasibility survey | 118 |
| Screened for obesity and hypertension | 120 |
| Given the GPS device | 120 |
| Returned the GPS device | 115 |
| Completed the post-GPS feasibility survey | 115 |
GPS device and protocol
We used QStarz's Super 51-CH performance bluetooth GPS travel recorder (BT-Q1000XT, Qstarz International Co. Ltd; Taipei, Taiwan), which has been used in many previous studies (Christian et al., 2012; O'Connor et al., 2013; Robinson and Oreskovic, 2013; Yen et al., 2013; Dessing et al., 2014). GPS tracking of the sample was conducted for a week, also consistent with many other studies (Zenk et al., 2011; Hurvitz and Moudon, 2012; Yen et al., 2013; Dessing et al., 2014; Yan et al., 2014). All research assistants participated in our 2-day GPS overview and training workshop, prior to interacting with the participants. During the study orientation and baseline assessment, participants were instructed to place the small (roughly 1″ by 2″) GPS device on their belt (using the manufacturer-provided case) or in their pocket. Participants also were instructed to charge the GPS device nightly. While our preference was for participants to keep the device in their pocket, at the GPS station (when distributing the GPS device), we told women it was okay to put the unit in their purses as long as their purses would stay with them at all times. Participants were asked to wear the GPS devices continually (except when sleeping, swimming or showering). We also asked participants to complete a travel diary consisting of a series of yes-no questions: “did you charge the GPS monitor today?” and “did you carry the GPS monitor with you today?” meant to help the participant remember to charge the unit and carry it with him or her throughout the week. Prior to distribution, we set the GPS device to log in at 30-sec intervals (so if a participant wore the GPS device for an hour it would have 120 counts). The GPS device (carrying a unique GPS serial number and with the battery fully charged) was given to participants in a large zip-lock bag, which also contained a mini USB charging cord, a USB wall adapter, a manufacturer-provided GPS belt holder (if requested), a pamphlet containing background information on GPS and the travel diary (see Fig. 1 for a picture of a GPS kit). Upon completion of the week-long GPS protocol (i.e. carrying the device for all journeys, charging the device daily and completing the travel diary), researchers went to community locations (i.e. a coffee shop and a library) in the participant's neighbourhood to obtain the GPS devices or participants came back to our research office to return the GPS devices, depending on which option was most convenient for the individual participant. At that time, as previously discussed, participants completed the GPS satisfaction and feasibility survey and were given the larger incentive. Of note, in several cases, participants had the opportunity to wear the GPS device for more than 7 days because their GPS return day was more than 7 days (due to logistical issues; e.g. if the GPS return day, following the 7 day GPS protocol, was on a holiday, we extended the protocol).
Fig. 1.
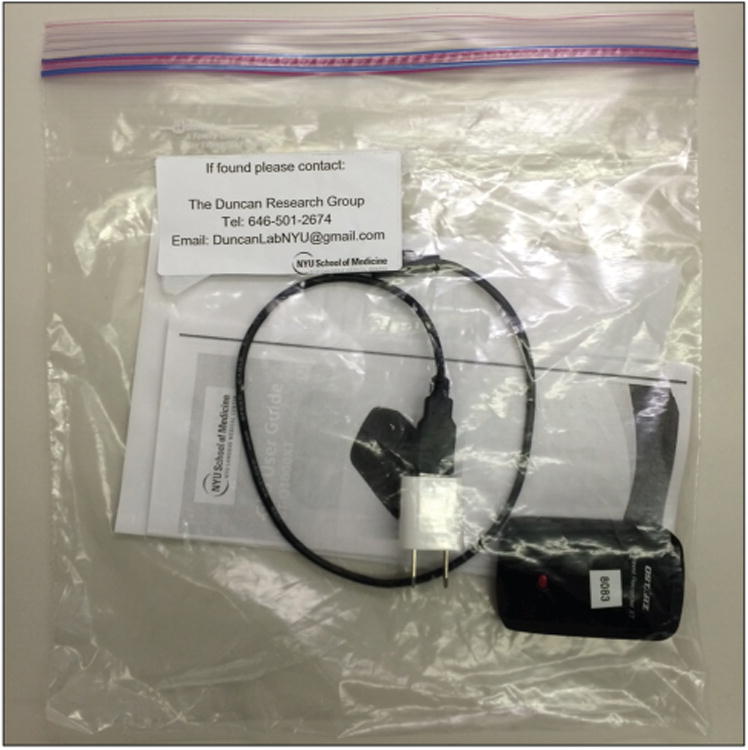
Picture of a GPS kit, used in the NYC Low-Income Housing, Neighborhoods and Health Study.
GPS feasibility
GPS feasibility was first measured using survey-based methods, consistent with previous research (Webber and Porter, 2009; McCluskey et al., 2012; Zenk et al., 2012). We implemented a pre- and post-survey including questions similar those used by Zenk et al. (2012). For example, at baseline the participants were asked if they thought that GPS made it more interesting to participate in the study; if they were worried about someone stealing the instrument and if the GPS seemed uncomfortable to wear. At follow-up, they were asked the same questions (Zenk et al., 2012). For these questions, participants were asked to use a Likert scale that varied from 1 (strongly agree) to 5 (strongly disagree). The survey also included 22 post-only GPS questions, including “Overall, was it easy to use the GPS?”; “I would participate in another GPS research study”; and “Would you participate in a GPS study that tracked you for 2 weeks?” Response options for most of these questions were “yes” and “no”. We also assessed feasibility of and adherence to the GPS protocol, which included returning the GPS device as well as objective data analysed from the GPS devices (i.e. the total number of GPS data points per participants, the number of days the devices were worn per participant and the average amount of GPS data obtained from the GPS device per day) (Duncan et al., 2009; Webber and Porter, 2009; Oliver et al., 2010; O'Connor et al., 2013). Of interest to this feasibility study was the number of days of wear-time of the GPS unit per participant. We evaluated a participant as having valid and useable GPS data for a day if he or she had at least 120 GPS data points in a given day, as this would indicate an hour of wear-time with the GPS device attempting to log in at 30-sec intervals. In this study, we did not require that these points necessarily be consecutive in nature, because we were interested in overall wear-time. We evaluated 1-hour and 5-hour of wear-time (Du and Aultman-Hall, 2007). Finally, after completion of the week-long GPS protocol, we conducted individual qualitative interviews among a convenience sub-sample of the participants, who completed the week-long GPS protocol to contextualise and expand upon our quantitative findings (the Institutional Review Board also reviewed and approved this aspect of the study). In the qualitative interviews, we asked the questions, “How did you feel about wearing the GPS unit?” and “Do you feel like it was a burden at times?”. We used an Olympus digital voice recorder VN-722PC to record these interviews.
Body mass index
Trained research assistants (medical students) measured the participants' height and weight, using standard protocols. Participants were asked to remove their shoes, heavy outer clothing, hats and any tall hair accessories prior to measurement of height and weight. Height was measured to the nearest mm with a Seca 213 stadiometer with participants' back to the stadiometer and their head in the Frankfort position (Geeta et al., 2009; Abidin and Adam, 2013; Bacardí-Gascón et al., 2013; McGurk et al., 2013; Prushansky et al., 2013). Weight was measured to the nearest tenth of a kg with a Tantina 351 scale (Geeta et al., 2009; Thomas et al., 2010; Yahia et al., 2011; Bacardí-Gascón et al., 2013; Bammann et al., 2013). The BMI is a measure of relative weight based on an individual's mass and height calculated using the standard formula: weight (kg)/(height (cm)/100)2. We used standard BMI classifications: underweight classified as a BMI less than 18.50; normal weight classified as a BMI of 18.50 to 24.99; overweight classified as a BMI of 25.00 to 29.99; and obesity classified as a BMI above 30.00.
Blood pressure
Using standard protocols, trained research assistants (medical students) measured the participant's blood pressure. Participants sat in a chair prior to and during measurement of their blood pressure with their arms outstretched, back supported, legs uncrossed and feet on the floor. The resting time before blood pressument measurement was about 15 to 30 seconds. The blood pressure was measured with a Welch Allyn Vital Signs 300 monitor (Hess et al., 2007; Victor et al., 2011; Ravenell et al., 2013) using the two measurements (expressed in mm Hg): systolic - the arterial pressure during the contraction of the heart (systole) and the diastolic - the arterial pressure when the heart between beats (diastole). Hypertension is classified as a systolic blood pressure at or greater than 140 mm Hg, or a diastolic blood pressure at or greater than 90 mm Hg. Pre-hypertension is classified as a systolic blood pressure between 120-139 mm Hg and/or a diastolic blood pressure between 80-89 mm Hg. Normal blood pressure is classified as a systolic blood pressure less than 120 mm Hg and a diastolic blood pressure less than 80 mm Hg. We asked all par-tricipants in the core survey if they were using any medications for lowering the blood pressure and this was additional way to classify hypertension among participants.
Socio-demographic characteristics
Participants reported their age, gender, race/ethnicity (Black, White, Hispanic, Asian and Other), educational attainment (less than 12th grade, high school degree or general educational development (GED), some college/vocational school/apprenticeship, bachelor's degree, graduate degree), household income (less than US$ 25,000, US$ 25,000 to US$ 49,999, US$ 50,000 to US$ 74,999, ≥US$ 75,000), and employment status (working full-time, working part-time, not working, retired, in school).
Data analysis
First, we computed descriptive statistics including the sociodemographic characteristics of the sample in addition to BMI and blood pressure. Next, we examined the feasibility of GPS methods among the sample by computing descriptive statistics on the aforementioned GPS feasibility measures, such as the survey questions. STATA software version 10.0 (Stata Corp; College Station, TX, USA) was used to perform the statistical analyses. When comparing the GPS survey questions asked at baseline and at follow-up, we present percentages and associated p-values based on χ2 statistics. Statistical significance was set at P <0.05. The analytic sample for the quantitative aspect of the study included participants who answered the pre- (n = 118) and post-feasibility surveys (n = 115). All analyses were conducted at the group-level, i.e. we did not match responses for each participant before and after completing the GPS protocol.
The GPS participant data were downloaded using the Qstarz proprietary software and stored as .gpx files that were subsequently processed with several scripts and with models built using the Python programming language (Python Language Reference, version 2.7; available at: http://www.python.org) and ArcGIS version 10.2 (ESRI; Redlands, USA).
We conducted 21 qualitative interviews. All interviews were transcribed verbatim. We used an inductive, qualitative analytical approach (Thomas, 2006). The first author reviewed all of the transcribed interviews. Representative quotes were selected for each question by hand. For reliability and validity checking, peer-debriefing was conduced. The first author met with one of the study research assistants (i.e. the research assistant who conducted the qualitative interviews and a co-author on this study) to validate the quotes selected from the interviews (Harley et al., 2009).
Results
Table 2 shows sociodemographic characteristics of the sample as well as related information on BMI and blood pressure. The mean age of the sample was 38.5 years (SD = 14.2). Just over half (55.1%) of the sample was female. More than two-third of the sample was Black (67.8%). Most of the sample reported less than 12th grade education or having a high school degree or GED (68.6%). Over two-thirds of the sample reported a household income of less than US$ 25,000. Just over half (55.1%) reported not working. The mean BMI was 29.4 (SD = 7.8). In addition, most of the sample was overweight (26.7%) or obese (40.0%). The mean systolic and diastolic blood pressure was 129.2 (SD = 18.6) and 76.8 (SD = 13.0), respectively. Almost one-third (30.8%) of the sample was pre-hypertensive and 39.2% of the sample hypertensive.
Table 2.
Socio-demographic characteristics of the sample.
| Sample (n = 120) | Percent, or mean (SD) |
|---|---|
| Age (years) | 38.5 (14.2) |
| Gender | |
| Male | 44.9% |
| Female | 55.1% |
| Race/ethnicity | |
| Black | 67.8% |
| White | 4.2% |
| Hispanic | 23.7% |
| Asian | 0.9% |
| Other | 3.4% |
| Educational attainment | |
| Less than 12th grade | 28.8% |
| High school degree or GED | 39.8% |
| Some college | 24.6% |
| Bachelor's degree | 5.1% |
| Graduate degree | 1.7% |
| Household income | |
| <US$ 25,000 | 71.6% |
| US$ 25,000 to US$ 49,999 | 21.6% |
| US$ 50,0000 to US$ 74,999 | 5.2% |
| ≥US$ 75,000 | 1.7% |
| Employment status | |
| Working full-time | 14.4% |
| Working part-time | 18.6% |
| Not working | 55.1% |
| Retired | 5.1% |
| In school | 6.8% |
| Blood pressure | |
| Systolic | 129.2 (18.9) |
| Diastolic | 76.8 (13.0) |
| Normal | 30.0% |
| Pre-hypertensive | 30.8% |
| Hypertensive | 39.2% |
| Weight parameters | |
| Body mass index (BMI) | 29.4 (7.8) |
| Underweight | 1.7% |
| Normal weight | 31.7% |
| Overweight | 26.7% |
| Obese | 40.0% |
Percentages might not equal 100 due to rounding; valid percentages are presented, i.e. given as the value produced when missing data are excluded from the calculations.
GPS feasibility
We were able to successfully recruit 120 low-income housing residents in this study, where one of the criteria was to being willing to wear a GPS device for a week. Overall, we found that it was feasible to use GPS devices among our sample of low-income housing residents.
Table 3 compares GPS feasibility pre- and post-survey measures. Participants reported high ratings of GPS acceptability, such as ease of use, low levels of wear-related concerns in addition to few concerns related to safety, or appearance, which were maintained after the collection of baseline GPS feasibility data. Results showed that GPS feasibility increased over time with familiarity with GPS. For example, at baseline and follow-up, participants were asked what they thought about the statements: “GPS makes it more interesting to participate in the study” and “GPS made it more interesting to participate in the study”, respectively, where 71.2% and 82.6% (p=0.060) reported that they “strongly agreed” or “agreed”. At baseline and follow-up, participants were asked about the statements: “I am worried about someone trying to steal the GPS” and “I was worried about someone trying to steal the GPS”, respectively, where 22.8% and 15.7% (P = 0.053) reported that they “strongly agreed” or “agreed”. Finally, at baseline and follow-up, participants were asked “The GPS seems uncomfortable to wear” and “The GPS irritated my skin or was uncomfortable to wear”, respectively, where 22.0% and 21.7% (P = 0.002) reported that they “strongly agreed or agreed”; this was the only statistically significant difference between the pre-GPS and post-GPS survey.
Table 3.
Comparing pre- and post-GPS feasibility survey questions.
| Pre-GPS survey (n = 118) | Post-GPS survey (n = 115) | P-value** | ||
|---|---|---|---|---|
|
|
|
|||
| Question* | % strongly agree/agree | Question* | % strongly agree/agree | |
| I am comfortable with the research study tracking where I go using GPS. | 74.6 | I felt comfortable with the research study tracking where I go using GPS. | 80.0 | 0.748 |
| GPS makes it more interesting to participate in the study. | 71.2 | GPS made it more interesting to participate in the study. | 82.6 | 0.060 |
| I am worried about someone trying to steal the GPS. | 28.8 | I was worried about someone trying to steal the GPS. | 15.7 | 0.053 |
| The GPS seems uncomfortable to wear. | 22.0 | The GPS irritated my skin or was uncomfortable to wear. | 21.7 | 0.002 |
| I am concerned that I will lose the GPS. | 27.1 | I was concerned that I would lose the GPS. | 22.6 | 0.749 |
| I am worried about my safety wearing the GPS. | 27.1 | I worried about my safety wearing the GPS. | 24.4 | 0.477 |
| I am concerned about how I will look wearing the GPS. | 27.1 | I was concerned about how I looked wearing the GPS. | 19.1 | 0.367 |
Other categories were “neutral” and “strongly disagree/disagree” (data not shown);
P-values are based on χ2 statistics, comparing pre-GPS and post-GPS survey questions.
Table 4 shows questions asked in the post-GPS survey only. The GPS feasibility post-survey questions overall demonstrate that the use of GPS was viewed as feasible by participants (Table 4). For example, when asked “Overall, was it easy to use the GPS?”, 93.9% responded positively and 92.9% of the sample did so, when asked if they would participate in another GPS research study, while 90.3% answered “yes” to “Would you participate in a GPS study that tracked you for two weeks?” The overall GPS return rate was 95.6%, i.e. 115 GPS devices were returned on the scheduled GPS return days, out of a total of 120 units distributed (Table 5). It is unclear if the five units that were not returned were lost, misplaced, stolen or that the participants were simply lost to follow-up. Because the participants had a choice to return the GPS device at our research office or at selected community-based locations, we also were able to calculate the GPS return rate for each location type. Interestingly, the GPS return rate at the community locations was 100%.
Table 4.
GPS feasibility post-survey questions.
| Questions used in the study | Response* | |
|---|---|---|
|
| ||
| No | Yes | |
| 1. I had issues or problems with the GPS device during the study.** | 75.2% | 21.2% |
| 2. Did you have problems turning the GPS device on or off? | 94.7% | 5.3% |
| 3. Did you forget to charge the GPS device at night? | 73.9% | 26.1% |
| 4. Did you forget where to put the GPS device? | 96.5% | 3.5% |
| 5. Do you think the GPS device was too big? | 98.2% | 1.8% |
| 6. Do you think the GPS device was too small? | 93.9% | 6.1% |
| 7. Did the GPS run out of battery during the day? | 57.4% | 42.6% |
| 8. Overall, was it easy to use the GPS? | 6.1% | 93.9% |
| 9. Did you have any problems with charging the GPS? | 95.6% | 4.4% |
| 10. Did you have any problems carrying or wearing the GPS? | 95.6% | 4.4% |
| 11. Were you able to solve any problems you had with the GPS? | 33.6% | 66.4% |
| 12. Did you feel comfortable wearing the GPS? | 13.9% | 86.1% |
| 13. Did the GPS device get in the way of your everyday activities? | 82.5% | 17.5% |
| 14. Was the battery life of the GPS too short? | 77.2% | 22.8% |
| 15. Did you forget to wear the GPS device daily? | 89.5% | 10.5% |
| 16. I would participate in another GPS research study. | 7.1% | 92.9% |
| 17. Did using the GPS device cause you to alter your behaviour? | 94.7% | 5.3% |
| 18. Were there any activities that were difficult to do with the GPS on? | 92.9% | 7.1% |
| 19. Was the GPS device inconvenient to carry/wear? | 95.7% | 4.3% |
| 20. Was it a chore to wear the GPS device? | 82.3% | 17.7% |
| 21. Did you like the look of the GPS device? | 17.9% | 82.1% |
| 22. Would you participate in a GPS study that tracked you for 2 weeks? | 9.7% | 90.3% |
Number of participants = 115;
for this question, the response options were as made according to the Liker scale where “Yes” corresponds to “strongly agree/agree” and “No” to “strongly disagree/disagree”.
Table 5.
GPS device return rate by location.
| Return location | Scheduled returns* | Actual returns* | Percent returned |
|---|---|---|---|
| Research office | 78 | 73 | 93.6% |
| Community locations | 42 | 42 | 100 % |
| All locations | 120 | 115 | 95.8% |
Per particpant
Although one GPS device was returned with the QStarz programme being unable to pick up any data on it. We speculate that this participant probably shut it off when they received it, either accidentally or purposefully. Objectively, the total number of GPS data points for all participants for the duration of the study was 1,358,886. There was data loss due to internal clock errors and ‘multi-path reflectance’ (i.e. GPS satellite radio signals can “bounce” or be reflected off of a building, which results in an inaccurate location since the GPS receiver uses a highly accurate time-stamp to identify its location). However, these issues were minimal and when irrational GPS data (n = 276; i.e. <0.001%) were removed from the analysis, it still left a total sample size of 1,358,610. The total number of GPS points per participant for the duration of the study varied from a low of 45 to a high of 148,690, with a median count of 8,672 and mean count of 11,920 per participant. Of the total of 114 participants with any GPS data, 112 (98.2%) had at least one hour of GPS data for one day as indicated by 120 GPS fixes on a day given our 30-sec sampling rate and 84 (73.7%) had at least one hour (120 GPS points) on 7 or more days (Fig. 2). When participant data (n = 112) were disaggregated by the number of days participants wore their GPS, we found that the participants had between 1 and 11 days with at least 120 GPS fixes (mean: 7.44, SD = 2.15). Using a cut-off of 5 hours of wear-time as a threshold, indicated by 600 GPS data points per day, 109 of 114 participants or 95.6% had at least 5 hours of wear-time on 1 or more days. However, only 49 or 42.9% had 5 or more hours of wear-time on 7 days of the study. A map of the raw GPS data from one study participant is shown in Fig. 3.
Fig. 2.

Number of days with at least 1-hour of GPS data per participant (n = 114).
Fig. 3.

Mapping GPS tracks from a study participant.
The qualitative interviews indicated overall that participants enjoyed wearing the GPS devices, that they were easy to use and charge and that the participants generally forgot about the GPS device when wearing it daily (Table 6). Participants also reported that they did not feel the GPS was a burden. Overall, participants reported positive attitudes (e.g. felt comfortable) about wearing the GPS device. The GPS device also did not seem to be burdensome.
Table 6.
Select responses to qualitative interview questions.
| Questions | Responses |
|---|---|
| “How did you feel about wearing the GPS unit?” | “I was fine with it. It didn't bother me. I didn't feel no discomfort.” (45 years old, female, African American, overweight, hypertensive) “I actually didn't feel no type of way about it. Actually every time I wore, um, I had it in my pocket I forgot I even had it, so it was like nothing. I forgot about it… cold forgot about it until I went home. And like not even like carrying my phone. It's like better than that. I don't have to do nothing with it.” (25 years old, male, African American, overweight, normal blood pressure) “I felt safe. I wore it mostly every day. I probably forgot it like probably one time, maybe, but other than that, I charged it and everything.” (25 years old, female, African American, normal weight, normal blood pressure) “It didn't bother me at all. It was just like a beeper. No big deal. I threw it in my purse, called it a day.” (57 years old, female African American, obese, normal blood pressure) “Um it actually felt like a regular everyday thing. It was no difference, just remembering to keep it with me, but once I put it in my bag, it was fine. My bag goes with me everywhere so it went with me everywhere.” (36 years old, female, Hispanic, obese, pre-hypertensive) “Oh that was fine. It was simple, as far as I'm concerned. There was no problems carrying it. Fit right in my pocket, fit right in my purse. It was good” (54 years old, female, African American, obese, prehypertensive) |
| “Do you feel like it was a burden at times?” | “No.” (81 years old, female, African American, normal weight, hypertensive) “Oh no cause it's very small and easy to carry.” (58 years old, female Asian American, obese, pre-hypertensive) “No.” (34 years old, female, African American, overweight, normal blood pressure) “No, no.” (65 years old, female, African American, overweight, hypertensive) “No, not at all. I basically, I didn't even know it was there half of the time, so it's no burden at all.” (36 years old, female, Hispanic, obese, pre-hypertensive) “No, no.” (57 years old, female, African American, obese, normal blood pressure) |
Discussion
The best currently available method to define neighbourhood boundaries in spatial epidemiology is to use GPS-based methods (Boruff et al., 2012; Chaix et al., 2013). We evaluated the feasibility of GPS methods in this study among a sample of low-income housing residents in NYC, as part of a larger study to understand the spatial context of obesity and hypertension risk. In this study, we were able to successfully recruit 120 low-income housing residents, where one of the criteria was being willing to wear a GPS device for a week. This study incorporated multiple feasible measurements: quantitative assessments with previously used survey qustions, quantitative assessments with data from the GPS device and qualitative assessments. Overall, we found that it was feasible to use GPS devices among our sample of low-income housing residents. For example, the overall GPS return rate was much higher than we anticipated (96%) and the GPS return rates at community-based locations was 100%, highlighting the importance of working within the community. Of the participants with any GPS data, 98.2% had at least one hour of GPS data for one day and 73.7% had at least one hour on 7 or more days.
GPS research in low-income housing residents has not been conducted to date, so it is difficult to compare our results with other GPS studies. However, GPS studies (including GPS feasibility studies) have been conducted in a variety of populations and generally show that using GPS devices is feasible for diverse groups. Using survey-based methods from two pilot studies, Zenk et al. (2012) evaluated the feasibility of using Foretrex 201 GPS devices (where participants wore a GPS for up to 7 days) and found high ratings of GPS acceptability and ease of use and low levels of wear-related concerns, which were maintained after baseline GPS feasibility data collection. Participants described technical and wear-related problems, but few concerns related to safety, loss or appearance. This study is most similar to ours and was conducted among a sample of 170 low-income adults in Detroit, Michigan. We note, though, that there are important sociodemographic difference between our sample and theirs, including most of their sample was between 45-and 64-years-old and 50% of their sample had a least some college education. Our results demonstrate that GPS use is possible among populations with lower education levels (28% of our sample reported having less than 12th grade education and 39% reported being a high school graduate). In another study in Iquitos, Peru by Paz-Soldan et al. (2010), participants expressed concerns about caring properly for the unit during focus group discussions, whether the unit would audio/videotape them, health effects of prolonged use, responsibility for units and confidentiality of information. However, in the pilot study of 126 people, who were asked to carry GPS units (I-GotU 100) for 2-4 weeks (98% provided consent), all expressed minimal concerns (Paz-Soldan et al., 2010). Furthermore, McCluskey et al. (2012) evaluated the feasibility of the EZ 23 Personal Tracker GPS for measuring outings among 20 ambulant people, who had experienced a stroke (participants also wore the GPS device and kept a diary for 7 days). The study found that the GPS data recovery was high (87%), but some participants had difficulty operating the on/off switch and reading the small screen. Webber and Porter (2009) conducted a study among older adults (n = 20) using Garmin Forerunner GPS watches and accelerometers (they wore for 1 day) and found the methods were feasible. Finally, Hispanic preschoolers (n = 15) simultaneously wore QStarz BT100X GPS devices and accelerometers for a 24- to 36-hour period and it was concluded that the methods were feasible (O'Connor et al., 2013).
Feasibility is likely determined by a variety of factors. In this study, it might have been achieved because it was conducted in public housing development neighbourhoods, which may enhance the legitimacy of the study as well as convenience for participants. We recruited at the public housing developments themselves and for public housing developments far from our office (more than a few blocks) and we retrieved the GPS devices at a coffee shop or a library in local neighbourhoods. In this study, feasibility was also likely influenced by our financial incentive, our use of the travel diary as well as the week-time frame of our GPS protocol. Importantly, this study provided a cash incentive, which was intensive on the research staff to manage (as opposed to using gift cards or another form of incentive), but it seemed to be very appreciated by our study participants. It is also significant to note that we had little trouble retrieving the GPS devices back, likely because our cash incentive was generous and the majority of it was given after the devices were returned, which also might have influenced the return rate. In addition, the altruistic motives of study participation were emphasised (i.e. producing useful information to reduce obesity and hypertension and improve neighbourhood conditions through effective policies), which may have also increased participation rate. In terms of race/ethnicity, it is also worthwhile to note that most participants in the study were African Americans and several of the research staff (including the principal investigator) were also African Americans. While there can be mistrust and ethical concerns among research participants (especially participants, who belong to racial minorities) (Corbie-Smith et al., 2002; Shavers et al., 2002; Braunstein et al., 2008; Ford et al., 2008), this aspect may have increased trust. We also note that we gave participants a choice when coming back to return the GPS device. Finally, in addition to calling participants in the beginning of the study (after recruitment) to remind them of data collection, we called them again mid-week to remind them to return the GPS devices. These strategies all probably increased compliance, but we do not know to what degree.
Future research directions
Using GPS devices in low-income populations is feasible but further studies should continue to examine the feasibility of GPS research in low-income populations in NYC and in other geographies, especially rural areas, where less GPS research has been conducted. Indeed, such work is beginning to be conducted (Paz-Soldan et al., 2010; Seto et al., 2012; Ojiambo et al., 2013) and it emphasises the need for GPS feasibility research in international contexts, especially in developing countries. There are a number of potential GPS protocol compliance methods, including informing participants of the study's importance, providing a travel diary and offering a sliding scale for the incentive/s. These future studies might consider randomly assigning different GPS protocols (e.g. randomly assign distribution of a travel diary and not doing so, randomly assign texting participants each night to remind them to wear their GPS unit and not doing so, as well as randomly assign different amounts of cash incentive). These GPS protocols can have more advanced features including having different time periods (i.e. 1-week vs. 2-week) and following individuals over time (i.e. baseline and 3-month follow-up period). Future research could also test the feasibility of using a dedicated GPS unit (as used in this study) versus other GPS devices (e.g. a GPS-enabled smart-phone). In addition, future GPS research could use data triangulation (e.g. cell phones, WiFi beacons and so on). Among low-income housing residents, future studies can also evaluate the feasibility of simultaneous use of a GPS device and another device (such as an accelerometer) – as has been done in other populations (Webber and Porter, 2009; Oliver et al., 2010; Dunton et al., 2013; O'Connor et al., 2013; Robinson and Oreskovic, 2013; Klinker et al., 2014) in addition to the use of GPS methods with other geospatial technologies, such as ecological momentary assessment (EMA), which also has been done in other populations (Kirchner et al., 2013; Scharf et al., 2013; Epstein et al., 2014; Mitchell et al., 2014; Watkins et al., 2014). Most important, beyond GPS feasibility work, future studies should examine relationships between neighbourhood characteristics (e.g. crime rate, density of fast food restaurants, distance to the nearest park) and health outcomes (e.g. physical activity, obesity and hypertension) using GPS methods among low-income housing residents to overcome the limitations of most existing spatial epidemiology research that includes solely examining the residential neighbourhood environment (Chaix et al., 2009; Matthews, 2011; Kwan, 2012a, 2012b). Such research will advance the spatial epidemiology literature and importantly minimise spatial misclassification (Duncan et al., 2014).
Study limitations
We used a survey approach, in part to measure the success of GPS feasibility, which may be a limitation of the study. Participants may have succumbed to social desirability bias. We also note that missing GPS data could be related to participant characteristics. Individuals who wore the GPS device and charged the battery, for example, might be different from those who do not. Participants could have changed their spatial patterns given our distribution of GPS devices leading to potential reactivity bias. We believe, however, that these issues are minimal. For example, in the post-GPS survey we asked the question, “Did using the GPS device cause you to alter your behaviour?” and 95% of the sample said “no”. Therefore, we do not believe that the GPS devices altered most participants' behaviour - at least not in substantial ways. This study was based on a convenience sample, which may have consisted of individuals who were more motivated to be in the study and to complete the GPS protocol. This could have increased the likelihood of success of the GPS protocol. Finally, this study was conducted among a relatively small sample of low-income housing residents in NYC. As such, our findings may only be generalisable to similar low-income populations in other urban areas. However, while 120 participants is a relatively small sample size for general population health research, based on our review of the accumulated literature, many GPS studies have fewer than 100 participants so the sample size in this study is on par with and even exceeds the sample sizes of a great deal of GPS-based research. We also note that most of our sample reported that they resided in Manhattan (64.2%) and almost a quarter (23.3%) reported that they resided in Queens, which are only two of the five boroughs of NYC and therefore our results are not necessarily generalisable to all low-income individuals in NYC. This study was conducted in a large metropolitan location and there are known issues with large buildings and potential GPS errors due to “multi-path reflectance” (Georgiadou and Kleusberg, 1988). In addition to the multi-path error, individuals in NYC often travel via the subway system and while they are underground GPS receivers are unable to obtain signals from GPS satellites, which may lead to additional data loss. While GPS signals may be lost periodically in the context of a large metro area such as NYC, these data are still valuable in determining general activity space and in evaluating how participants travel throughout neighbourhoods and the built environment. It is also important to underscore that this study was conducted among English-speaking, low-income housing residents. When recruiting, we interacted with some non-English speaking, low-income housing residents, including people who spoke Spanish and Asian languages. This is an additional limitation of this research because our sample likely does not represent all cultural aspect of low-income housing residents. As such, the study does not represent all low-income housing residents.
Conclusion
Findings demonstrate that utilising GPS methods among a low-income population is acceptable and feasible. GPS devices may be used in spatial epidemiology research in low-income and potentially other key vulnerable populations to understand geospatial determinants of obesity, hypertension and other diseases that these populations disproportionately experience.
Acknowledgments
The NYC Low-income Housing, Neighbourhoods and Health Study was supported by the NYU-HHC Clinical and Translational Science Institute (CTSI) Pilot Project Awards Program (Dr. Dustin T. Duncan, Principal Investigator). The NYU-HHC CTSI is supported in part by grant UL1TR000038 (Dr. Bruce Cronstein, Principal Investigator and Dr. Judith Hochman, co-Principal Investigator) from the National Center for Advancing Translational Sciences of the National Institutes of Health. We thank the research assistants for this project (who all commented on an early version of the manuscript): Maliyhah Al-Bayan; Shilpa Dutta; William Goedel; Brittany Gozlan; Kenneth Pass; James Williams; and Abebayehu Yilma. We thank Dr. Desmond Patton and Dr. DeMarc Hickson for commenting on an early version of the manuscript. We also thank the participants for taking time to participate in this research. We additionally thank Jonathan Cantor for conducting the statistical analyses. Finally, we acknowledge the efforts of Kenneth Pass and James Williams for their assistance with the preparation of this manuscript.
References
- Abidin NZ, Adam MB. Prediction of vertical jump height from anthropometric factors in male and female martial arts athletes. Malays J Med Sci. 2013;20:39–45. [PMC free article] [PubMed] [Google Scholar]
- Bacardí-Gascón M, Jones EG, Jiménez-Cruz A. Prevalence of obesity and abdominal obesity from four to 16 years old children living in the Mexico-USA border. Nutr Hosp. 2013;28:479–485. doi: 10.3305/nh.2013.28.2.6257. [DOI] [PubMed] [Google Scholar]
- Bammann K, Huybrechts I, Vicente-Rodriguez G, Easton C, De Vriendt T, Marild S, Mesana M, Peeters M, Reilly J, Sioen I. Validation of anthropometry and foot-to-foot bioelectrical resistance against a three-component model to assess total body fat in children: the IDEFICS study. Int J Obes (Lond) 2013;37:520–526. doi: 10.1038/ijo.2013.13. [DOI] [PubMed] [Google Scholar]
- Bennett GG, Wolin K, Duncan DT. Social determinants of obesity. In: Hu F, editor. Obesity epidemiology: methods and applications. Oxford: Oxford University Press; 2008. pp. 342–376. [Google Scholar]
- Boruff BJ, Nathan A, Nijënstein S. Using GPS technology to (re)-examine operational definitions of ‘neighbourhood’ in place-based health research. Int J Health Geogr. 2012;11:22. doi: 10.1186/1476-072X-11-22. [DOI] [PMC free article] [PubMed] [Google Scholar]
- Braunstein JB, Sherber NS, Schulman SP, Ding EL, Powe NR. Race, medical researcher distrust, perceived harm and willingness to participate in cardiovascular prevention trials. Medicine. 2008;87:1–9. doi: 10.1097/MD.0b013e3181625d78. [DOI] [PubMed] [Google Scholar]
- Chaix B, Meline J, Duncan S, Merrien C, Karusisi N, Perchoux C, Lewin A, Labadi K, Kestens Y. GPS tracking in neighbourhood and health studies: a step forward for environmental exposure assessment, a step backward for causal inference? Health Place. 2013;21:46–51. doi: 10.1016/j.healthplace.2013.01.003. [DOI] [PubMed] [Google Scholar]
- Chaix B, Merlo J, Evans D, Leal C, Havard S. Neighbourhoods in eco-epidemiologic research: delimiting personal exposure areas. A response to Riva, Gauvin, Apparicio and Brodeur. Soc Sci Med. 2009;69:1306–1310. doi: 10.1016/j.socscimed.2009.07.018. [DOI] [PubMed] [Google Scholar]
- Christian WJ. Using geospatial technologies to explore activity-based retail food environments. Spat Spatiotemporal Epidemiol. 2012;3:287–295. doi: 10.1016/j.sste.2012.09.001. [DOI] [PubMed] [Google Scholar]
- Corbie-Smith G, Thomas SB, St George SM. Distrust, race and research. Arch Intern Med. 2002;162:2458–2463. doi: 10.1001/archinte.162.21.2458. [DOI] [PubMed] [Google Scholar]
- Dessing D, de Vries S, Graham J, Pierik F. Active transport between home and school assessed with GPS: a cross-sectional study among Dutch elementary school children. BMC Public Health. 2014;14:227. doi: 10.1186/1471-2458-14-227. [DOI] [PMC free article] [PubMed] [Google Scholar]
- Digenis-Bury EC, Brooks DR, Chen L, Ostrem M, Horsburgh CR. Use of a population-based survey to describe the health of Boston public housing residents. Am J Public Health. 2008;98:85. doi: 10.2105/AJPH.2006.094912. [DOI] [PMC free article] [PubMed] [Google Scholar]
- Du J, Aultman-Hall L. Increasing the accuracy of trip rate information from passive multi-day GPS travel datasets: automatic trip end identification issues. Transport Res A-Pol. 2007;41:220–232. [Google Scholar]
- Duncan DT, Kawachi I, Subramanian S, Aldstadt J, Melly SJ, Williams DR. Examination of how neighbourhood definition influences measurements of youths' access to tobacco retailers: a methodological note on spatial misclassification. Am J Epidemiol. 2014;179:373–381. doi: 10.1093/aje/kwt251. [DOI] [PMC free article] [PubMed] [Google Scholar]
- Duncan JS, Badland HM, Schofield G. Combining GPS with heart rate monitoring to measure physical activity in children: a feasibility study. J Sci Med Sport. 2009;12:583–585. doi: 10.1016/j.jsams.2008.09.010. [DOI] [PubMed] [Google Scholar]
- Dunton GF, Liao Y, Almanza E, Jerrett M, Spruijt-Metz D, Pentz MA. Locations of joint physical activity in parent-child pairs based on accelerometer and GPS monitoring. Ann Behav Med. 2013;45:S162–S172. doi: 10.1007/s12160-012-9417-y. [DOI] [PMC free article] [PubMed] [Google Scholar]
- Ellen IG, Mijanovich T, Dillman KN. Neighbourhood effects on health: exploring the links and assessing the evidence. J Urban Aff. 2001;23:391–408. [Google Scholar]
- Epstein DH, Tyburski M, Craig IM, Phillips KA, Jobes ML, Vahabzadeh M, Mezghanni M, Lin JL, Furr-Holden CDM, Preston KL. Real-time tracking of neighbourhood surroundings and mood in urban drug misusers: application of a new method to study behavior in its geographical context. Drug Alcohol Depend. 2014;134:22–29. doi: 10.1016/j.drugalcdep.2013.09.007. [DOI] [PMC free article] [PubMed] [Google Scholar]
- Ford JG, Howerton MW, Lai GY, Gary TL, Bolen S, Gibbons MC, Tilburt J, Baffi C, Tanpitukpongse TP, Wilson RF. Barriers to recruiting underrepresented populations to cancer clinical trials: a systematic review. Cancer. 2008;112:228–242. doi: 10.1002/cncr.23157. [DOI] [PubMed] [Google Scholar]
- Geeta A, Jamaiyah H, Safiza M, Khor GL, Kee C, Ahmad A, Suzana S, Rahmah R, Faudzi A. Reliability, technical error of measurements and validity of instruments for nutritional status assessment of adults in Malaysia. Singapore Med J. 2009;50:1013–1018. [PubMed] [Google Scholar]
- Georgiadou Y, Kleusberg A. On carrier signal multipath effects in relative GPS positioning. Manuscr Geodaet. 1988;13:172–179. [Google Scholar]
- Harley AE, Katz ML, Heaney CA, Duncan DT, Buckworth J, Odoms-Young A, Willis SK. Social support and companionship among active African American women. Am J Health Behav. 2009;33:673–685. doi: 10.5993/ajhb.33.6.5. [DOI] [PubMed] [Google Scholar]
- Harris PA, Taylor R, Thielke R, Payne J, Gonzalez N, Conde JG. Research electronic data capture (REDCap) - a metadata - driven methodology and workflow process for providing translational research informatics support. J Biomed Inform. 2009;42:377–381. doi: 10.1016/j.jbi.2008.08.010. [DOI] [PMC free article] [PubMed] [Google Scholar]
- Heinrich KM, Lee RE, Regan GR, Reese-Smith JY, Howard HH, Haddock KC, Poston CWS, Ahluwalia JS. How does the built environment relate to body mass index and obesity prevalence among public housing residents? Am J Health Promot. 2008;22:187–194. doi: 10.4278/ajhp.22.3.187. [DOI] [PubMed] [Google Scholar]
- Hess PL, Reingold JS, Jones J, Fellman MA, Knowles P, Ravenell JE, Kim S, Raju J, Ruger E, Clark S. Barbershops as hypertension detection, referral and follow-up centers for black men. Hypertension. 2007;49:1040–1046. doi: 10.1161/HYPERTENSIONAHA.106.080432. [DOI] [PubMed] [Google Scholar]
- Hurvitz PM, Moudon AV. Home versus nonhome neighbourhood: quantifying differences in exposure to the built environment. Am J Prev Med. 2012;42:411–417. doi: 10.1016/j.amepre.2011.11.015. [DOI] [PMC free article] [PubMed] [Google Scholar]
- Kawachi I, Berkman LF. Neighbourhoods and health. Oxford: Oxford University Press; 2003. [Google Scholar]
- Kirchner TR, Cantrell J, Anesetti-Rothermel A, Ganz O, Vallone DM, Abrams DB. Geospatial exposure to point-of-sale tobacco: real-time craving and smoking-cessation outcomes. Am J Prev Med. 2013;45:379–385. doi: 10.1016/j.amepre.2013.05.016. [DOI] [PMC free article] [PubMed] [Google Scholar]
- Klinker CD, Schipperijn J, Christian H, Kerr J, Ersbøll AK, Troelsen J. Using accelerometers and global positioning system devices to assess gender and age differences in children's school, transport, leisure and home based physical activity. Int J Behav Nutr Phys Act. 2014;11:8. doi: 10.1186/1479-5868-11-8. [DOI] [PMC free article] [PubMed] [Google Scholar]
- Kwan MP. How GIS can help address the uncertain geographic context problem in social science research. Ann GIS. 2012a;18:245–255. [Google Scholar]
- Kwan MP. The uncertain geographic context problem. Ann Assoc Am Geogr. 2012b;102:958–968. [Google Scholar]
- Lovasi GS, Hutson MA, Guerra M, Neckerman KM. Built environments and obesity in disadvantaged populations. Epidemiol Rev. 2009;31:7–20. doi: 10.1093/epirev/mxp005. [DOI] [PubMed] [Google Scholar]
- Matthews SA. Spatial polygamy and the heterogeneity of place: studying people and place via egocentric methods. In: Burton LM, Matthews SA, Leung MC, Kemp SP, Takeuchi DT, editors. Communities, neighbourhoods and health. New York: Springer; 2011. pp. 35–55. [Google Scholar]
- McAlexander KM, Banda JA, McAlexander JW, Lee RE. Physical activity resource attributes and obesity in low-income African Americans. J Urban Health. 2009;86:696–707. doi: 10.1007/s11524-009-9385-0. [DOI] [PMC free article] [PubMed] [Google Scholar]
- McCluskey A, Ada L, Dean CM, Vargas J. Feasibility and validity of a wearable GPS device for measuring outings after stroke. ISRN Rehabilitation 2012 2012 [Google Scholar]
- McGurk P, Jackson JM, Elia M. Rapid and reliable self-screening for nutritional risk in hospital outpatients using an electronic system. Nutrition. 2013;29:693–696. doi: 10.1016/j.nut.2012.12.020. [DOI] [PubMed] [Google Scholar]
- Mitchell JT, Schick R, Hallyburton M, Dennis M, Kollins S, Beckham J, McClernon F. Combined ecological momentary assessment and global positioning system tracking to assess smoking behavior: a proof of concept study. J Dual Diagn. 2014;10:19–29. doi: 10.1080/15504263.2013.866841. [DOI] [PMC free article] [PubMed] [Google Scholar]
- Morabia A, Amstislavski PN, Mirer FE, Amstislavski TM, Eisl H, Wolff MS, Markowitz SB. Air pollution and activity during transportation by car, subway and walking. Am J Prev Med. 2009;37:72–77. doi: 10.1016/j.amepre.2009.03.014. [DOI] [PubMed] [Google Scholar]
- Morabia A, Mirer FE, Amstislavski TM, Eisl HM, Werbe-Fuentes J, Gorczynski J, Goranson C, Wolff MS, Markowitz SB. Potential health impact of switching from car to public transportation when commuting to work. Am J Public Health. 2010;100:2388–2391. doi: 10.2105/AJPH.2009.190132. [DOI] [PMC free article] [PubMed] [Google Scholar]
- Mujahid MS, Diez Roux AV, Morenoff JD, Raghunathan TE, Cooper RS, Ni H, Shea S. Neighbourhood characteristics and hypertension. Epidemiology. 2008;19:590–598. doi: 10.1097/EDE.0b013e3181772cb2. [DOI] [PubMed] [Google Scholar]
- O'Connor TM, Cerin E, Robles J, Lee RE, Kerr J, Butte N, Mendoza J, Thompson D, Baranowski T. Feasibility study to objectively assess activity and location of Hispanic preschoolers: a short communication. Geospat Health. 2013;7:375–380. doi: 10.4081/gh.2013.94. [DOI] [PMC free article] [PubMed] [Google Scholar]
- Ojiambo R, Gibson AR, Konstabel K, Lieberman DE, Speakman JR, Reilly JJ, Pitsiladis YP. Free-living physical activity and energy expenditure of rural children and adolescents in the Nandi region of Kenya. Ann Hum Biol. 2013;40:318–323. doi: 10.3109/03014460.2013.775344. [DOI] [PubMed] [Google Scholar]
- Oliver M, Badland HM, Mavoa S, Duncan MJ, Duncan J. Combining GPS, GIS and accelerometry: methodological issues in the assessment of location and intensity of travel behaviors. J Phys Act Health. 2010;7:102–108. doi: 10.1123/jpah.7.1.102. [DOI] [PubMed] [Google Scholar]
- Paz-Soldan VA, Stoddard ST, Vazquez-Prokopec G, Morrison AC, Elder JP, Kitron U, Kochel TJ, Scott TW. Assessing and maximizing the acceptability of global positioning system device use for studying the role of human movement in dengue virus transmission in Iquitos, Peru. Am J Trop Med Hyg. 2010;82:723–30. doi: 10.4269/ajtmh.2010.09-0496. [DOI] [PMC free article] [PubMed] [Google Scholar]
- Prushansky T, Geller S, Avraham A, Furman C, Sela L. Angular and linear spinal parameters associated with relaxed and erect postures in healthy subjects. Physiother Theory Pract. 2013;29:249–257. doi: 10.3109/09593985.2012.717590. [DOI] [PubMed] [Google Scholar]
- Ravenell J, Thompson H, Cole H, Plumhoff J, Cobb G, Afolabi L, Boutin-Foster C, Wells M, Scott M, Ogedegbe G. A novel community-based study to address disparities in hypertension and colorectal cancer: a study protocol for a randomized control trial. Trials. 2013;14:287. doi: 10.1186/1745-6215-14-287. [DOI] [PMC free article] [PubMed] [Google Scholar]
- Robinson AI, Oreskovic NM. Comparing self-identified and census-defined neighbourhoods among adolescents using GPS and accelerometer. Int J Health Geogr. 2013;12:57. doi: 10.1186/1476-072X-12-57. [DOI] [PMC free article] [PubMed] [Google Scholar]
- Scharf DM, Martino SC, Setodji CM, Staplefoote BL, Shadel WG. Middle and high school students' exposure to alcohol- and smoking-related media: a pilot study using ecological momentary assessment. Psychol Addict Behav. 2013;27:1201–1206. doi: 10.1037/a0032555. [DOI] [PMC free article] [PubMed] [Google Scholar]
- Seto EY, Sousa-Figueiredo JC, Betson M, Byalero C, Kabatereine NB, Stothard JR. Patterns of intestinal schistosomiasis among mothers and young children from Lake Albert, Uganda: water contact and social networks inferred from wearable global positioning system dataloggers. Geospat Health. 2012;7:1–13. doi: 10.4081/gh.2012.99. [DOI] [PubMed] [Google Scholar]
- Shavers VL, Lynch CF, Burmeister LF. Racial differences in factors that influence the willingness to participate in medical research studies. Ann Epidemiol. 2002;12:248–256. doi: 10.1016/s1047-2797(01)00265-4. [DOI] [PubMed] [Google Scholar]
- Thomas DR. A general inductive approach for analyzing qualitative evaluation data. Am J Eval. 2006;27:237–246. [Google Scholar]
- Thomas E, Collins A, McCarthy J, Fitzpatrick J, Durighel G, Goldstone A, Bell J. Estimation of abdominal fat compartments by bioelectrical impedance: the validity of the ViScan measurement system in comparison with MRI. Eur J Clin Nutr. 2010;64:525–533. doi: 10.1038/ejcn.2010.18. [DOI] [PubMed] [Google Scholar]
- Victor RG, Ravenell JE, Freeman A, Leonard D, Bhat DG, Shafiq M, Knowles P, Storm JS, Adhikari E, Bibbins-Domingo K. Effectiveness of a barber-based intervention for improving hypertension control in black men: the BARBER-1 study: a cluster randomized trial. Arch Intern Med. 2011;171:342–350. doi: 10.1001/archinternmed.2010.390. [DOI] [PMC free article] [PubMed] [Google Scholar]
- Watkins KL, Regan SD, Nguyen N, Businelle MS, Kendzor DE, Lam C, Balis D, Cuevas AG, Cao Y, Reitzel LR. Advancing cessation research by integrating EMA and geospatial methodologies: associations between tobacco retail outlets and real-time smoking urges during a quit attempt. Nicotine Tob Res. 2014;16:S93–S101. doi: 10.1093/ntr/ntt135. [DOI] [PMC free article] [PubMed] [Google Scholar]
- Webber SC, Porter MM. Monitoring mobility in older adults using global positioning system (GPS) watches and accelerometers: a feasibility study. J Aging Phys Act. 2009;17:455–467. doi: 10.1123/japa.17.4.455. [DOI] [PubMed] [Google Scholar]
- Yahia N, El-Ghazale H, Achkar A, Rizk S. Dieting practices and body image perception among Lebanese university students. Asia Pac J Clin Nutr. 2011;20:21–28. [PubMed] [Google Scholar]
- Yan K, Tracie B, Marie-Ève M, Mélanie H, Jean-Luc B, Benoit T, St-Onge M, Marie L. Innovation through wearable sensors to collect real-life data among pediatric patients with cardiometabolic risk factors. Int J Pediatr. 2014;2014:328076. doi: 10.1155/2014/328076. [DOI] [PMC free article] [PubMed] [Google Scholar]
- Yen IH, Leung CW, Lan M, Sarrafzadeh M, Kayekjian KC, Duru OK. A pilot study using global positioning systems (GPS) devices and surveys to ascertain older adults' travel patterns. J Appl Gerontol. 2013 doi: 10.1177/0733464813479024. 0733464813479024. [DOI] [PubMed] [Google Scholar]
- Zenk SN, Schulz AJ, Matthews SA, Odoms-Young A, Wilbur J, Wegrzyn L, Gibbs K, Braunschweig C, Stokes C. Activity space environment and dietary and physical activity behaviors: a pilot study. Health Place. 2011;17:1150–1161. doi: 10.1016/j.healthplace.2011.05.001. [DOI] [PMC free article] [PubMed] [Google Scholar]
- Zenk SN, Schulz AJ, Odoms-Young A, Wilbur J, Matthews SA, Gamboa C, Wegrzyn LR, Hobson S, Stokes C. Feasibility of using global positioning systems (GPS) with diverse urban adults: before and after data on perceived acceptability, barriers and ease of use. J Phys Act Health. 2012;9:924–934. doi: 10.1123/jpah.9.7.924. [DOI] [PMC free article] [PubMed] [Google Scholar]