Abstract
Objectives
Ossicular discontinuity may be complete, with no contact between the disconnected ends, or partial, where normal contact at an ossicular joint or along a continuous bony segment of an ossicle is replaced by soft tissue or simply by contact of opposing bones. Complete ossicular discontinuity typically results in an audiometric pattern of a large, flat conductive hearing loss. In contrast, in cases where otomicroscopy reveals a normal external ear canal and tympanic membrane, high frequency conductive hearing loss has been proposed as an indicator of partial ossicular discontinuity. Nevertheless, the diagnostic utility of high-frequency conductive hearing loss has been limited due to gaps in previous research on the subject, and clinicians often assume that an audiogram showing high-frequency conductive hearing loss is flawed.
This study aims to improve the diagnostic utility of high-frequency conductive hearing loss in cases of partial ossicular discontinuity by: (1) making use of a control population against which to compare the audiometry of partial ossicular discontinuity patients, and (2) examining the correlation between high-frequency conductive hearing loss and partial ossicular discontinuity under controlled experimental conditions on fresh cadaveric temporal bones. Furthermore, ear-canal measurements of umbo velocity and wideband acoustic immittance measurements were investigated to determine usefulness regarding diagnosis of ossicular discontinuity.
Design
We analyzed audiograms from 66 patients with either form of surgically-confirmed ossicular discontinuity and no confounding pathologies. We also analyzed umbo velocity (n=29) and power reflectance (n=12) measurements from a subset of these patients. Finally, we performed experiments on 6 fresh temporal bone specimens to study the differing mechanical effects of complete and partial discontinuity. The mechanical effects of these lesions were assessed via laser Doppler measurements of stapes velocity. In a subset of the specimen (n=4), wideband acoustic immittance measurements were also collected.
Results
(1) Calculations comparing the air-bone gap (ABG) at high- and low-frequencies show that when high-frequency ABGs are larger than low-frequency ABGs, the surgeon usually reported soft tissue bands at the point of discontinuity. However, in cases with larger low-frequency ABGs and flat ABGs across frequencies, some partial discontinuities as well as complete discontinuities were reported. (2) Analysis of umbo velocity and power reflectance (calculated from wideband acoustic immittance) in patients revealed no significant difference across frequencies between the two types of ossicular discontinuities. (3) Temporal bone experiments reveal that partial discontinuity results in a greater loss in stapes velocity at high frequencies as compared to low frequencies, whereas with complete discontinuity, large losses in stapes velocity occur at all frequencies.
Conclusions
Our clinical and experimental findings suggest that when encountering larger ABGs at high frequencies as compared to low frequencies, partial ossicular discontinuity should be considered in the differential diagnosis.
Keywords: Ossicular discontinuity, ossicular interruption, ossicular disruption, air bone gap, audiogram, wideband immittance, laser Doppler vibrometry
INTRODUCTION
Ossicular discontinuity (OD) is a separation of the middle ear ossicles that can occur at one of the joints or within a bone (e.g. fracture). This separation may be complete, with no contact between the disconnected ends, or partial, where normal contact at an ossicular joint or along a continuous bony segment of an ossicle is replaced by softer tissue or simply by contact of opposing bones. Complete OD typically results in an audiometric pattern of a large, flat conductive hearing loss (CHL); the absence of a mechanical connection between the tympanic membrane (TM) and stapes footplate prevents the transmission of all sound frequencies. In contrast, in cases where otomicroscopy reveals a normal external ear canal and TM, high-frequency CHL has been proposed as an indicator of partial OD (Anderson and Barr 1971, Mustain and Hasseltine 1981, Marshall et al. 1983, Chien et al. 2008, Merchant et al. 2010, Sim et al. 2013). The connective tissue in partial OD is believed to transmit low frequency sounds more effectively than high frequency sounds, resulting in CHL primarily at high frequencies (Anderson and Barr 1971, Mustain and Hasseltine 1981, Chien et al. 2008, Sim et al. 2013).
Ossicular discontinuity is generally diagnosed using a combination of audiometry, CT imaging, and patient history (e.g. head trauma), and is confirmed during middle ear surgery. However, it can be difficult to differentiate partial versus complete discontinuity even during ear surgery. Depending on the location of the discontinuity, the proximity of the disconnected ends and soft tissue (if present) that is space-filling or overlying a fracture line makes it challenging to visually determine if a connection is present. Even if it appears that a small amount of tissue is connecting the two disconnected ends, the quality and conductivity of this tissue can be challenging to determine (i.e. substantial fibrous tissue may provide a great deal of conduction whereas flimsy mucosal tissue may provide little to none).
This manuscript studies the hypothesis that high-frequency CHL can be the result of partial discontinuity of the ossicles – not the common assumption that high-frequency CHL is an erroneous measurement. For example, ear canal collapse due to pressure of the earphone on the pinna during audiometry can display erroneous air-bone gaps at high-frequencies (Mahoney and Luxon, 1996). High-frequency air-bone gaps have also been implicated to be the result of instrument calibration errors (Margolis et al, 2013) and technical error of the audiologist.
The present study addresses gaps in previous research correlating partial OD with high-frequency CHL. No identifiable studies to-date made use of a control population against which to compare the audiometry of partial OD patients. Thus, the diagnostic utility of high-frequency CHL has been limited. Furthermore, the correlation between high-frequency CHL and partial OD has not been examined previously under controlled experimental conditions on fresh cadaveric temporal bones.
In this paper, we compare audiometric data from patients with both types of ossicular discontinuity to determine the correlation between high-frequency CHL and partial OD in the presence of an intact TM and an aerated middle ear. We also analyze umbo velocity (UV) measured by laser-Doppler vibrometry and power reflectance (PR) obtained from ear canal wideband acoustic immittance measurements from a subset of OD patients to determine the changes in middle ear mechanics (measured at the ear canal) caused by complete and partial OD. Finally, we measure stapes velocity (SV) (estimate of CHL) on controlled fresh temporal bone preparations to further study the mechanical and sound transmission effects of partial and complete OD.
MATERIALS AND METHODS
This study was approved by the Human Studies Committee of the Massachusetts Eye and Ear Infirmary (MEEI). For inclusion in the study, patients had to meet all of the following criteria: (1) diagnosis of ossicular discontinuity confirmed during surgery, (2) absence of confounding pathologies, such as cholesteatoma, tympanic membrane lesions, and retrocochlear disease, and (3) audiometry and operative reports on file.
Patient data was obtained in two ways. First, 29 patients recruited from the MEEI otology clinic for UV and/or PR measurements that met the above inclusion criteria were included in the study. UV data was available for all 29 of these patients; PR data was also available for 12 of these patients. Second, to increase our sample size of audiometric data, a retrospective review of 214 patients with ossicular discontinuity diagnosis between January 2008 and October 2013 at MEEI revealed an additional 37 patients meeting the inclusion criteria.
In total, the audiometric data for 66 patients (35 males, 31 females; 16 to 70 years of age; mean age 42.3 years) was analyzed. 60 patients had discontinuities involving only the incus and/or stapes; 3 patients had discontinuities involving the malleus alone; 3 other patients had discontinuities involving the malleus and the incus and/or stapes. Operating reports rarely provided anatomical details regarding discontinuities. However, past literature suggests there is no correlation between the specific location of an ossicular discontinuity and audiometric pattern (Anderson and Barr 1971).
Audiometry
As standard practice, MEEI uses insert earphones during audiometric testing. This reduces the likelihood of erroneous high-frequency CHL caused by ear canal collapse.
Patient Categorization
We ultimately categorized the patients in two different ways, first by surgical findings, and second by patterns in their air-bone gap measurements.
Based on the surgeon’s operative notes and sketches, patients were initially separated into one of two categories: surgical partial or surgical complete discontinuity. Patients were categorized as surgical partial discontinuity if their surgical reports mentioned soft tissue in the area of the disruption, or if their surgical reports mentioned only a fracture or partial dislocation (i.e. wherein bony ends remain in contact and no erosion is present) in the ossicular chain. Patients were categorized as surgical complete discontinuity if their surgical findings included a complete separation and/or at least one eroded or missing ossicle, with no mention of soft tissue spanning the interruption. 40 patients were categorized as surgical partial discontinuity and 26 patients were categorized as surgical complete discontinuity.
Categorizing discontinuities as partial or complete based on retrospective reviews of surgical reports was challenging. While every effort was made to categorize each patient accurately, uncertainty regarding the presence and/or composition of soft tissue between disconnected bony ends likely resulted in uncontrolled variability. Surgeons vary in their method of reporting; some surgeons may report as “complete” although there may be connecting tissue, while others may report details on the existence and type of connecting tissue.
We further analyzed the data using pre-operative audiometric results. Based on air-bone gap (ABG) trends across frequencies, patients were separated into one of three categories: (1) high-frequency CHL, which we hypothesized represented patients with partial OD; (2) large CHL, which we hypothesized represented patients with complete OD; and (3) other CHL, which consisted of patients not fitting either category. As summarized in Table 1, patients were categorized as: (1) high-frequency CHL if their mean ABG for 2-4 kHz exceeded their mean ABG for 0.25-0.5 kHz by 10 dB or more, and their mean ABG for 0.25-0.5 kHz was less than or equal to 20 dB. (2) Patients not meeting the condition for high-frequency CHL were categorized as large CHL if their mean ABG for 0.25-4 kHz (all frequencies of bone-conduction measured) was greater than or equal to 40 dB. (3) Finally, patients were categorized as other CHL if they did not meet the criteria for either high-frequency or large CHL.
Table 1.
Patient Categorizations Based on CHL Trends.
| Category | Criteria | Number of patients |
|---|---|---|
|
High-frequency
CHL |
Mean ABG for 2-4 kHz ≥ mean ABG for 0.25-0.5 kHz +10 dB Mean ABG for 0.25-0.5 kHz ≤ 20 dB |
8 |
| Large CHL | Mean ABG for 0.25-4 kHz ≥ 40 dB | 25 |
| Other CHL | Does not meet criteria for either of the above categories | 33 |
Umbo Velocity (UV)
Laser Doppler vibrometry (Polytec, Inc.) was used to measure UV in the manner described in Rosowski et al. (2008, 2012). A laser beam was focused on the light reflex near the umbo of the tympanic membrane while a 9-tone stimulus was played into the ear canal. Simultaneous measurements of velocity and sound pressure near the tympanic membrane led to normalized calculations of UV, the ratio of velocity to sound pressure.
Power Reflectance (PR)
Wideband acoustic immittance responses to a chirp stimulus from 0.2 to 6.0 kHz were collected using the Mimosa reflectance system with a sound source and microphone coupled to the ear canal via a foam tip, similar to the method detailed in Rosowski et al. (2012). PR equals the square of the magnitude of pressure reflectance, which is the complex ratio between the reflected pressure wave and the forward pressure wave. PR has a value between 0 (all power absorbed) and 1 (all power reflected). For each patient, two measurements were taken and averaged.
The UV and PR data were compared against normative data obtained in a study of 58 strictly defined normal ears (Rosowski et al. 2012).
Temporal Bone Experiment
6 human cadaveric temporal bones were collected from donors with no known history of ear disease. The bones were fresh without preservative (though some previously frozen). In all 6 specimens, laser Doppler vibrometry was used to measure UV and SV as in previous studies (Nakajima et al. 2005). SV was measured to determine the effect of experimental manipulations on sound transfer through the middle ear to the inner ear. Similar to the setup for measuring UV in patients, a cylindrical sound coupler with an attached probe-tube microphone and speaker output, as well as a clear coverslip to allow visualization of the TM, was coupled to the speculum in the ear canal. The laser beam of the vibrometer was focused through the ear canal apparatus on reflective beads placed on the umbo. For SV measurement, the laser was focused through the opened facial recess on reflective beads placed on the posterior crus. Sound pressure in the ear canal was then measured (within 2 mm of the TM) while single tone sound stimuli of frequency from 0.2 to 20 kHz were presented at levels between 70 and 90 dB SPL. Normalized umbo and stapes velocities were quantified as the ratio of measured velocity to simultaneously measured sound pressure in the ear canal at the TM.
In a subset of these specimens (n=4), PR responses to a wideband chirp stimulus were collected using either the Mimosa Acoustic HearID system (Champaign, IL, USA; 0.2-6 kHz) or HARP system (designed by J. H. Siegel at Northwestern University utilizing the ER-10B probe tube microphone by Etymotic Research, 0.2-20 kHz). Detailed methods for PR measurements have been described earlier (Nakajima et al. 2012; Rosowski et al. 2012).
Measurements were made on the specimen in the completely disarticulated state (in which there was a gap of air between the incus and stapes), as well as in a partially disarticulated state (in which there was a soft connection at the incudostapedial (IS) joint made with dental impression material (Jeltrate)), and in an articulated state. For measurements in the articulated state, 2 of the temporal bones had IS joints that were in their normal natural state. In 4 of the temporal bones, the IS joint was reestablished using a small application of dental cement to create the articulated state. To ensure the validity of these measurements, a bone with a normal, intact ossicular chain was subjected to measurements of UV and PR before manipulation of the IS joint, and again after disarticulating and then reestablishing the IS joint with dental cement. The measurements in the initial state and after rearticulating the IS joint were similar (within 2 dB), confirming that reestablishing the IS joint with dental cement adequately mimics the mechanics of a normal bone.
Statistical Analysis of Audiometric, UV, and PR Results
Statistical significances were assessed using independent student t-tests. The significance level of each individual t-test was set to 0.05/n, where n was the sample size of the group.
RESULTS
Clinical Results
Categorization by Surgical Report
Patients were separated into one of two categories, surgical partial or surgical complete discontinuity, based on the surgeon’s operative notes and sketches. Surgeons often reported soft tissue (i.e., fibrous adhesions, mucosal bands, mucosal membranes, and scar tissue) spanning the point of ossicular disruption. However, operative reports rarely provided details on the quality and stiffness of this soft tissue. As a result, it was difficult to determine if the reported soft tissue created a mechanical connection that allowed for the transmission of sound. In order to be uniform and impartial, we chose to assume any soft tissue at a discontinuity could create a mechanical connection. This choice skewed the categorization process towards surgical partial discontinuity by assuming that any tissue present makes a significant mechanical connection; on the other hand, those cases categorized as surgical complete discontinuity are more likely truly complete interruptions. However, some surgeons may not have reported on tissue between the ossicles even when present.
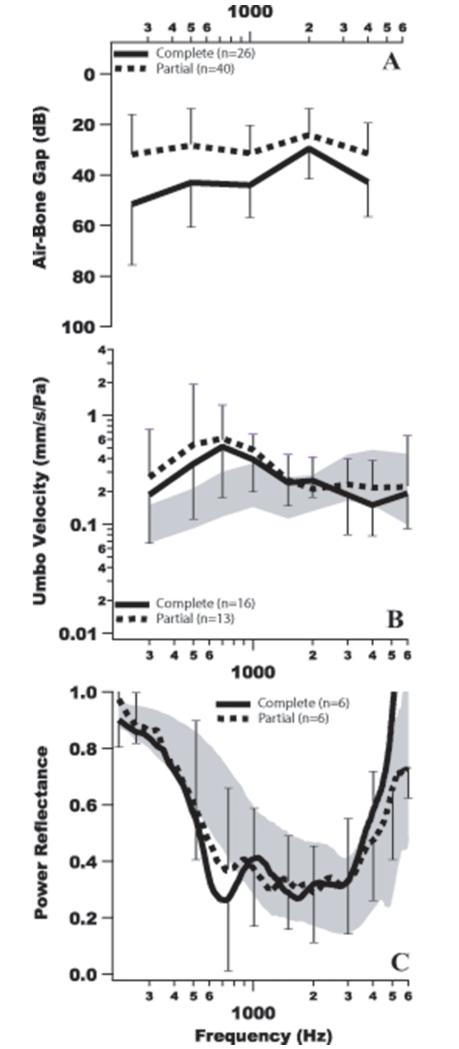
Figure 1A shows mean +/− one standard deviation ABG results for the surgical partial and surgical complete discontinuity groups. The mean ABG for the surgical complete group ranges between 35 and 50 dB, and as expected is 5 to 20 dB larger than the surgical partial group at all frequencies. However, the hypothesis that partial discontinuity results in high-frequency CHL is not supported – the mean ABG for the surgical partial discontinuity group is quite flat and hovers near 30 dB across all frequencies.
Figure 1.
Mean values for (A) ABG, (B) umbo velocity and (C) power reflectance for the surgical partial discontinuity (dashed lines) and surgical complete discontinuity (solid lines) patient groups. Bars represent +/− one standard deviation around the mean. The gray shaded region represents normative data +/− one standard deviation around the normal mean.
Figures 1B and C show mean +/− one standard deviation UV and PR results, respectively, for the surgical partial and surgical complete discontinuity groups. The UV data is almost identical for the two groups, while the PR for the surgical complete group appears to have a notch of slightly larger magnitude than that of the surgical partial group. That said, there is significant overlap in the standard deviations between the groups around the notch frequency range. Based on t-test calculations, differences in mean UV and mean PR results are not statistically significant at any frequency, suggesting that the two groups exhibit similar middle ear mechanics at the level of the ear canal.
Categorization by Audiometry
Individual Results
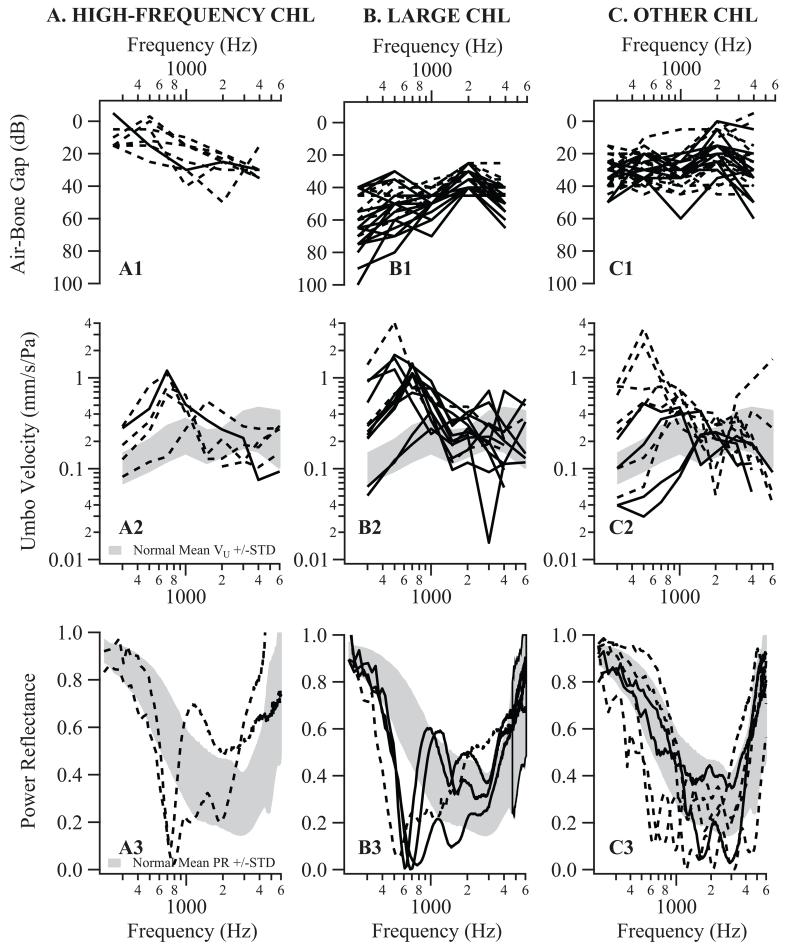
Given the difficulty in categorizing patients by surgical report with reasonable certainty, we introduced an alternate categorization based on audiometrically defined CHL pattern, as detailed under Methods. Figure 2 shows individual ABG (top 1st row), UV (middle 2nd row), and PR (bottom 3rd row) results for patient groups with high-frequency CHL (left column, A1-3), large CHL (middle column, B1-3), and other CHL (right column, C1-3). Dashed lines represent patients previously categorized as surgical partial discontinuity; solid lines represent patients previously categorized as surgical complete discontinuity.
Figure 2.
Columns A, B, & C show air-bone gap, umbo velocity, and power reflectance results for individual patients grouped by CHL patterns. In these columns, dashed lines represent patients categorized as surgical partial discontinuity per the criteria detailed under “Methods”; solid lines represent patients categorized as surgical complete discontinuity. The gray shaded areas on the umbo velocity and power reflectance graphs represent normative data +/− one standard deviation around the normal mean.
The first row of Figure 2 plots ABGs. 8 patients were categorized as high-frequency CHL (generally down-sloping curves, A1), 7 of these (87.5%) were also designated as surgical partial discontinuity and 1 (12.5%) as surgical complete discontinuity based on operative reports. In contrast, of the 25 patients categorized as large CHL, 16 (64.0%) were designated as surgical complete discontinuity, with the majority of these patients exhibiting greater ABGs in the lower frequencies (mostly up-sloping curves, B1). Of the 33 patients that did not fit the criteria for either high-frequency CHL or large CHL, categorized as other CHL (mostly flat curves, C1), 24 (72.7%) were designated as surgical partial and 9 (27.3%) as surgical complete patients.
The 2nd row of Figure 2 shows individual UV data for patients with (A2) high-frequency, (B2) large, and (C2) other CHL, respectively. Similar to previous results (Rosowski et al. 2008), 21 of the 29 patients showed an increase in UV magnitude of more than one standard deviation from the normal mean at frequencies below 1 kHz, including 4 of 5 high-frequency CHL cases, 11 of 13 large CHL cases and 6 of 11 other CHL cases.
The 3rd row of Figure 2 shows individual PR data for patients with (A3) high-frequency, (B3) large, and (C3) other CHL. All high-frequency (2 ears) and large (4 ears) CHL patients exhibit a well-defined notch in PR between 500 and 800 Hz. However, 4 of the 6 in the other CHL group do not exhibit a notch between 500 and 800 Hz, and the remaining 2 other CHL patients exhibit only a poorly defined notch. In total, 8 of the 12 patients (75%) exhibit a notch in the 500 to 800 Hz range. This notch is consistent with previous results and is likely indicative of ossicular discontinuity (Feeney et al. 2003, Nakajima et al. 2012).
Mean Results
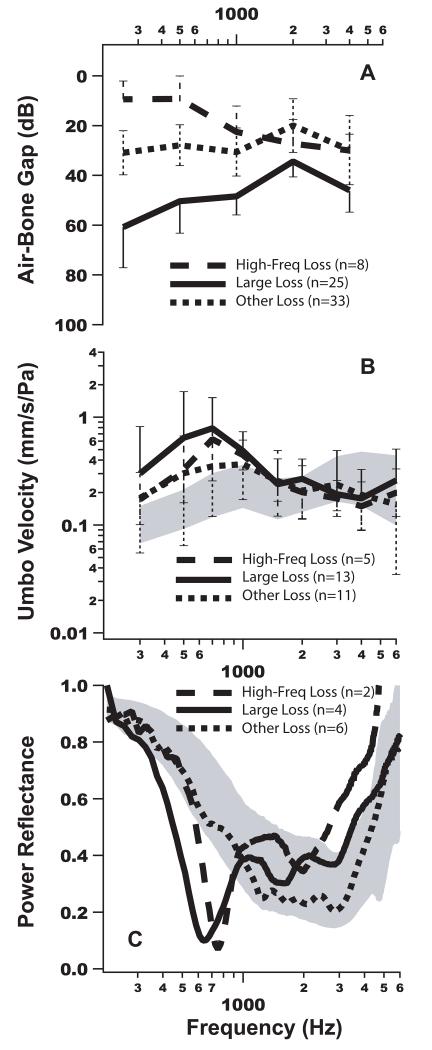
Figure 3 shows the means of the individual data shown previously in Figure 2. Figure 3A shows mean ABG results +/− one standard deviation for each CHL group. The mean ABG trends for each group are a direct result of the criteria defining each group, with the high-frequency CHL group showing a down-sloping loss, the large CHL group showing a 40 to 60 dB up-sloping loss, and the other CHL group, in between, with a flat loss. Figure 3B plots the mean mechanical measurement, UV, +/− one standard deviation for each group. The mean UV of the large CHL group exceeds the mean UV of the high-frequency CHL group at all frequencies below 1 kHz; however, there is no statistically significant difference between the two means at any frequency based on t-test calculations. Figure 3C plots the mean PR results. While the interpretative utility of t-test calculations is limited due to the small number of patients with PR measurements, there is no statistically significant difference in PR results at any frequency between the high-frequency and large CHL groups, and both groups exhibit similarly shaped notches. The mean PR of the other CHL group falls within normal range and does not exhibit a notch, despite the fact that ABGs for this group fall between those of the high-frequency and large CHL groups.
Figure 3.
Mean air-bone gap, umbo velocity, and power reflectance results by group based on CHL patterns. The bars on graphs A and B represent +/− one standard deviation from the mean. The gray shaded areas on the umbo velocity (B) and power reflectance (C) graphs represent normative data +/− one standard deviation around the normal mean. In C, standard deviations are not plotted for PR because the sample sizes are small (the individual curves are shown in Figure 5).
Experimental Results
Stapes Velocity
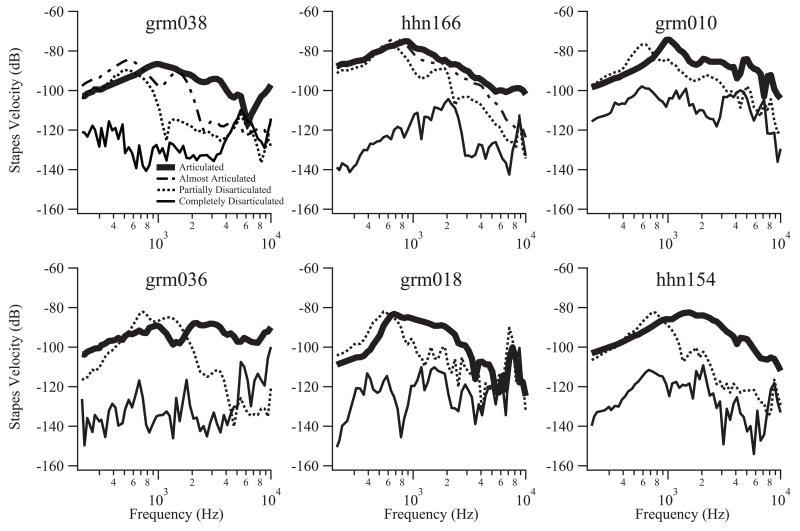
Figure 4 shows stapes velocity results for 6 cadaveric temporal bone preparations with the ossicular chain in articulated, partially disarticulated, and completely disarticulated states. Grm038 and hhn166 additionally show stapes velocity with the ossicular chain in different degrees of partial disarticulation. This almost articulated state was achieved by adding additional Jeltrate to the partially disarticulated state in order to create a stronger connection providing a higher degree of sound transmission. In the partially disarticulated state, all 6 specimens exhibit a drop in stapes velocity from the articulated state at frequencies above some cut-off (800Hz – 2kHz, varying across ears), while in a completely disarticulated state the specimens exhibit decreases in SV that are larger in magnitude and more consistent across frequencies. The decreases in SV due to complete disarticulation may be larger than measured, particularly at the lower frequencies, because we are limited by the noise of the laser measurement device. Grm038 and hhn166, which include SV measurements in different degrees of partial disarticulation, indicate that the degree of disarticulation correlates to a graded response in SV, with looser connections resulting in more loss that not only affects the highest frequencies, but wider frequencies towards the lower frequencies.
Figure 4.
Stapes velocity results for 6 temporal bone preparations. All 6 show stapes velocity with the ossicular chain in a partially disarticulated state (dotted line), completely disarticulated state (thin solid line), and articulated state (thick solid line). Grm038 and hhn166 additionally show stapes velocity in an almost articulated state (dashed line), in which more Jeltrate was added to the partial state to create a stiffer connection.
Umbo Velocity
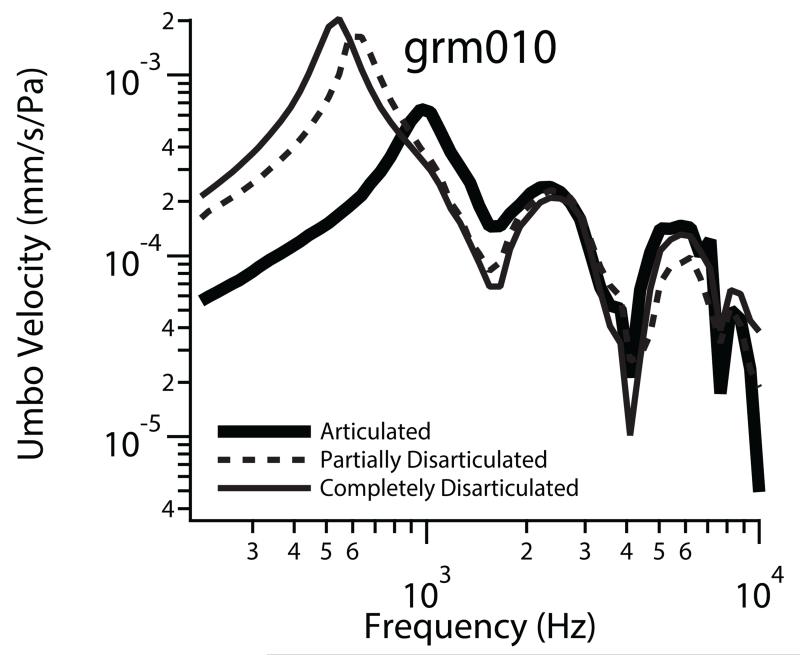
Laser vibrometry to measure UV was performed on 1 temporal bone (grm 010), as shown in Figure 5. UV in the completely disarticulated and partially disarticulated states exceed the normative data at all frequencies, consistent with more compliant systems. Moreover, the completely disarticulated state (most compliant), exhibits the highest UV at frequencies below 700 Hz, though this difference between complete and partial is small and likely not clinically significant. The great similarity of UV in the partial and completely disarticulated states is in contrast with the differences observed in SV under those conditions. Clearly, the change in UV is not proportional to the change in SV.
Figure 5.
Umbo velocity results for grm010 in the completely disarticulated (thin solid line), partially disarticulated (dashedline), and articulated (thick solid line) states.
Power Reflectance (PR)
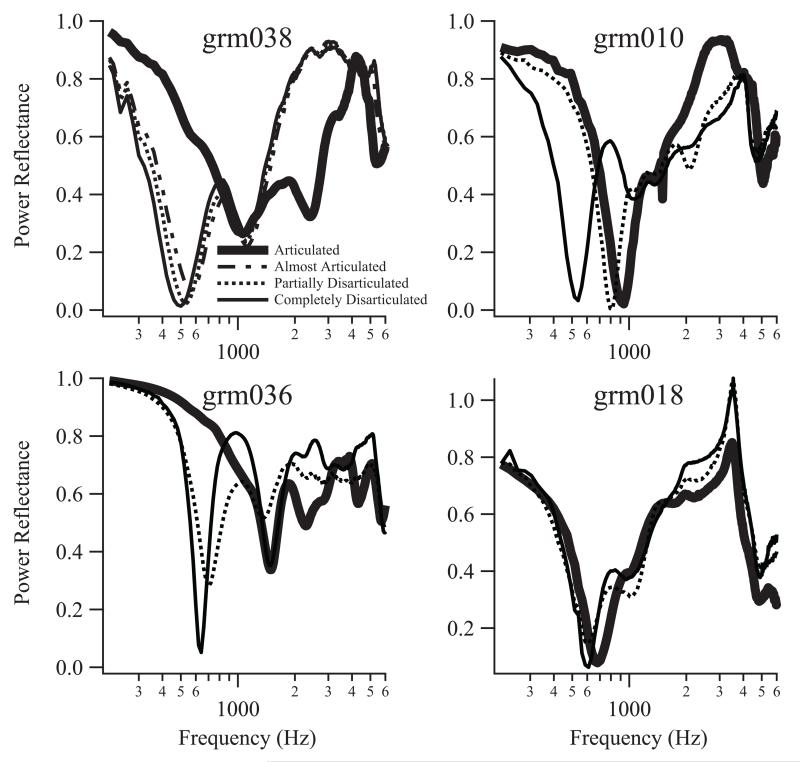
As shown in Figure 6, PR was performed on 4 of the 6 temporal bones (grm038, grm010, grm036, and grm018) for each preparation in a partially disarticulated, completely disarticulated, and articulated state. Grm038 additionally includes results for the ossicular chain in different degrees of partial disarticulation, as described above. Regardless of the degree of disarticulation, all PR results exhibit deep notches between 500 and 800 Hz. There do not appear to be substantial differences or trends between the almost articulated, partially disarticulated, and completely disarticulated states. The relative insensitivity of PR to the degree of interruption is similar to UV, and indicates that the effect of interruption is fundamentally different at the TM (where we measure UV and PR) and the stapes. In grm018, a notch at 700 Hz exists in the articulated state, and disarticulation results in a slight frequency shift of the notch to 600 Hz.
Figure 6.
Power reflectance results for four temporal bone preparations. All preparations include the articulated state (thick solid), the partially articulated state (dotted) and the completely disarticulated state (thin solid). One preparation, grm038, includes an almost articulated state (dashed)
DISCUSSION
This study explores the effects of partial and complete discontinuity on audiometric and mechanical measurements in both patients and temporal bone preparations. The hypothesis that partial ossicular discontinuity (where soft tissue connects separated ossicles) can transmit low but not high frequency sound is tested.
When patients were categorized as surgical partial or surgical complete based on retrospective review of operative reports, the hypothesized relationship between high-frequency CHL and partial OD did not materialize – the averaged ABG for the surgical partial discontinuity group was flat and hovered near 30 dB across frequencies. This is likely a result of criteria we used to define surgical partial. It is probable that the soft tissue mentioned in the surgical reports of many of the discontinuities consequently categorized as partial did not actually create a mechanical connection for the transmission of sound; therefore, these discontinuities were mechanically complete. For example, a thin, long mucosal fold may not transmit sound as well as a thick, short fibrous band. Experimental stapes velocity measured on temporal bones support this theory. Furthermore, determining whether a disarticulation is complete or partial can be challenging even under direct visualization during surgery and not all surgeons report details regarding the presence of tissue between bony discontinuities. From a surgeons stand point, sometimes there may be thin mucosal connection between ossicles (partial OD) but the surgeon may report as complete, ignoring the possible transmission through the mucosa.
By separating patients based on air-bone gap patterns, however, we do find support for the hypothesized correlation between high-frequency loss and partial OD. Even with our surgical criteria as it was and inconsistency among surgeons on their reporting, 7 out of 8 (87.5%) patients in the high-frequency CHL group were also categorized as surgical partial discontinuity. Whereas only 9 out of 25 (36%) of patients in the large CHL group were categorized as surgical partial discontinuity, and these may have had very compliant tissue, such as thin mucosal folds, that did not allow for low frequency sound transmission, as compared to stiffer tissue between disconnected ossicles.
Our controlled temporal bone experiments provide the strongest evidence to support the hypothesis; they consistently show well-defined high frequency losses resulting from the partially disarticulated state, different from the large losses across frequencies resulting from the completely disarticulated state. Varying degrees of partial discontinuity showed that the stiffer connection between the ossicles resulted in only the highest frequency losses, while the softer connection resulted in wider frequency loss from high frequencies encroaching towards the mid frequencies.
Partial and complete discontinuity types do not appear to have significantly differing effects on the non-invasive mechanical measurements explored in this work. Of the 29 patients with UV data, 21 exhibit larger than normal UV at frequencies below 1 kHz, with no statistically significant difference between the means of the surgical complete and partial discontinuity groups or the means of the high-frequency and large CHL groups. In addition, 8 of the 12 patients with PR data exhibit a distinctive notch in the 500 to 800 Hz range, regardless of the level of discontinuity. The patients without a notch all fell into the other CHL group. Why these PR measurements appear more normal than the others is unclear, and could be the result of more complicated pathology or unknown variables confounding the measurement (such as stiffer than normal TMs or the existence of static pressure in the middle ear cavity at the time of measurement), despite attempts to control for such variables. We do not see any of these “non-notchy” patterns in our well-controlled temporal bone preparations. Because a large proportion of ears in the other CHL group did not have a distinct PR notch or an increase in UV, it appears that these measurements are limited in their ability to rule out the diagnosis of OD. Though small in sample size, the UV usually showed increase in velocity and PR showed notches in the high-frequency CHL and large CHL groups.
Tympanic membranes with hypermobility and tympanosclorosis can also exhibit a notch in PR. Two examples of PR from hypermobile TMs were shown in Rosowski et al. (2013) exhibiting narrow-band notches at 400-500 Hz, similar to the notches in OD. Feeney et al. (2003) also showed two examples of hypermobile TMs exhibiting notches at 0.8-1 kHz, which is higher in frequency and wider in shape than typical notches we measured in OD. The discrepancy between Rosowski et al. (2013) and Feeney et al. (2003) might be due to differences in the devices used to measure wideband immittance. Similarly, tympanosclerosis can result in notches, but the three examples shown in Rosowski et al. (2013) included one without a significant notch, one with a shallow notch at 1 kHz and another with a wide notch around 2 kHz. From the limited PR data on adult ears with hypermobility and tympanosclerosis, it appears that hypermobility can exhibit similar PR notches to OD, but the notches due to tympanosclerosis are different in shape and frequency. It appears that diagnosing OD with PR can be complicated by lesions at the TM.
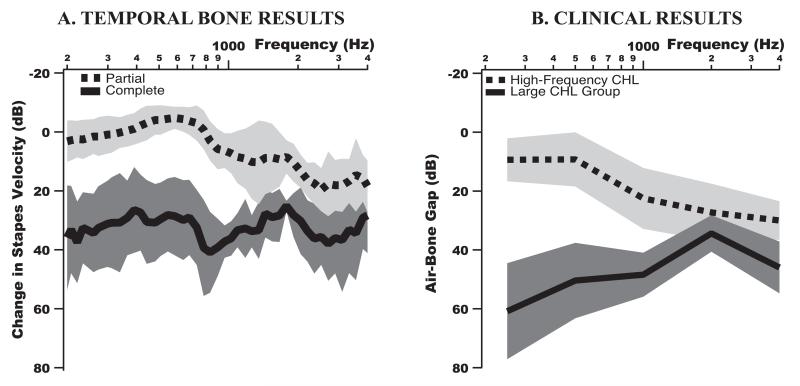
Comparison of temporal bone results and clinical results: Figure 7A shows the mean change in the experimental SV due to disarticulation with respect to the articulated ossicular chain, the magnitude of which is comparable to the clinical ABG of Figure 7B. The trend in mean SV change due to partial discontinuity is strikingly similar to the trend in mean ABG for the high-frequency CHL group; both showing high frequency loss. However, the ABG at mid-to-high frequencies is slightly larger than the decrease in SV, possibly because the connections between the ossicles in the experiments were generally not as compliant as in the patients. Likewise, the mean SV change due to complete discontinuity is similar to the mean ABG for the large CHL group across frequencies, with larger losses across frequencies. Stapes velocity change due to complete disarticulation may be larger than measured, particularly at the lower frequencies, because we are limited by the noise of the laser measurement device. In both experimental and clinical data, there is more separation between the groups representing partial and complete OD at the low frequencies and the means trend toward each other as frequency increases. This further supports the hypothesis that partial OD can result in high-frequency CHL.
Figure 7.
(A) Change in stapes velocity with respect to the articulated (connected) middle-ear chain. The dashed line is the mean change due to partial disarticulation and the solid line is the mean change due to complete disarticulation in the temporal bone. Shaded regions represent +/− one standard deviation from the mean. (B) Mean ABG for high-frequency CHL and large CHL groups defined in the Methods section from patients. Shaded regions represent +/− one standard deviation from the mean.
The frequency-dependent changes in ossicular mechanical motion observed are due to the effect of stiffness between the ossicles. With complete disarticulation, all frequencies are affected as motion from the malleus is no longer transmitted to the stapes. However, with partial discontinuity, there is a frequency-dependent effect that depends on the stiffness of the ossicular chain. With stiff tissue connecting the ossicles (e.g. thick short fibrous tissue), sound pressure is transmitted via the connecting tissue with motion of the first ossicle coupled to the next at low frequencies. But at high frequencies, the connecting tissue cannot couple ossicular motion: the second ossicle moves less than the first (as the connecting tissue does not allow adequate force to be transmitted to the second ossicle to accelerate its mass), and decreased sound transmission occurs. With compliant tissue connecting ossicles (e.g. thin long fibrous tissue or mucosal folds), reduction in motion of the second ossicle occurs at lower frequencies. This is consistent with the SV experimental data with different states of partial discontinuity. These mechanical mechanisms are consistent with clinical and experimental results, allowing for better diagnosis by considering frequency-dependent conductive hearing loss.
CONCLUSIONS
In the presence of an intact TM and aerated middle ear, high-frequency CHL appears to indicate partial OD rather than complete. 7 of the 8 patients with high-frequency CHL were categorized as surgical partial discontinuity. However, high-frequency CHL captured 1 surgical complete patient and failed to capture 33 surgical partial patients. Based on these results, high-frequency CHL as an indicator of surgical partial discontinuity (rather than complete) has a high specificity (96%) but low sensitivity (18%). These calculations are likely influenced by the criteria used to categorize patients based on operative notes. Nevertheless, the high specificity provides confidence that when a patient has a high-frequency CHL, partial discontinuity is very likely. As can be seen in Figure 7, experimental simulations of partial and complete discontinuities results in stapes velocity that strongly corroborate this conclusion.
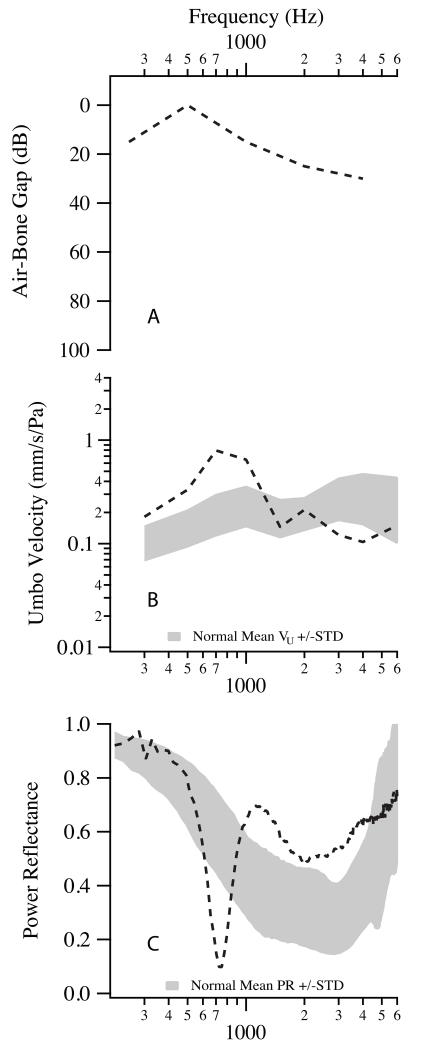
While partial and complete OD exhibit different trends in ABGs, we were unable to identify statistically significant differences in mechanical measurements made in the ear canal, such as UV and PR. Likewise, minor mechanical differences in UV and PR displayed at the ear canal by the temporal bone preparations in the partially and completely disarticulated states were quite small and thus clinically insignificant. Experimental SV measurements however did show differences between partial and complete, similar to the clinical ABG. Still, combining audiometric information with PR and/or UV measurements, which are sensitive to discontinuity irrespective of the level of disarticulation, may provide confirmation of a suspected partial OD in a patient with high-frequency CHL. Indeed, Figure 8 shows ABG (8A), UV (8B), and PR (8C) data for an individual patient who was accurately diagnosed with partial OD prior to middle ear surgery. His otologist (a physician involved in a MEEI study assessing the diagnostic utility of UV and PR measurements) made this diagnosis based on the patient’s: 1) high-frequency CHL, 2) UV in excess of one standard deviation of the normal mean at frequencies below 1 kHz, and 3) notch in PR around 700 Hz. As was demonstrated in Nakajima et al. (2012, 2013), UV and PR can diagnose ossicular discontinuity by differentiating from other etiologies that can result in CHL. The level of discontinuity can be differentiated by the audiogram because a high-frequency ABG would likely be due to a partial discontinuity.
Figure 8.
A, B, & C show air-bone gap, umbo velocity, and power reflectance results, respectively, for an individual patient diagnosed with partial OD prior to surgery based on the data.
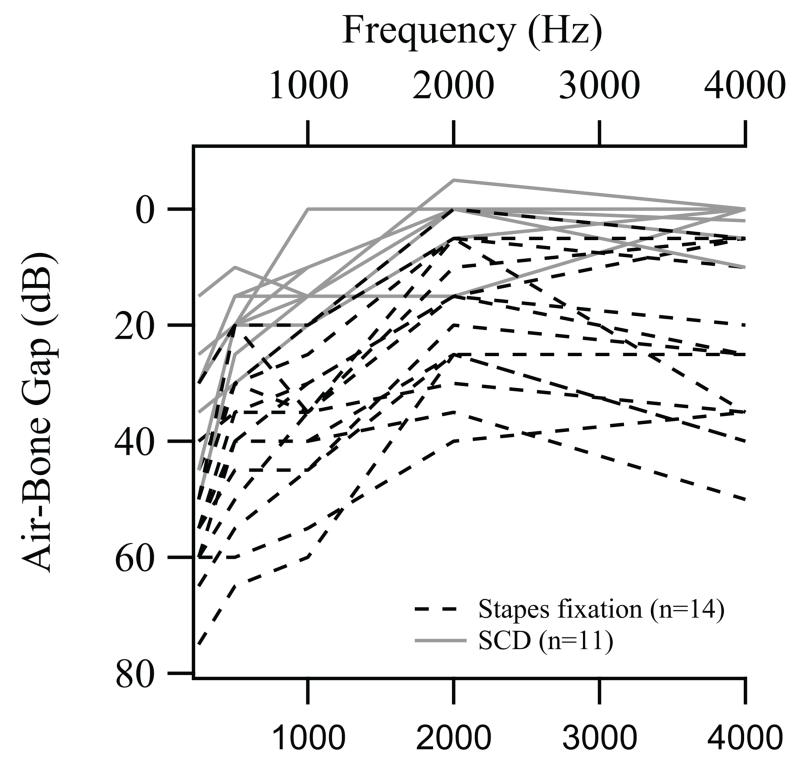
When UV and PR data is unavailable, the presence of high-frequency CHL alone may differentiate partial OD from ear diseases with similar symptoms. Figure 9 shows ABG data for 14 ears with stapes fixation and 11 ears with superior canal dehiscence (SCD) used in Nakajima et al. 2012. None of these ears exhibit high-frequency CHL (more ABG at high than low frequencies). Based on this data and our criteria for surgical partial and complete OD, high-frequency CHL as an indicator of partial OD (rather than complete OD, stapes fixation, and SCD) is highly specific (98%).
Figure 9.
ABGs for 14 ears with stapes fixation (dashed black line) and 11 ears with SCD (solid gray line), modified from Nakajima et al. 2012.
This study demonstrates that when a patient exhibits high-frequency CHL: 1) it is important not to assume that the measurement is flawed; 2) it may be used to differentiate partial ossicular discontinuity from complete ossicular discontinuity with strong certainty in the setting of an intact TM and an aerated middle ear; 3) it may also be used to help differentiate partial ossicular discontinuity from other ear conditions causing CHL.
ACKNOWLEDGEMENTS
This study is dedicated to Saumil N. Merchant who originally inspired this study. We thank Michael E. Ravicz and Melissa McKinnon for their contributions. Support was provided by the Nachwuchsförderungskredit of the University of Zurich (CR), TUBITAK (CHU), and the NIH/NIDCD – R01DC004798 (JJR) and R03DC011158 (HHN).
Conflicts of Interests and Sources of Funding:
This research is supported by the NIH/NIDCD R01DC004798. CR was supported by Nachwuchsförderungskredit of the University of Zurich, and CHU was supported by TUBITAK (2011 - 1059B191100156).
Abbreviations
- ABG
air-bone gap
- CHL
conductive hearing loss
- OD
ossicular discontinuity
- PR
power reflectance
- TM
tympanic membrane
- UV
umbo velocity
- SV
stapes velocity
REFERENCES
- Anderson H, Barr B. Conductive high-tone hearing loss. Arch Otolaryngol. 1971;93:599–605. doi: 10.1001/archotol.1971.00770060901010. [DOI] [PubMed] [Google Scholar]
- Chien W, McKenna MJ, Rosowski JJ, et al. Isolated fracture of the manubrium of the malleus. J Laryngol Otol. 2008;122:898–904. doi: 10.1017/S0022215107000990. [DOI] [PMC free article] [PubMed] [Google Scholar]
- Feeney M, Grant I, Maryott I. Wideband energy reflectance in adults with middle-ear disorders. J Speech Lang Hear Res. 2003;43:901–911. doi: 10.1044/1092-4388(2003/070). [DOI] [PubMed] [Google Scholar]
- Feeney MP, Grant IL, Mills DM. Wideband energy reflectance measurements of ossicular chain discontinuity and repair in human temporal bone. Ear Hear. 2009;30:391–400. doi: 10.1097/AUD.0b013e3181a283ed. [DOI] [PubMed] [Google Scholar]
- Mahoney CF, Luxon LM. Misdiagnosis of hearing loss due to ear canal collapse: a report of two cases. J Laryngol Otol. 1996;110:561–566. doi: 10.1017/s0022215100134279. [DOI] [PubMed] [Google Scholar]
- Margolis RH, Eikelboom RH, Johnson C, et al. False Air-Bone Gaps at 4 kHz in listeners with normal hearing and sensorineural hearing loss. Int J Audiology. 2013;52:526–532. doi: 10.3109/14992027.2013.792437. [DOI] [PubMed] [Google Scholar]
- Marshall L, Martinez SA, Schlaman ME. Reassessment of high-frequency air-bone gaps in older adults. Arch Otolaryngol. 1983;109:601–606. doi: 10.1001/archotol.1983.00800230037009. [DOI] [PubMed] [Google Scholar]
- Merchant SN, Nadol JB. Schuknecht’s pathology of the ear. 3rd ed. People’s Medical Publishing House; Shelton, CT: 2010. [Google Scholar]
- Mustain WD, Hasseltine HE. High frequency conductive hearing loss: a case presentation. Laryngoscope. 1981;91:599–604. doi: 10.1288/00005537-198104000-00013. [DOI] [PubMed] [Google Scholar]
- Nakajima HH, Ravicz ME, Merchant SN, Peake WT, Rosowski JJ. Experimental ossicular fixations and the middle ear’s response to sound: Evidence for a flexible ossicular chain. Hearing Research. 2005;204:60–77. doi: 10.1016/j.heares.2005.01.002. [DOI] [PubMed] [Google Scholar]
- Nakajima HH, Pisano DV, Roosli C, et al. Comparison of ear-canal reflectance and umbo velocity in patients with conductive hearing loss: a preliminary study. Ear Hear. 2012;33:35–43. doi: 10.1097/AUD.0b013e31822ccba0. [DOI] [PMC free article] [PubMed] [Google Scholar]
- Rosowski JJ, Nakajima HH, Merchant SN. Clinical utility of laser-Doppler vibrometer measurements in live normal and pathologic human ears. Ear Hear. 2008;29:3–19. doi: 10.1097/AUD.0b013e31815d63a5. [DOI] [PMC free article] [PubMed] [Google Scholar]
- Rosowski JJ, Nakajima HH, Hamade MA, et al. Ear canal reflectance, umbo velocity and tympanometry in normal hearing adults. Ear Hear. 2012;33:19–34. doi: 10.1097/AUD.0b013e31822ccb76. [DOI] [PMC free article] [PubMed] [Google Scholar]
- Sim JH, Huber AM, Häfliger M, et al. Can an incomplete ossicular discontinuity be predicted by audiometric and clinical findings? Otol Neurotol. 2013;34:699–704. doi: 10.1097/MAO.0b013e31828864a7. [DOI] [PubMed] [Google Scholar]


