Abstract
Background
Accurate measurement of esophageal hiatus size is clinically important, especially when antireflux surgery is planned. We present a novel method for in vivo measurement of esophageal hiatal surface area using MDCT multiplanar reconstruction. We aimed to determine if large hiatal area is associated with hiatal hernia and gastroesophageal reflux disease.
Methods
We retrospectively analyzed subjects prospectively enrolled in the COPDGene® project. We created two test groups, one with hiatal hernia on chest CT, and one with GERD on medical treatment identified by history without hernia. Matched control groups were formed. We performed CT post-processing to define the double oblique plane of the esophageal hiatus, on which the hiatal surface area is manually traced.
Results
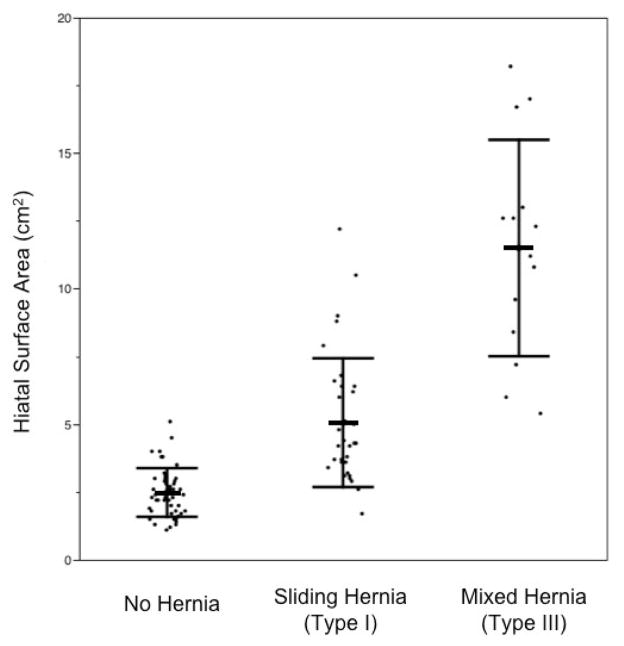
48 subjects with hernia had larger mean hiatus areas than matched controls (6.9 cm2 vs. 2.5 cm2, p<0.0001), and were more likely to have GERD (42% vs. 10%, p<0.0005). Subjects with mixed (type III) hernias had larger hiatuses compared to subjects with sliding (type I) hernias, who, in turn, had larger hiatuses than subjects without hernia (p<0.0001). 55 hernia-negative subjects with GERD did not have significantly larger mean hiatal areas compared to matched controls (3.0 cm2 vs. 2.5 cm2, p=0.12). 20 measurements obtained by two radiologists showed correlation of 0.93, with mean difference of 0.5 cm2 (p=0.20).
Conclusions
We devised a method to measure in vivo esophageal hiatal surface area using MDCT reconstruction and established the normal size range for the first time. This methodology has the potential to guide decision-making in antireflux surgery technique pre-operatively, and assess surgical result post-operatively. Presence of hernia correlated with large hiatuses and GERD. However, hiatal area failed to identify those with GERD in the absence of hiatal hernia.
Keywords: Hiatal hernia, hiatal surface area, gastroesophageal reflux disease, multidetector computed tomography, esophageal hiatus, diaphragm
Introduction
The esophageal hiatus is an elongated and obliquely oriented opening in the diaphragm through which the thoracic esophagus passes into the abdomen. The margins of the hiatus are contiguous with the diaphragmatic crura, with some variability between individuals [1–3]. The esophageal hiatus has a sphincter mechanism independent of lower esophageal sphincter contraction [4]. Its failure is thought to be one of many factors in the pathogenesis of gastroesophageal reflux disease (GERD) and hiatal hernia (HH) [5–6].
There is recent interest in accurate measurement of the esophageal hiatus since its pathologic enlargement carries clinical implications. In patients with GERD undergoing fundoplication, a large hiatus area correlated with diminished LES pressure and increased acid reflux [7–8]. Knowledge of hiatus size is also important in antireflux surgery. A large pre-operative hiatus is associated with increased rate of surgical failure, and some surgeons advocate selecting hiatal closure technique based on hiatus size [9–12]. The relationship between hiatal widening and HH is complex. One study showed poor correlation between intra-operatively measured hiatus area and size of HH seen on pre-operative barium esophagram [13].
To our knowledge, cross-sectional imaging with multiplanar reconstruction (MPR) to obtain hiatal surface area (HSA) has not been reported. Previous studies have approximated HSA using the geometric assumption that the hiatus is shaped like a slice of a circle whose area can be calculated after obtaining the radius and angle, a method first described by Granderath et al. in 2007. [8–11, 13–15]. Others have estimated HSA by tracing the region of interest on an intra-operative image with a graphic software [7]. Additionally, since all measurements to date were performed intra-operatively from individuals requiring surgical treatment of GERD, or obtained post-mortem, the physiologic size of the esophageal hiatus in asymptomatic individuals is not known.
In this study, we aimed to introduce a method for measuring the esophageal HSA in vivo from routine multidetector computed tomography (MDCT) images using MPR technique. We also aimed to investigate whether hiatus size is a good predictor for the presence of HH or GERD. We suspect that CT-derived measurement of the esophageal HSA has clinical relevance in patients undergoing medical or surgical treatment for GERD and HH.
Materials and Methods
Study Setting
We performed retrospective analysis of data in the COPDGene® database, a multicenter prospective observational study involving 21 academic centers in the US comprised of 10,300 subjects. The complete COPDGene® study protocol has been published [16]. Only the 1,190 subjects recruited from our institution were considered in this study. Subjects are 45 to 80 years old, and African-American or non-Hispanic white. Current and former smokers with and without COPD were included. Demographic data, medical history, and lifestyle information were obtained via questionnaires. The COPDGene® database governing body and our institutional review board approved this study. All participants provided written informed consent at the time of enrollment.
Imaging Parameters
As part of the COPDGene® protocol, all subjects in our study cohort underwent unenhanced MDCT of the thorax at the time of enrollment. CT scans were acquired in spiral mode using multi-detector scanners (Siemens, Sensation-16 and Sensation-64, Malvern, PA, USA). Volumetric acquisitions were obtained with breath held on deep inspiration (total lung capacity [TLC]) and at the end of tidal expiration (functional residual capacity [FRC]). The exposure factors were effective mAs of 200 for inspiration, 50 mAs for expiration, and 120 kVp for both. Images were reconstructed in the axial plane at 0.75 mm slice thickness, with 0.5 mm interval, using both soft tissue (B31f) and high spatial frequency (B46f) algorithms. The complete imaging COPDGene® protocol has been published [16]. Inspiratory images in soft tissue algorithm were reviewed for this study.
Sample Selection
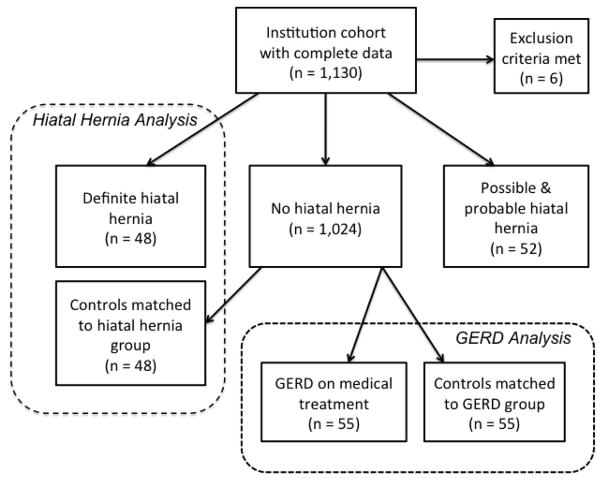
Subjects with incomplete clinical or demographic information, or missing or incomplete CT scans were excluded. Subjects with CT evidence of prior surgery involving the esophagogastric junction were excluded, including gastric bypass, esophagectomy with gastric pull through, and possible HH repair. Two study groups were constructed, a HH group and a GERD group, as defined below, each with its own control group matched by demographics using propensity scoring. A flow diagram showing the sample selection process is shown in Figure 1.
Figure 1.
Flow diagram showing subject selection process.
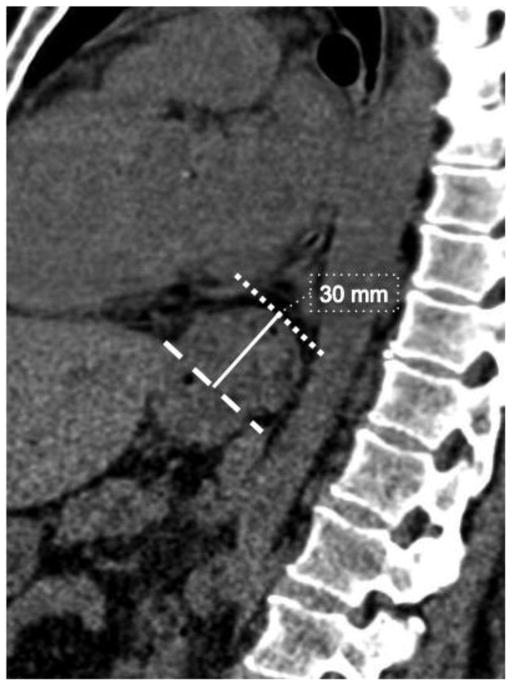
All CTs were reviewed for the presence of HH. Because conventionally, HH is identified on CT subjectively without quantitative definition, we devised a grading system to categorize subjects as no hernia, possible hernia, probable hernia, or definite hernia. External surrogate markers for the esophagogastric junction, such as the angle of His and abrupt change in the tubular contour, were used to determine its location with respect to the diaphragm, since mucosal detail is not available in the CT images. Visualization of the angle of His below the level of the diaphragm excluded HH. The presence of HH was determined by identifying the markers of esophagogastric junction superior to the diaphragm. HH was considered definitely present if the contour abnormality was greater than 2 cm above the level of the esophageal hiatus (Fig. 2). Abnormalities with length between 1 and 2 cm were considered probable, and those with length between 0 and 1 cm were considered possible. Subjects with definite HH on CT comprised the HH group. The hernias were then classified by type using recognized scheme, where type I is sliding hernia, type II is paraesophageal hernia, type III is mixed type with features of both type I and type II, and type IV involves herniation of additional viscera [17].
Figure 2.
Sagittal image of 56 year-old female with hiatal hernia, showing length of the hernia, measured from a line indicating the level of the esophageal hiatus (dashed line), to the superior aspect of the contour change (dotted line).
We considered subjects who reported having heartburn or acid reflux on a standardized questionnaire to be positive for GERD. Medication lists of these subjects were then reviewed for medication typically used to treat GERD, including proton pump inhibitors and H2 receptor antagonists. Subjects who reported having GERD and were undergoing medical treatment for GERD formed the GERD group. Those with definite or probable HH were excluded from this sample. Those who denied having GERD but were on GERD-related medication, and those reporting GERD symptoms but were not treated with medication were also excluded.
Demographically matched control samples were constructed for both the HH group and the GERD group using propensity scores incorporating age, gender, BMI, and FEV1. Control subjects for the HH group did not have HH. Control subjects for the GERD group did not have HH, reported no GERD symptoms, and denied taking GERD-related medications.
CT Analysis
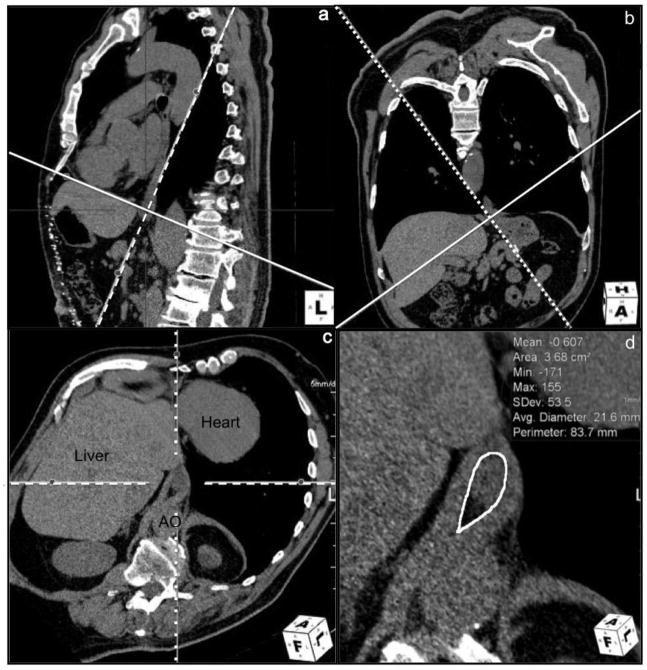
We performed CT post-processing and analysis with Aquarius iNtuition version 4.4.7 (TeraRecon, San Mateo, CA) to obtain HSA. Axial images of 0.75 mm thickness in soft tissue algorithm (B30f) were loaded into a standard multiplanar reformat package, showing images in three orthogonal planes (axial, coronal, and sagittal by default). From here, a double oblique corrected plane demonstrating the entire circumference of the esophageal hiatus was obtained using the following steps. First, in the sagittal plane, an image through the esophageal hiatus was identified. On this image, the line representing the axial plane was moved and rotated such that it intersects the anterior and posterior margins of the esophageal hiatus. This line typically inclined downward towards the spine (Fig. 3a). This positions the line representing the oblique coronal plane approximately parallel to the distal esophagus. The oblique coronal stack was then paged through to show the right and left margins of the hiatus. On this oblique coronal image, the line representing the oblique axial plane was positioned and rotated such that it intersects the right and left margins of the esophageal hiatus. This line typically inclined downward to the right (Fig. 3b). The resulting doubly oblique axial plane is the plane of the esophageal hiatus (Fig. 3c). Smaller adjustments in angle and position were performed to maximally demonstrate the margins of the hiatus. At times, multiple slices demonstrated the entire circumference of the hiatus. A representative image most amenable for measurements was used. The area of the esophageal hiatus was then measured, using the polygon tool to manually define the inner margin of the hiatus using the fat-crural interface (Fig. 3d). When there is a paucity of fat in the hiatus, the esophagus-crural interface was used. Uncommonly, the crural bundle separating the esophageal and aortic hiatuses was poorly visualized; in which case, the anterior margin of the aorta was used to complete the circumference of the esophageal hiatus.
Figure 3.
Images from multiplanar reformat software workspace showing sequential steps taken to define the plane of the esophageal hiatus for measurement of HSA. 3a: Sagittal image with the solid line representing the oblique axial plane positioned to intersect the anterior and posterior margins of the esophageal hiatus. 3b: Oblique coronal image with the solid line representing the oblique axial plane positioned to intersect the right and left margins of the esophageal hiatus. 3c: The resulting double obliqued axial plane demonstrating the hiatus plane. AO = aorta. 3d: Magnified view of the esophageal hiatus showing area measurement.
One radiologist (WO) performed all CT post-processing and measurements. Subsequently, a second radiologist (CD) blinded to the results independently analyzed a representative subset of 20 CTs for assessment of inter-rater agreement. HSA measurements and post-processed imaging planes were compared.
Statistical Analysis
Data analysis was performed using JMP Pro Version 10.0.2 (SAS Institute Inc., Cary, NC). Where appropriate, Student’s t test, Pearson’s chi-squared test, and Wilcoxon signed-rank test were used. We considered p values less than 0.05 to be significant. Data is presented as mean and standard deviation (SD).
Results
Hiatal Hernia Group
There were 1,130 subjects with available demographic and CT information. CT screening revealed that 54 (4.8%) had definite hernias, 45 (4.0%) had probable hernias, and 7 (0.6%) had possible hernias. After excluding 4 with imaging evidence of surgery in the region of the esophagogastric junction and 2 with incomplete CT images, the remaining 48 patients with definite HH formed the HH group. Of these, 34 had type I (sliding) hernias, and 14 had type III (mixed) hernias. A corresponding control group of 48 subjects without hernia was identified using propensity scoring to control for gender, BMI, age, and FEV1. Respectively, the HH group and its corresponding control group had 50% and 54% males (p=0.68), mean BMI of 30 and 30 (p=0.66), mean age of 61 and 61 (p=0.89), and mean FEV1/FVC of 0.61 and 0.60 (p=0.86).
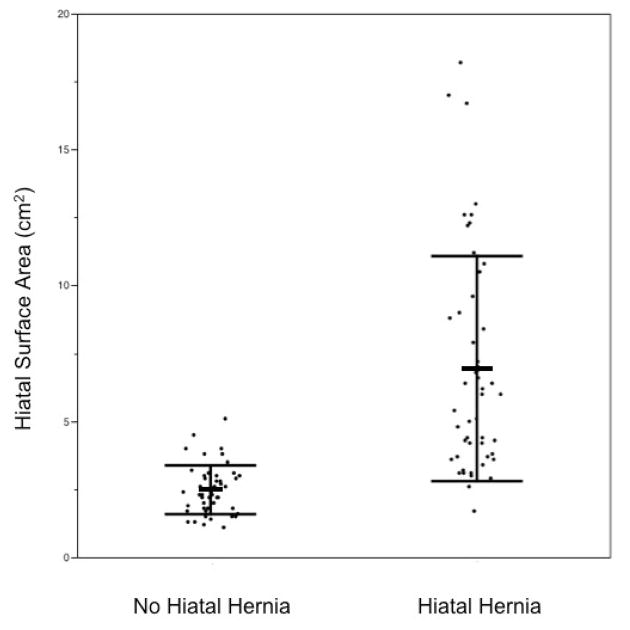
Those with HH had significantly larger hiatuses than those without (p<0.0001). Mean HSA of HH subjects was 6.9 cm2 (SD 4.1). Mean HSA of their matched control subjects was 2.5 cm2 (SD 0.9). (Fig. 4).
Figure 4.
Distribution of HSA in subjects without and with HH, with bars showing mean and SD.
Mean HSA of those with type I (sliding) hernias was 5.1 cm2 (SD 2.4), and mean HSA of those with type III (mixed) hernia was significantly larger (p<0.0001), at 11.5 cm2 (SD 4.0). Mean HSA in type I hernias was also larger than mean HSA of those without hernia (p<0.0001) (Fig. 5).
Figure 5.
Distribution of HSA in subjects with no hernia, sliding hernia, and mixed type hernia. The bars indicate mean and SD.
42% of subjects with HH had GERD, compared to 10% of subjects without HH (p =0.0005). Among those with HH, 35% of those with type I HH had GERD, while 57% of subjects with type III HH had GERD (p=0.0007).
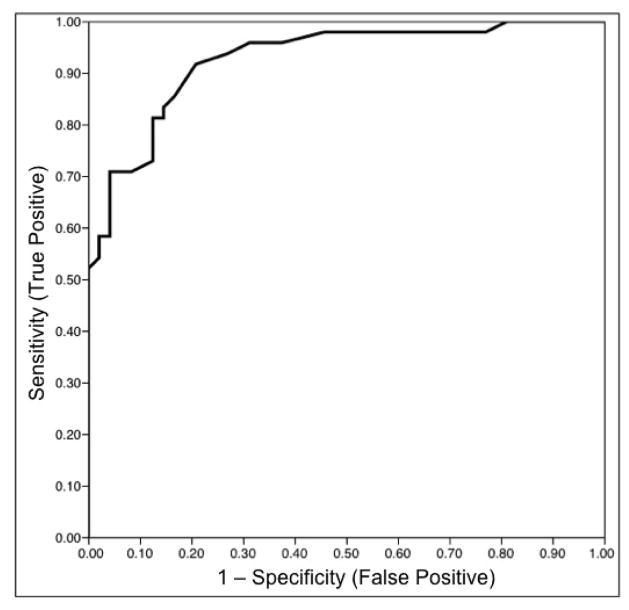
The receiver operating characteristic (ROC) curve using HSA as predictor for HH is shown in Figure 6. HSA cut-off of greater than 3.5 cm2 has 81% sensitivity and 88% specificity for the presence of HH.
Figure 6.
Receiver operating characteristic (ROC) curve predicting the presence of HH using HSA.
In this sample, when subjects with HH and without HH are analyzed as a single group, the mean HSA of those without GERD was 4.0 cm2 (SD 3.0) and mean HSA of those with GERD was 6.7 cm2 (SD 4.8) (p=0.02).
GERD Group without Hiatal Hernia
191 (17%) subjects reported having GERD, 71 of whom were taking GERD-related medication. 51 were taking a proton pump inhibitor. 14 were taking a H2 receptor antagonist, 5 were on both a proton pump inhibitor and a H2 receptor blocker, and 1 was on other anti-reflux medication. 55 of these did not have HH, forming the GERD group. A corresponding sample of 55 demographically matched control subjects was also formed. Respectively, the GERD group and its control group had 36% and 41% males (p=0.56), mean BMI of 32 and 30 (p=0.16), mean age of 60 and 61 (p=0.42), and mean FEV1/FVC of 0.62 and 0.62 (p=0.91).
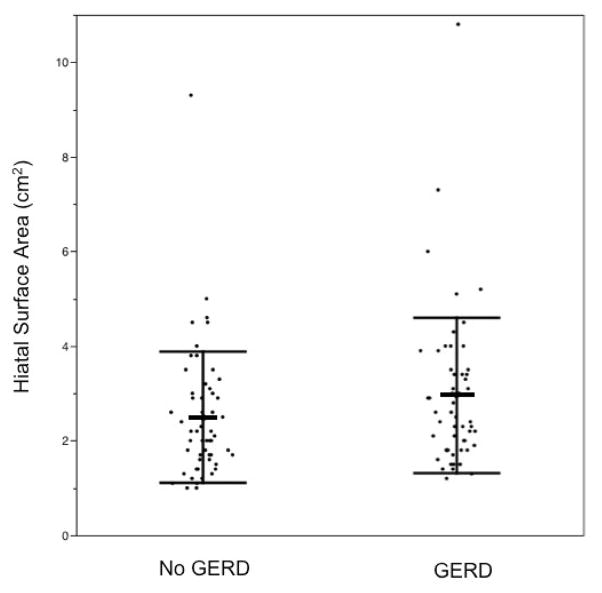
The GERD group had mean HSA of 3.0 cm2 (SD 1.6), while the control group had mean HSA of 2.5 cm2 (SD 1.4), which is not statistically significant (p=0.12) (Fig. 7). HSA cut-off of greater than 3.5 cm2 has 22% sensitivity and 85% specificity for the presence of GERD.
Figure 7.
Distribution of HSA in subjects without and with GERD, with bars indicating mean and SD.
Inter-rater Agreement
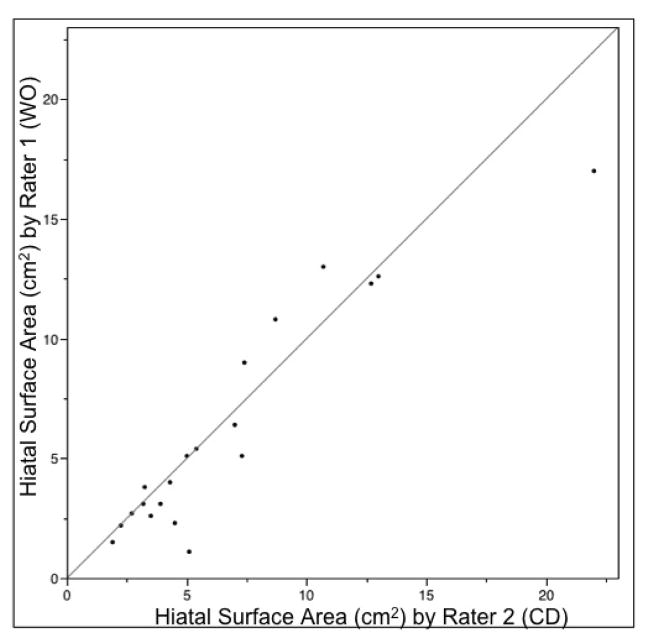
Two radiologists independently analyzed 20 CT scans, showing correlation of 0.93, with mean difference of 0.5 cm2 (p=0.20) (Fig. 8).
Figure 8.
Correlation between HSA measured by two raters in 20 CT scans.
Discussion
The esophageal hiatus is an opening in the diaphragm marginated by tissue in continuity with the diaphragmatic crura. The distal esophagus, vagus nerve, and sympathetic nerve branches pass through it. Pathologic widening of the hiatus has clinical implications. The size of the hiatus affects the surgeon’s choice of hernia repair method and predicts long-term postoperative success rate [9–10]. As such, some advocate routine intra-operative measurement of hiatus area [10, 12]. In addition, large hiatus area among patients with GERD correlated with low LES pressure and increased acid reflux [7–8]. Therefore, accurate noninvasive measurement of hiatal area is clinically relevant.
Because the esophageal hiatus is obliquely positioned with respect to the axes of the body and has non-geometric shape, accurate measurement of its size can be difficult. In this study, we applied a novel method for in vivo measurement of esophageal hiatus area using MDCT MPR. We used a double oblique correction technique to obtain the anatomic hiatus plane, allowing for measurement of the hiatus area. Independent analyzes by two radiologists showed good agreement.
Thin-section MDCT and 3D image post-processing are widely used for various anatomic measurements. The efficacy of CT multiplanar post-processing in providing highly accurate and reproducible measurements of complex anatomic structures has been proven, such as in pre-operative planning for transcatheter aortic valve replacement (TAVR) [18]. While previous measurements of hiatus area in live subjects were limited to indirect methods such as geometric modeling [8–11, 13–14] or estimation from intra-operative photographs [7], our method attempts to measure the hiatus directly. We believe this imaging-based measurement more closely reflects the physiologic state of the hiatus compared to intra-operative measurements, where distortion of anatomy can occur from abdominal gas insufflation, muscle paralysis from anesthetics, and dissection and retraction of surrounding tissue by the surgeon. We propose that CT measurement of HSA has the potential to guide decision-making in antireflux surgery technique pre-operatively; and the same methodology can be used to assess surgical result post-operatively. This measurement technique can be performed using routine MDCTs of the chest or abdomen obtained with standard protocols, which many patients have undergone for unrelated indications.
There is a paucity of data on normal esophageal hiatus size in vivo. The majority of studies investigating the morphometry of this structure are limited to intra-operative measurement among symptomatic patients undergoing antireflux surgery. We had the advantage of studying a heterogeneous population with respect to GERD symptomatology and pathology. In our study, the mean HSA among normal asymptomatic subjects was 2.5 cm2. Batirel et al. estimated that the expected HSA after crural repair should be 2.5–3.0 cm2, which is in agreement with our normal size [7]. Shamiyeh et al. found mean HSA of 5.84 cm2 among cadavers [15].
Multiple factors could have contributed to this discrepancy, related to both post-mortem changes and the technique used. We performed analysis on CT images obtained in deep inspiration because they were of higher quality than expiratory images. Crural contraction during deep inspiration likely resulted in slightly smaller HSA measurements [4].
The complex reciprocal relationship between the formation of HH and hiatal enlargement has been investigated. Each is implicated as a mechanism contributing to development of the other [5]. Whereas hiatal enlargement contributes to the pathogenesis of HH, a hernia also enlarges the hiatus, both causing impairment of the sphincter function and predisposing to reflux [19]. It follows that hiatal enlargement and size of HH should correlate. However, a study by Koch et al. showed poor correlation between HH size on pre-operative barium esophagram and hiatus size measured during antireflux surgery [13]. On the other hand, our study did indeed show statistically significant differences in HSA between people with HH and those without. Furthermore, HSA of people without hernia, people with sliding (type I) hernias, and people with mixed (type III) hernias were all statistically different from each other.
Our data shows association between GERD and HH in accordance with other studies [5, 20–22]. At this time, the role of imaging in the diagnosis of GERD is limited. Gastroesophageal reflux identified by barium esophagram has variable clinical value, and has been shown to correlate poorly with pH monitoring [23–24]. We aimed to determine if hiatus area could serve as an imaging marker for presence of GERD. In a mixed population of hernia-positive and hernia-negative subjects, larger HSA indeed correlated with GERD. However, among people without HH, such correlation was not observed.
Strengths of this study include availability of well-documented demographic information, medical history, and CT images on a large number of subjects within the COPDGene database. We were able to select from this large population to construct demographically matched test and control samples. Our study also had several limitations. Identification of subjects with GERD was limited to self-report and review of medication list, without the benefit of more objective evaluation, such as manometry or pH testing. Limitations of the CT analysis include the inability to blind reviewers to the presence of HH. Finally, we could not confirm external validity of our measurements because no in vivo reference standard is yet available. Comparison between MDCT and intra-operative measurements of the hiatus is a topic of our ongoing investigation.
In conclusion, we were able to quantify in vivo the area of the esophageal hiatus using a MDCT MPR technique, achieving good inter-rater agreement. Subjects with HH had larger hiatuses and more GERD. In a mixed population of hernia-positive and hernia-negative subjects, larger HSA correlated with GERD. However, in subjects without CT evidence of HH, HSA failed to predict the presence of GERD.
Acknowledgments
The authors wish to thank the COPDGene® investigators for access to their considerable body of data and continued support of this research.
Footnotes
The authors have no disclosures to report.
Disclosures
The authors, Drs. Wei Ouyang, Chandra Dass, Huaqing Zhao, Cynthia Kim, and Gerard Criner, have no conflicts of interest or financial ties to disclose. This project was supported by award number R01HL089897 and award number R01HL089856 from the National Heart, Lung, and Blood Institute.
References
- 1.Collis J, Kelly T, Wiley A. Anatomy of the Crura of the Diaphragm and the Surgery of Hiatus Hernia. Thorax. 1954;9:175–189. doi: 10.1136/thx.9.3.175. [DOI] [PMC free article] [PubMed] [Google Scholar]
- 2.Barbosa Costa M, Ary Pires-Neto M. Anatomical investigation of the esophageal and aortic hiatuses: Physiologic, clinical and surgical considerations. Anat Sci Int. 2004;79:21–31. doi: 10.1111/j.1447-073x.2004.00060.x. [DOI] [PubMed] [Google Scholar]
- 3.Loukas M, Wartmann ChT, Tubbs RS, Apaydin N, Louis RG, Jr, Gupta AA, Jordan R. Morphologic variation of the diaphragmatic crura: a correlation with pathologic processes of the esophageal hiatus? Folia Morphol (Warsz) 2008;67:273–279. [PubMed] [Google Scholar]
- 4.Mittal RK, Rochester DF, McCallum RW. Sphincteric action of the diaphragm during a relaxed lower esophageal sphincter in humans. Am J Physiol. 1989;256:G139–144. doi: 10.1152/ajpgi.1989.256.1.G139. [DOI] [PubMed] [Google Scholar]
- 5.Gordon C, Kang J, Neild P, Maxwell J. The role of the hiatus hernia in gastro-oesophageal reflux disease. Aliment Pharmacol Ther. 2004;20:719–732. doi: 10.1111/j.1365-2036.2004.02149.x. [DOI] [PubMed] [Google Scholar]
- 6.Gryglewski A, Pena I, Tomaszewski K, Walocha J. Unsolved Questions Regarding the Role of Esophageal Hiatus Anatomy in the Development of Esophageal Hiatal Hernias. Adv Clin Exp Med. 2014;23:639–644. doi: 10.17219/acem/37247. [DOI] [PubMed] [Google Scholar]
- 7.Batirel H, Uygur-Bayramicli O, Giral A, Ekici B, Bekiroglu N, Yildizeli B, Yüksel M. The Size of the Esophageal Hiatus in Gastroesophageal Reflux Pathophysiology: Outcome of Intraoperative Measurements. J Gastrointest Surg. 2009;14:38–44. doi: 10.1007/s11605-009-1047-8. [DOI] [PubMed] [Google Scholar]
- 8.Koch O, Kaindlstorfer A, Antoniou S, Asche K, Granderath F, Pointner R. Influence of the esophageal hiatus size on the lower esophageal sphincter, on reflux activity and on symptomatology. Diseases of the Esophagus. 2012;25:201–208. doi: 10.1111/j.1442-2050.2011.01238.x. [DOI] [PubMed] [Google Scholar]
- 9.Koch O, Asche K, Berger J, Weber E, Granderath F, Pointner R. Influence of the size of the hiatus on the rate of reherniation after laparoscopic fundoplication and refundopilication with mesh hiatoplasty. Surg Endosc. 2011;25:1024–1030. doi: 10.1007/s00464-010-1308-3. [DOI] [PubMed] [Google Scholar]
- 10.Grubnik V, Malynovskyy A. Laparoscopic repair of hiatal hernias: new classification supported by long-term results. Surg Endosc. 2013;27:4337–4346. doi: 10.1007/s00464-013-3069-2. [DOI] [PubMed] [Google Scholar]
- 11.Granderath F. Measurement of the esophageal hiatus by calculation of the hiatal surface area (HSA). Why, when and how? Surg Endosc. 2007;21:2224–2225. doi: 10.1007/s00464-007-9348-z. [DOI] [PubMed] [Google Scholar]
- 12.Antoniou S, Pointner R, Granderath F. Hiatal surface area as a basis for a new classification of hiatal hernia. Surg Endosc. 2014;28:1384–1385. doi: 10.1007/s00464-013-3292-x. [DOI] [PubMed] [Google Scholar]
- 13.Koch O, Schurich M, Antoniou S, Spaun G, Kaindlstorfer A, Pointner R, Swanstrom L. Predictability of hiatal hernia/defect size: is there a correlation between pre- and intraoperative findings? Hernia. 2013;18:883–888. doi: 10.1007/s10029-012-1033-z. [DOI] [PubMed] [Google Scholar]
- 14.Granderath F, Schweiger U, Pointner R. Laparoscopic antireflux surgery: Tailoring the hiatal closure to the size of hiatal surface area. Surg Endosc. 2007;21:542–548. doi: 10.1007/s00464-006-9041-7. [DOI] [PubMed] [Google Scholar]
- 15.Shamiyeh A, Szabo K, Granderath F, Syré G, Wayand W, Zehetner J. The esophageal hiatus: what is the normal size? Surg Endosc. 2010;24:988–991. doi: 10.1007/s00464-009-0711-0. [DOI] [PubMed] [Google Scholar]
- 16.Regan E, Hokanson J, Murphy J, Make B, Lynch D, Beaty T, Curran-Everett D, Silverman E, Crapo J. Genetic Epidemiology of COPD (COPDGene) Study Design. COPD. 2010;7:32–43. doi: 10.3109/15412550903499522. [DOI] [PMC free article] [PubMed] [Google Scholar]
- 17.Abbara S, Kalan M, Lewicki A. Intrathoracic Stomach Revisited. American Journal of Roentgenology. 2003;181:403–414. doi: 10.2214/ajr.181.2.1810403. [DOI] [PubMed] [Google Scholar]
- 18.Cerillo A, Mariani M, Berti S, Glauber M. Sizing the aortic annulus. Ann Cardiothorac Surg. 2012;1:245–256. doi: 10.3978/j.issn.2225-319X.2012.06.13. [DOI] [PMC free article] [PubMed] [Google Scholar]
- 19.Sloan S, Rademaker A, Kahrilas P. Determinants of Gastroesophageal Junction Incompetence: Hiatal Hernia, Lower Esophageal Sphincter, or Both? Annals of Internal Medicine. 1992;117:977. doi: 10.7326/0003-4819-117-12-977. [DOI] [PubMed] [Google Scholar]
- 20.Kahrilas P. GERD pathogenesis, pathophysiology, and clinical manifestations. Cleveland Clinic Journal of Medicine. 2003;70:S4–S4. doi: 10.3949/ccjm.70.suppl_5.s4. [DOI] [PubMed] [Google Scholar]
- 21.Jones M, Sloan S, Rabine J, Ebert C, Huang C, Kahrilas P. Hiatal hernia size is the dominant determinant of esophagitis presence and severity in gastroesophageal reflux disease. Am J Gastroenterology. 2001;96:1711–1717. doi: 10.1111/j.1572-0241.2001.03926.x. [DOI] [PubMed] [Google Scholar]
- 22.Franzén T. Is the severity of gastroesophageal reflux dependent on hiatus hernia size? WJG. 2014;20:1582. doi: 10.3748/wjg.v20.i6.1582. [DOI] [PMC free article] [PubMed] [Google Scholar]
- 23.Chen M, Ott D, Sinclair J, Wu W, Gelfand D. Gastroesophageal reflux disease: correlation of esophageal pH testing and radiographic findings. Radiology. 1992;185:483–486. doi: 10.1148/radiology.185.2.1410359. [DOI] [PubMed] [Google Scholar]
- 24.Saleh C, Smout A, Bredenoord A. The diagnosis of gastro-esophageal reflux disease cannot be made with barium esophagograms. Neurogastroenterol Motil. 2014;27:195–200. doi: 10.1111/nmo.12457. [DOI] [PubMed] [Google Scholar]


