Abstract
Differences in the composition of a bacterial community engaged in decomposing wheat straw in a fluvo-aquic soil at 15 °C, 25 °C, and 35 °C were identified using barcode pyrosequencing. Functional carbon groups in the decomposing wheat straw were evaluated by 13C-NMR (nuclear magnetic resonance). Actinobacteria and Firmicutes were more abundant, whereas Alphaproteobacteria and Bacteroidetes were less abundant, at higher temperatures during the later stages of decomposition. Differences in the chemical properties of straw accounted for 19.3% of the variation in the community composition, whereas soil properties accounted for more (24.0%) and temperature, for less (7.4%). Carbon content of the soil microbial biomass and nitrogen content of straw were significantly correlated with the abundance of Alphaproteobacteria, Actinobacteria, and Bacteroidetes. The chemical properties of straw, especially the NCH/OCH3, alkyl O-C-O, and O-alkyl functional groups, exercised a significant effect on the composition of the bacterial community at different temperatures during decomposition—results that extend our understanding of bacterial communities associated with the decomposition of straw in agro-ecosystems and of the effects of temperature and chemical properties of the decomposing straw and soil on such communities.
The quantity and quality of soil organic matter (SOM) play a vital role in the sustainability of terrestrial ecosystems1,2,3. Large amounts of SOM are derived from plant residues. The decomposition of plant litter regulates the size of the soil carbon (C) pools and the recycling of plant nutrients, and also controls the CO2 fluxes to the atmosphere in terrestrial ecosystems4,5. The main organic components in plant litter are hydrophilic compounds, carbohydrate polymers (cellulose and hemicellulose), and lignin. Cellulose and hemicellulose are labile components in plant litter, whereas lignin—a complex polymer of aromatic rings—is a stable component that resists degradation6. The labile components are eventually exhausted, whereas the recalcitrant components tend to accumulate during decomposition, and these changes in the chemical composition of plant litter, including straw, regulate the composition of microbial communities engaged in decomposing the litter.
Recent studies suggest that microorganisms play a crucial role in the decomposition of plant litter in terrestrial ecosystems. For example, Pankratov et al.7 reported that bacteria are one of the main cellulose decomposers in Sphagnum peat, and Štursová et al.8 demonstrated that bacteria incorporated more 13C-labelled cellulose than fungi did during the decomposition of a layer of plant litter in a Picea abies forest in Europe, indicating that bacteria in the layer of plant litter are more active than fungi in the process of decomposition. Šnajdr et al.9 found that Actinobacteria play a key role in the C cycle and turnover of organic matter at later stages of litter decomposition. Acidobacteria is also considered to play an important role in degrading complex polymers such as cellulose and xylan10,11. However, the pattern of succession in a bacterial community engaged in decomposing straw with changes in its chemical properties at different stages of decomposition remains unclear.
Many studies have investigated the factors that influence the composition of microbial communities involved in decomposing straw. These factors include temperature, soil properties, and chemical composition of the litter3,12. Temperature, by changing the composition of the microbial community and the activity of different taxa that make up the community13,14,15, changes the production and activity of extracellular enzymes that catalyse litter decomposition16,17. An earlier study demonstrated that the carbon/nitrogen (C/N) ratio in soil and total organic C are significantly correlated with the composition of bacterial communities18. The chemical composition of straw is also influenced by changes in temperature during decomposition: changes in C/N ratio and lignin, for example, may lead to changes in the succession pattern of microbial communities3,9,19. However, these studies mostly focused on only a single factor: research on the combined effects of chemical properties of soil and straw on the composition of a microbial community at different temperatures and on the interaction between community composition and the chemical properties of straw is somewhat limited.
With this background, we propose that (1) temperature and soil properties will change the composition of a microbial community engaged in decomposing straw at different stages of decomposition and (2) the chemical composition of straw and the composition of microbial community are linked, and the links are influenced by changes in temperature. To test these hypotheses, we studied the decomposition of wheat straw at three temperatures (15 °C, 25 °C, and 35 °C) and followed the changes in chemical composition of straw and in the composition of the microbial community 30 days (early stage)12 and 120 days (late stage)20 after starting the experiment, (1) to evaluate the relative contributions of temperature, soil properties, and those of straw, to changes in the bacterial community and (2) to test the relationship between the chemical properties of straw and the composition of the bacterial community at the three temperatures.
Results
Effect of temperature on properties of soil and straw
Over 120 days of decomposition, no significant differences were found in the soil C/N ratio and the levels of dissolved organic carbon (DOC) at the different temperatures, nor did temperature have any significant effect on the C content of straw at the early stage (day 30). However, at the late stage (day 120), the C content at 15 °C was significantly greater than that at 25 °C. Microbial biomass carbon (MBC) and pH tended to decrease with the increase in temperature, whereas dissolved organic nitrogen (DON) in soil, and N and phosphorus (P) contents of straw, tended to increase with the increase in temperature on day 30 and on day 120 (Table 1).
Table 1. Chemical properties of soil and wheat straw at early and late stages of decomposition at different temperatures.
| Parameter | L30 | M30 | H30 | L120 | M120 | H120 |
|---|---|---|---|---|---|---|
| pH | 7.42 ± 0.02a | 7.38 ± 0.01ab | 7.27 ± 0.01bc | 7.47 ± 0.02a | 7.36 ± 0.05ab | 7.24 ± 0.01c |
| C/N ratio | 20.03 ± 0.53a | 19.44 ± 0.45a | 19.43 ± 0.58a | 18.12 ± 0.12a | 18.11 ± 0.60a | 17.41 ± 0.87a |
| DOC (mg kg–1) | 125.44 ± 1.92a | 126.19 ± 9.40a | 130.40 ± 4.04a | 118.85 ± 2.76a | 117.62 ± 2.87a | 134.73 ± 4.71a |
| DON (mg kg–1) | 81.57 ± 3.09d | 99.95 ± 2.83d | 148.96 ± 1.74c | 70.05 ± 4.86d | 185.12 ± 6.58b | 234.85 ± 12.77a |
| MBC (mg kg–1) | 295.15 ± 10.01b | 292.53 ± 2.46b | 174.51 ± 15.91c | 362.98 ± 9.34a | 338.69 ± 17.35ab | 169.14 ± 9.29c |
| MBN (mg kg–1) | 21.08 ± 4.11c | 35.52 ± 2.70abc | 46.19 ± 3.09ab | 34.36 ± 5.54bc | 52.61 ± 4.31a | 39.55 ± 1.19ab |
| Straw C (g kg–1) | 414.85 ± 12.31bc | 434.30 ± 5.19b | 418.14 ± 18.31b | 490.63 ± 6.39a | 342.40 ± 11.91d | 361.68 ± 8.56cd |
| Straw N (g kg–1) | 3.93 ± 0.10b | 5.06 ± 0.63b | 8.14 ± 0.37a | 4.45 ± 0.05b | 4.85 ± 0.07b | 6.76 ± 0.07a |
| Straw P (g kg–1) | 0.53 ± 0.01e | 0.58 ± 0.03e | 0.90 ± 0.05d | 1.11 ± 0.05c | 1.45 ± 0.01b | 2.02 ± 0.02a |
L30: low temperature (15 °C) on day 30 (early stage of decomposition); M30: moderate temperature (25 °C) on day 30; H30: high temperature (35 °C) on day 30; L120: low temperature on day 120 (late stage of decomposition); M120: moderate temperature on day 120; H120: high temperature on day 120.
C/N ratio: soil carbon/nitrogen ratio, DOC: soil dissolved organic carbon, DON: soil dissolved organic nitrogen, MBC: soil microbial biomass carbon, MBN: soil microbial biomass nitrogen.
The values are average values ± standard error (n = 3). Different letters within a row indicate a significant difference (P < 0.05) between treatments according to Tukey’s test.
Temperature greatly affected the proportions of C functional groups in the total spectral area in wheat straw (Fig. S1). At higher temperatures, the proportions of NCH/OCH3 and aromatic C–C+/H tended to increase whereas those of O-alkyl and alkyl O-C-O tended to decrease (Table 2); on the other hand, the proportion of alkyl C was not significantly correlated with temperature.
Table 2. The assignment of functional groups at different chemical-shift regions and their proportions in the total spectral area determined by 13C NMR.
| Group | 190–220 ppm | 165–190 ppm | 142–165 ppm | 110–142 ppm | 93–110 ppm | 60–93 ppm | 45–60 ppm | 0–45 ppm |
|---|---|---|---|---|---|---|---|---|
| Assignment | ketones/aldehydes | COO/N–C = O | aromatic C–O | aromatic C–C + /H | alkyl O–C–O | O–alkyl | NCH/OCH3 | alkyl |
| L30 | 1.4 ± 0.2cd | 6.2 ± 0.1d | 3.9 ± 0.1d | 9.4 ± 0.1c | 9.8 ± 0.2a | 42.8 ± 1.0a | 8.4 ± 0.1d | 18.2 ± 1.2a |
| M30 | 1.0 ± 0.1d | 6.7 ± 0.1d | 3.9 ± 0.0d | 9.7 ± 0.1c | 8.5 ± 0.1b | 38.1 ± 0.1b | 10.9 ± 0.1b | 21.2 ± 0.1ab |
| H30 | 2.0 ± 0.4bc | 8.7 ± 0.3c | 5.5 ± 0.3c | 11.9 ± 0.3b | 7.9 ± 0.1b | 30.7 ± 0.2c | 11.9 ± 0.3a | 21.5 ± 1.1ab |
| L120 | 2.9 ± 0.0ab | 9.9 ± 0.1b | 5.8 ± 0.1bc | 11.7 ± 0.1b | 7.3 ± 0.1c | 31.1 ± 0.1c | 9.8 ± 0.1c | 21.5 ± 0.2a |
| M120 | 3.0 ± 0.1a | 9.9 ± 0.1b | 6.2 ± 0.0b | 12.5 ± 0.1ab | 7.0 ± 0.0d | 30.2 ± 0.1c | 9.9 ± 0.1c | 21.2 ± 0.1ab |
| H120 | 3.0 ± 0.1ab | 10.8 ± 0.2a | 7.4 ± 0.1a | 12.9 ± 0.2a | 6.5 ± 0.0cd | 24.8 ± 0.2d | 11.7 ± 0.2a | 23.0 ± 0.4a |
L30: low temperature (15 °C) on day 30 (early stage of decomposition); M30: moderate temperature (25 °C) on day 30; H30: high temperature (35 °C) on day 30; L120: low temperature on day 120 (late stage of decomposition); M120: moderate temperature on day 120; H120: high temperature on day 120.
Bacterial community diversity at different temperatures
Taking all the wheat straw samples together, a total of 179 560 sequences were obtained (Fig. S2). The average number of sequences per sample was 9975 and the range was 1100 to 33 987; nearly all (99.5%) the sequences could be classified (Table S2). Phylogenetic diversity (PD), Chao1 index, Shannon index, and richness in terms of the number of operational taxonomic units (OTUs) were estimated for 1050 randomly selected sequences per sample. No significant differences in PD and Chao1 index were seen between L30 (which denotes low temperature (15 °C) and the early stage of decomposition, that is day 30) and M30 (moderate temperature (25 °C) and day 30) and in Shannon index and OTU richness between L30 and H30 (high temperature (35 °C) and day 30) (Table 3). Two more treatments, namely M120 (moderate temperature and late stage) and H120 (high temperature and late stage), were similar in terms of PD, Shannon and Chao1 indexes, and OTU richness (Table 3). Overall, temperature had no significant effect on the bacterial diversity indexes (Table 3).
Table 3. Bacterial alpha-diversity in all treatments sampled on day 30 and day 120 of the incubation period.
| Treatment | Bacterial alpha-diversity |
|||
|---|---|---|---|---|
| PD | Shannon | Chao1 | OTU richness | |
| L30 | 20.9 ± 1.9bc | 4.8 ± 0.3d | 567.0 ± 47.9a | 169.2 ± 20.3cd |
| M30 | 23.0 ± 0.3bc | 6.1 ± 0.1bc | 666.9 ± 61.0a | 264.6 ± 5.9ab |
| H30 | 13.5 ± 1.3d | 4.5 ± 0.2d | 298.8 ± 15.5b | 139.8 ± 8.0d |
| L120 | 19.8 ± 0.9c | 5.5 ± 0.1c | 559.6 ± 71.1a | 208.6 ± 17.8bc |
| M120 | 29.0 ± 0.3a | 7.0 ± 0.0a | 684.7 ± 8.1a | 298.7 ± 1.7a |
| H120 | 25.3 ± 0.3ab | 6.4 ± 0.0ab | 619.2 ± 20.3a | 257.7 ± 2.8ab |
L30: low temperature (15 °C) on day 30 (early stage of decomposition); M30: moderate temperature (25 °C) on day 30; H30: high temperature (35 °C) on day 30; L120: low temperature on day 120 (late stage of decomposition); M120: moderate temperature on day 120; H120: high temperature on day 120. PD, Shannon, Chao1, and OTU richness are phylogenetic diversity, Shannon index, Chaol index, and estimated maximum OTU number and observed OTU number, respectively. The diversity indexes were calculated using 1050 randomly selected sequences per sample. Results are expressed as mean ± standard error for the amended treatments (n = 3), and different letters within a column indicate a significant difference at P < 0.05 based on Tukey’s test.
Changes in composition, phyla and groups at different temperatures
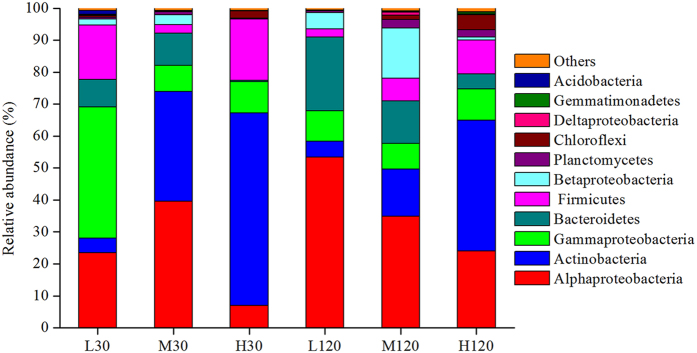
Non-metric multidimensional scaling (NMDS) analysis clearly showed variations in the bacterial community among the different treatments (temperatures and the two stages of decomposition). The first axis differentiated microbial communities at 35 °C from those at 15 °C and 25 °C (Fig. S3), pointing to the clear effect of temperature. The dominant phyla across all the samples were Alphaproteobacteria, Actinobacteria, Gammaproteobacteria, Bacteroidetes, and Firmicutes, which together accounted for more than 78% of the sequences from each sample (Fig. 1). Betaproteobacteria, Planctomycetes, Chloroflexi, Deltaproteobacteria, Gemmatimonadetes, and Acidobacteria were also found in all the samples but in fairly small numbers (Fig. 1).
Figure 1. Relative abundance of dominant bacterial phyla in decomposing wheat straw.
L30: low temperature (15 °C) on day 30 (early stage of decomposition); M30: moderate temperature (25 °C) on day 30; H30: high temperature (35 °C) on day 30; L120: low temperature on day 120 (late stage of decomposition); M120: moderate temperature on day 120; H120: high temperature on day 120.
Temperature exerted highly specific effects on the relative abundance of different phyla (Fig. 1) in four distinct ways: (1) increase in relative abundance with increase in temperature on day 30 and day 120 (e.g. Actinobacteria, P < 0.001), (2) decrease in relative abundance with increase in temperature on day 120 (e.g. Alphaproteobacteria and Bacteroidetes, P < 0.001), (3) the lowest abundance (e.g. Firmicutes, P < 0.001) or the highest abundance (e.g. Alphaproteobacteria, P < 0.001) at moderate temperature on day 30, and (4) insensitivity to temperature (e.g. Gammaproteobacteria, P = 0.099).
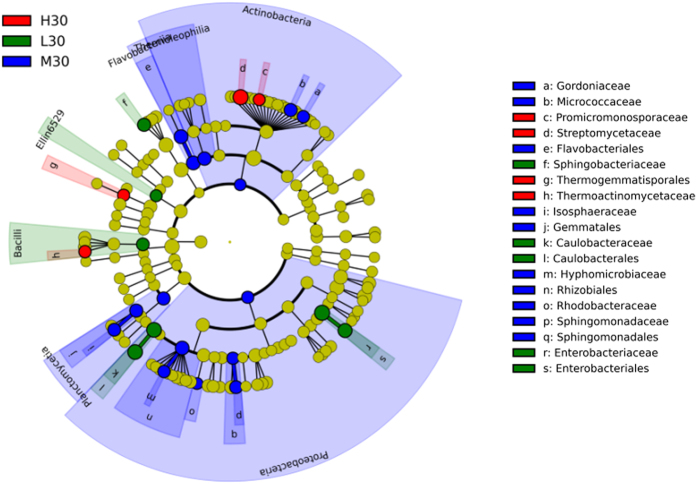
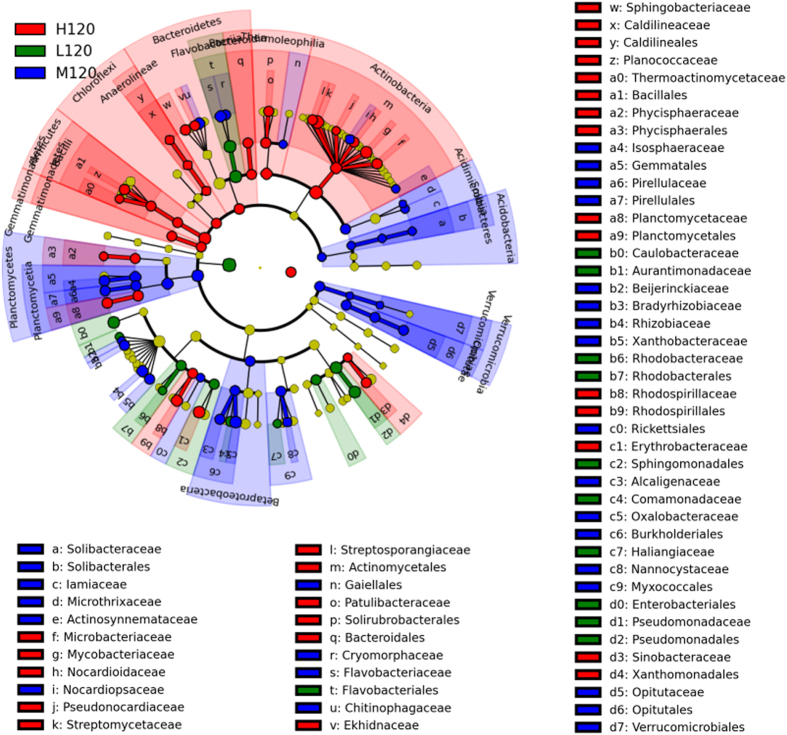
The taxa that differed between the different treatments were identified by linear discriminant effect size (LEfSe) analysis (Fig. 2 shows the early stage and Fig. 3 shows the late stage). Temperature was closely related to the abundance of different species, particularly Actinobacteria and Proteobacteria, on day 30. As shown by the circular cladogram, Sphingobacteriaceae, Caulobacteraceae, and Enterobacteriaceae were significantly more abundant in L30; Gordoniaceae, Micrococcaceae, Isosphaerceae, Hyphomicrobiaceae, Rhodobacteraceae, and Sphingomonadaceae in M30; and Promicromonosporaceae, Streptomycetaceae, and Themoactinomycetaceae in H30 (Fig. 2). The richness and diversity of some microbial groups were greater on day 120 than on day 30 (Fig. 3): Caulobacteraceae, Comamonadaceae, and Pseudomonadaceae were more abundant in L120; Cryomorphaceae, Flavobacteriaceae, Isosphaeraceae, Pirellulaceae, Rhizobiaceae, and Xanthobacteraceae in M120; and Mycobacteriaceae, Streptomycetaceae, Rhodospirillaceae, and Erythrobacteraceae in H120 (Fig. 3).
Figure 2. Composition of bacterial community at different temperatures on day 30 (early stage of decomposition of wheat straw).
L30: low temperature (15 °C) on day 30 (early stage of decomposition); M30: moderate temperature (25 °C) on day 30; H30: high temperature (35 °C) on day 30.
Figure 3. Composition of bacterial community at different temperature on day 120 (late stage of decomposition of wheat straw).
L120: low temperature on day 120 (late stage of decomposition); M120: moderate temperature on day 120; H120: high temperature on day 120.
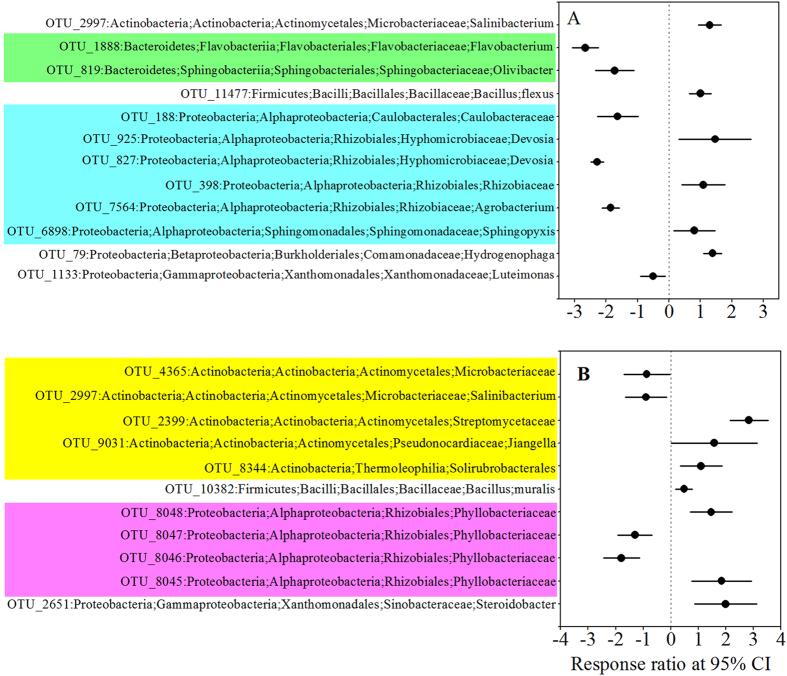
Several phyla responded inconsistently to temperature (Fig. 4). The abundance of Actinobacteria and Betaproteobacteria increased significantly from 15 °C to 25 °C, whereas that of Bacteroidetes and Gammaproteobacteria decreased significantly (Fig. 4A); on the other hand, Alphaproteobacteria (phylum Proteobacteria) remained unaffected. Similar patterns were observed between 25 °C and 35 °C except that Actinobacteria showed no significant difference and Gammaproteobacteria was significantly more abundant at 35 °C (Fig. 4B).
Figure 4. Operational taxonomic units that showed significant changes in abundance at 25 °C as compared to that at 15 °C (A) and at 35 °C (B) on day 120 (late stage of decomposition of wheat straw).
Significance was determined using response ratio methods at a confidence interval of 95%.
Changes in composition and phyla due to changes in properties of soil and straw
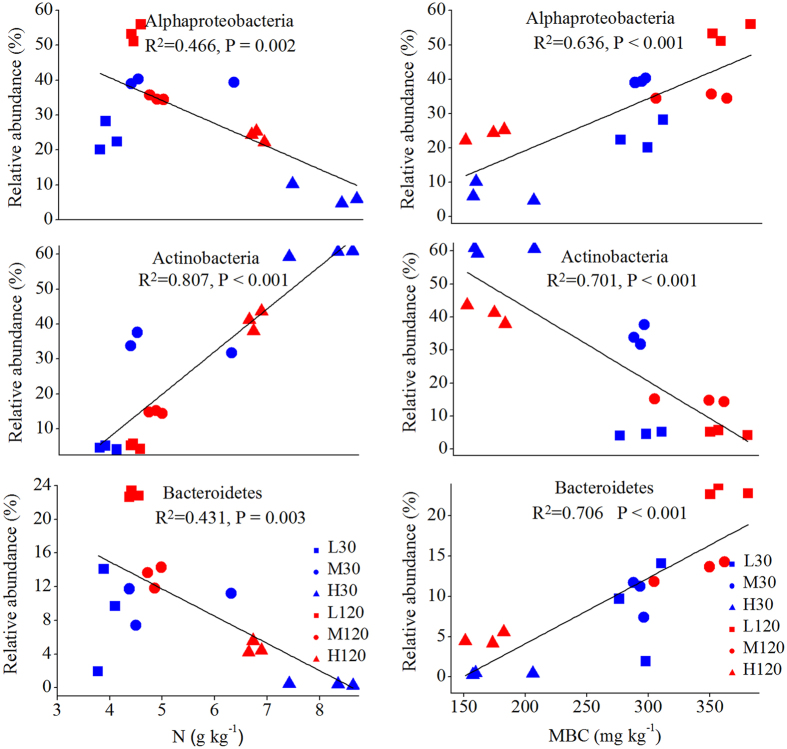
Mantel tests showed that the composition of the bacterial community was significantly correlated with such properties of soil and straw as pH, MBC, and N content (Table S3). Among the soil properties, the correlation was particularly strong for pH, DON, and MBC (P = 0.001) and among the properties of straw, for levels of C, N, and P (P < 0.01) (Table S3). Factors that influenced the composition of the bacterial community significantly were chosen for canonical correspondence analysis (CCA), which showed that soil MBC and straw N content exerted particularly strong effects (Fig. 5). These results were similar to those of the Mantel test. The effects of MBC and straw N content on the dominant phyla were examined using linear regression analysis: it is noteworthy that soil MBC was significantly (P < 0.001) correlated with the abundance of Alphaproteobacteria, Actinobacteria, and Bacteroidetes; the N content was also significantly (P < 0.01) correlated with the same three phyla, but the direction of the effect was opposite of that in the case of MBC (Fig. 6). Variation partitioning analysis (VPA) showed that combinations of temperature, soil properties (including pH, DOC, DON, and MBC), and the properties of straw (total C, N, P) were significantly (P = 0.002) correlated with the community composition (pairwise Jaccard distances between samples) (Fig. 7). These variables explained 65.4% of the observed variation; the rest remained unexplained. Among the factors mentioned above, soil properties explained 24.0% (P = 0.002) of the variation; temperature, 7.4% (P = 0.014); the properties of straw, 19.3% (P = 0.007); and the interaction among the three variables, 4.0% (Fig. 7). Path analysis demonstrated that the direct effect of temperature on bacterial community composition was less than the effects of soil and straw properties (Table S4). Namely, the indirect effects of temperature via changes in soil and straw properties are more significant than its direct effect on bacterial composition.
Figure 5. Canonical correspondence analysis (CCA) of bacterial communities under different treatments.
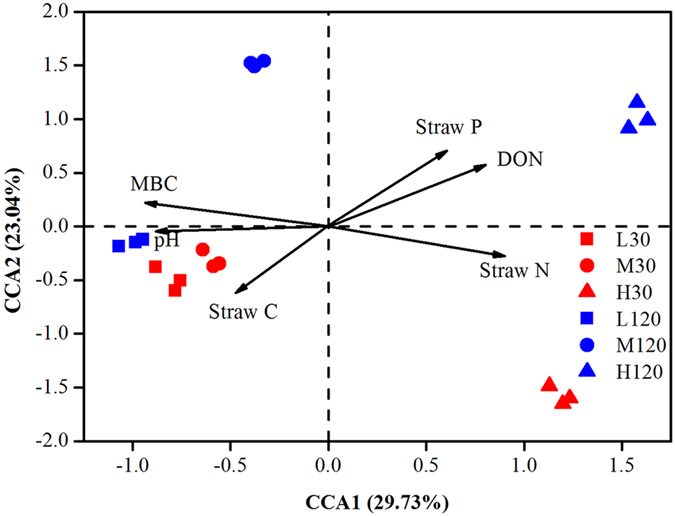
L30: low temperature (15 °C) on day 30 (early stage of decomposition); M30: moderate temperature (25 °C) on day 30; H30: high temperature (35 °C) on day 30; L120: low temperature on day 120 (late stage of decomposition); M120: moderate temperature on day 120; H120: high temperature on day 120.
Figure 6. The relationship between abundance of dominant bacterial groups and (1) nitrogen content of straw and (2) soil microbial biomass carbon (MBC) contents under different treatments.
Linear regressions were used to test the correlation.
Figure 7. Variation partitioning analysis (VPA) of the effects of temperature, soil properties, and properties of straw on composition of bacterial community.
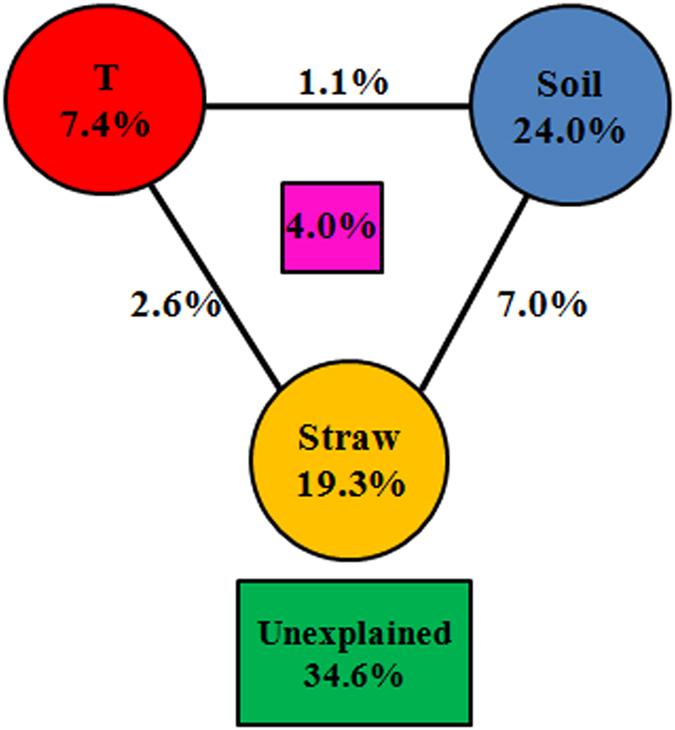
T = temperature.
Changes in the availability of C—particularly that of easily water-soluble C—change the composition of the microbial community. However, which compounds regulate the community dynamics in later stages of decomposition once the easily available C is depleted? An earlier study indicated that 30 days is not long enough to detect changes in the chemistry of the residue because decomposition is slow in the first few days21. Therefore, functional groups in straw that had been decomposing for 120 days rather than for 30 days were taken in the present experiment for redundancy analysis (RDA). Axis 1 separated O-alkyl and alkyl O-C-O groups from the other functional groups and explained 43.48% of the variation, whereas axis 2 explained 18.28% of the variation. The biplots of functional groups of C from samples of straw indicated that NCH/OCH3 (45–60 ppm) and O-alkyl (60–93 ppm) had greater effects (the longer arrow) on the composition of the bacterial community (Fig. 8).
Figure 8. Redundancy analysis (RDA) relating bacterial community composition to straw quality during decomposition.
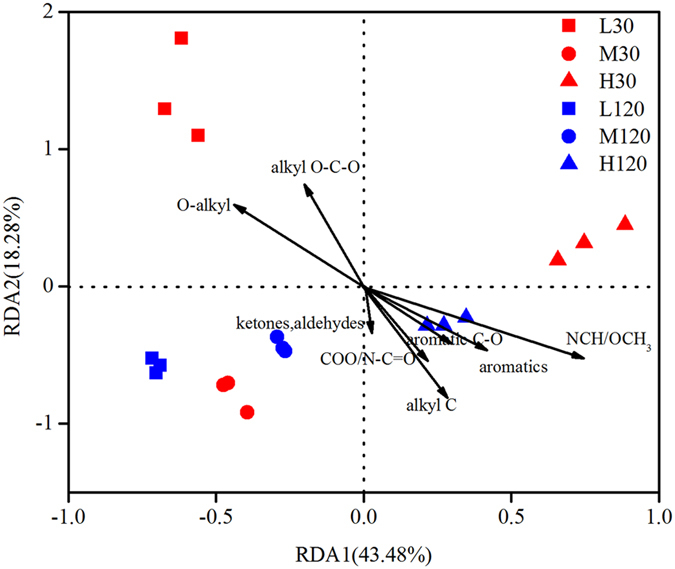
L30: low temperature (15 °C) on day 30 (early stage of decomposition); M30: moderate temperature (25 °C) on day 30; H30: high temperature (35 °C) on day 30; L120: low temperature on day 120 (late stage of decomposition); M120: moderate temperature on day 120; H120: high temperature on day 120.
Discussion
We found that indirect instead of direct effects of temperature via soil and chemical properties of straw influence microbial community. Temperature explained only 7.4% of the variation in the composition of the bacterial community, whereas the soil and straw variables explained as much as 24.0% and 19.3%, respectively (Fig. 7). Path analysis also demonstrated that the direct effects of higher temperature on bacterial communities were minor relative to the potential indirect effects (Table S4). A similarly minor effect of higher temperatures on bacterial communities compared to that of soil and plant variables was reported in a field experiment on an alpine meadow in a Tibetan plateau22. Our study clarified that the indirect effects of temperature, which contained the changes of C, N availability and chemical groups of straw, played an important role in the decomposing bacterial community structure during wheat straw decomposition.
The changes in C availability influence the decomposing bacterial community
The present experiment clearly showed the effects of temperature on the structure of bacterial communities (Table 3, Figs 2 and 3 and Fig. S3)—effects that are consistent with those reported earlier13,23,24 and with our first hypothesis. Plant straw is very rich in carbon and nitrogen, as well as containing an abundance of certain more readily degradable molecules such as cellulose and hemicellulose5. Alphaproteobacteria, Actinobacteria and Bacteroidetes have been known to degrade organic materials and plant-derived polymers5 and became more abundant in response to straw returning. The abundances of Alphaproteobacteria, Actinobacteria and Bacteroidetes, which are considered to have a positive correlation with soil available C25, varied with the temperatures. Stark et al.15 observed that Alphaproteobacteria became more abundant as soil temperature increased from 4 °C to 14 °C. Yergeau et al.13 also found that Alphaproteobacteria and Actinobacteria were more abundant in warmer soils (warmer by 0.5–2 °C), probably because more soil organic C was available in those soils, which, in turn, favoured the fast-growing microorganisms (the copiotrophs, such as Alphaproteobacteria and Bacteroidetes) over the oligotrophs such as Actinobacteria26. However, the present study showed the opposite response: Alphaproteobacteria were less abundant at 35 °C than at 15 °C on day 120 (Fig. 1). The much greater increase in temperature—from 15 °C to 35 °C—in the present experiment may have depleted soil organic C, thereby limiting the reproduction of copiotrophs and favouring that of oligotrophs instead. Thus, temperature-induced changes in bacterial community may, in turn, regulate the characteristics of soil and of straw, ultimately changing the C cycles in terrestrial ecosystems27,28,29,30,31.
The change in N availability during straw decomposition influences bacterial community structure
An increase in the N content of straw was observed with time due to the accumulation of N from the more recalcitrant compounds of N, which, by definition, take longer to decompose. Over time, as the litter quantity and/or quality decreased, Actinobacteria and Bacteroidetes became more abundant. Actinobacteria, which are oligotrophs, play a crucial role in degrading recalcitrant compounds such as cellulose and xylan5,10. Bacteroidetes is also considered to compete well when the availability of substrate is low3 and possesses a great capacity for degrading carbohydrates7. These results indicate a link between the attributes of straw, such as its N content, and the community of bacteria engaged in decomposing the straw. Straw N content showed a significant linear correlation with the dominant phylum (Fig. 6). Cleveland et al.4 found that litter quality explained 16% of the variation in the composition of a bacterial community, and in the present experiment, properties of straw explained 19.3% of such variation (Fig. 7). Microorganisms use available C in the straw in the initial stages of decomposition; in its later stages, they use N, accumulated, by that time, as a result of the breakdown of recalcitrant N compounds32. The quantity and quality of straw as a substrate, especially its N contents, regulate the bacterial communities (Fig. 5), probably because the easily available N compounds favour copiotrophs such as Alphaproteobacteria and Bacteroidetes in the early stages of decomposition, whereas the recalcitrant N compounds favour oligotrophs such as Actinobacteria in the later stages.
The changes in chemical groups of straw influence the decomposing bacterial community
Redundancy analysis based on 13C chemical groups of straw to evaluate more precisely the effect of changes in chemical properties of straw on the structure of the bacterial community showed that changes in community composition were related mainly to the concentrations of NCH/OCH3 (45–60 ppm) and O-alkyl (60–93 ppm) (Fig. 8). The concentration of alkyl O-C-O, found mainly in carbohydrates, was also significantly (P < 0.05) correlated to the diversity of the microbial community. However, carbohydrates such as sugars, which were dominant in the early stage, were depleted in the later stage of decomposition, and the effect of alkyl O-C-O was weaker than that of NCH/OCH3 and O-alkyl at the later stage: NCH/OCH3 is found mainly in nucleotides, proteins, and lignin, which are more resistant to decomposition than carbohydrates are. Aromatics and alkyl C, found mainly in the lignin in wheat straw33, also affected the composition of the microbial community (Fig. 8), indicating its strong link with the lignin content of straw. These results support our second hypothesis, namely that chemical properties of straw are strongly correlated with the structure of the bacterial community that decomposes the straw.
Earlier studies were focused on the effects of temperature either on the chemical properties of straw and its decomposition34,35 or on the microbial community during the decomposition of straw3,36: the interaction between straw and the microbial community at different temperatures was most often ignored—the present study, however, shows a clear link between the two (Fig. 8). Baumann et al.33, using different types of residue, investigated the relationship between residual C and composition of the microbial community by means of phospholipid fatty acid (PLFA) analysis and found that the differences in the proportions of alkyl O-C-O were strongly related to the composition of the microbial community irrespective of the type of residue (eucalyptus, wheat, and vetch), although in the case of the eucalyptus residue, O-alkyl C played a more important role than alkyl O-C-O did. In the present study, the proportion of alkyl O-C-O, found mainly in carbohydrates such as sugars, decreased at the higher temperatures (Table 2), suggesting that the differences in the microbial community reflect the differences in soluble sugars. The 13C chemical groups of O-alkyl moieties (60–93 ppm), which are attributed mainly to C2-C6 groups of carbohydrates37 and lignin, were preferentially degraded, and the proportion of O-alkyl decreased at the higher temperatures (Table 2). These results suggest that both carbohydrates and lignin influenced succession in the microbial community at different temperatures. In addition, NCH/OCH3 was also associated with the differences in the community structure: NCH, which is attributed to proteins or peptides, increased at the higher temperature, as did OCH3, which is attributed to lignin37. These data are in agreement with those of the study mentioned above33, indicating that proteins or amino acids are important drivers of the structure of microbial communities engaged in decomposing the residues of organic matter in soil.
Methods
Soil collection
One soil sample was collected from the Fengqiu Agro-Ecological Experimental Station of the Chinese Academy of Sciences, Fengqiu County (35°00′ N, 114°24′ E), Henan province, China. The annual average precipitation is this region is 615 mm and the average temperature is 13.9 °C. The soil is sandy loams (40.7% silt, 45.6% sand, and 13.7% clay), derived from the alluvial sediment of the Yellow River, and classified as Aquic Inceptisols according to the USDA classification system. The soil sample was taken from the plough layer (0–20 cm) after the harvest of wheat in May 2013 and sieved through a 2 mm sieve after removing visible plant litter and stones. The soil sample was divided into two subsamples, one was air-dried and the other was stored at 4 °C.
Straw incorporation and soil incubation
Wheat (Triticum aestivum L.) straw was sampled from the same site in May 2013, oven-dried at 60 °C, and cut into 2 cm lengths. The straw samples were placed in double-layered nylon bags (10 cm × 10 cm, 0.074 mm mesh) to prevent the straw from being mixed with the surrounding soil. Each bag contained 10 g of wheat straw and was buried horizontally in 2 L plastic jars, each filled with 400 g of air-dried soil. The jars were incubated at 15 °C, 25 °C, and 35 °C for 120 days. Each treatment had three replicates. Soil moisture content was maintained at 70% of the maximum water-holding capacity (WHC, w/w) by adding distilled water whenever required. Three nylon mesh bags at each temperature were collected after 30 days and three more after 120 days and the samples were weighed: one subsample was oven-dried to determine the moisture content and the other stored at −20 °C.
Chemical and biological analyses of soil
Soil pH was measured with a pH meter using soil suspension (1 part of soil and 5 parts of water, w/v). Soil total C (TC) was determined by dichromate oxidation and total nitrogen (TN) by titration with ferrous ammonium sulphate38; DOC and DON were extracted with 2M KCl and were analysed using a TOC analyser (Multi N/C 3100, Analytik Jena, Germany); and MBC and microbial biomass N (MBN) were analysed by the chloroform fumigation and extraction method39. The results were calculated using 0.38 (KC) and 0.45 (KN) as correction factors40 for C and N, respectively. For the straw, TC was determined by dichromate oxidation; TN, by the Kjeldahl method; and TP, by spectrophotometry34,41.
13C-NMR Spectroscopy
The straw samples were ground fine enough to pass through a 0.074 mm sieve for NMR analysis. Information on the functional groups of C in the straw was obtained by solid-state 13C NMR analysis using a Bruker Avance 400 spectrophotometer (BrukerBioSpin, Rheinstetten, Germany) at a frequency of 100.6 MHz for 13C. Approximately 100 mg of straw was packed in a 4 mm sample rotor and spun at 5 kHz. The contact time and the recycle delays were 1 ms and 2 s, respectively. The number of scans was 2000 for each sample.
The spectra were integrated into eight chemical-shift regions, with assignments as follows42,43: 0–45 ppm, nonpolar alkyl; 45–60 ppm, NCH/OCH3; 60–93 ppm, O–alkyl; 93–110 ppm, alkyl O–C–O; 110–142 ppm, aromatic C–C + /H; 142–165 ppm, aromatic C–O; 165–190 ppm, COO/N–C = O, and 190–220 ppm, ketones or aldehydes.
Extraction of DNA
Straw residues (0.1 g per sample) were homogenized under sterile conditions, and total DNA was extracted using a FastDNA SPIN kit (MP Biomedicals, Santa Ana, California, USA) following the procedure recommended by the manufacturer. The extracted DNA was dissolved in 50 mL TE buffer, quantified with a NanoDrop ND-1000 spectrophotometer (NanoDrop Technologies, Wilmington, Delaware, USA), and stored at −20 °C until required.
16S rRNA gene amplification for 454 sequencing
The amplification of 16S rRNA genes for 454 sequencing was performed as described elsewhere in detail44 and briefly as follows: an aliquot (50 ng) of purified DNA from each straw sample was used as a template for PCR amplification. The primer set F515 (5ʹ-GTGCCAGCMGCCGCGG-3ʹ) with the Roche 454 ‘A’ pyrosequencing adapter and R907 (5ʹ-CCGTCAATTCMTTTRAGTTT-3ʹ) with the Roche 454 ‘B’ sequencing adapter at the 5ʹ-end of each primer were used to amplify the V4-V5 region of the bacterial 16S rRNA genes. The targeted gene region is considered the most appropriate for accurate phylogenetic reconstruction of bacteria45. A unique 7-bp barcode sequence was inserted into the primers to distinguish the amplified products (Table S1). The reaction was performed using a total of 50 μL of each sample in triplicate under following conditions: 94 °C for 5 min; 30 cycles at 94 °C for 30 s, at 55 °C for 30 s, and at 72 °C for 30 s; and the final extension at 72 °C for 10 min. The products of the PCR were pooled and purified using an agarose gel DNA purification kit (TaKaRa Bio, Tokyo, Japan). Equal amounts of the PCR products of each sample were quantified by NanoDrop and combined in a single tube to be run on a Roche FLX 454 pyrosequencing machine (Roche Diagnostics Corporation, Branford, Connecticut, USA).
Analysis of the 454 pyrosequencing data
The pyrosequencing data were processed using the software package Quantitative Insights Into Microbial Ecology (QIIME) (ver. 1.8.0)46. Reads shorter than 200 bp or longer than 400 bp were discarded. Homopolymers longer than 6 bp were eliminated by PyroNoise47. Bacterial phylotypes were identified using UCLUST (Edgar, 2010), and high-quality sequences were clustered into OTUs with 97% similarity. The most abundant sequence for each OUT was selected as the representative sequence, which was aligned using PyNAST48. The taxonomic identity of each phylotype was determined using the ribosomal database project (RDP) Classifier49. To correct for survey effort, a randomly selected subset of 1050 sequences per sample was used for comparing the differences between samples. Finally, the OTUs were used in the LEfSe linear discriminant analysis (LDA) coupled with effect-size measurements to characterize the taxonomic guilds most distinctly responding to different temperatures.
Statistical analysis
Four metrics were used for assessing the bacterial alpha-diversity: phylogenetic diversity (PD)50, the Shannon index51, the Chao1 index52, and the observed OTU richness. A one-way ANOVA was used to test for significant differences (P < 0.05) across the treatments according to Tukey’s test and linear regression analyses were used for testing the relationships between the taxonomic diversity of a group and soil properties or the chemical properties of straw using SPSS ver. 17.0. Path analysis was used to evaluate the direct and indirect effects of pathways of responses relative to bacterial community composition using SPSS ver. 17.0. Mantel tests were used for identifying the factors that correlated significantly with community composition (abundance of OTUs) and were performed in the Vegan package of R ver. 2.8.1 (R Development Core Team. Vienna, Austria). Variance inflation factors (VIFs) were used for ascertaining whether the correlation between environmental factors and community composition was significant. Canonical correspondence analysis was performed with the VIFs, the value of which was less than 20. Non-metric multidimensional scaling was used for evaluating overall differences within the community composition based on pairwise Jaccard distances, and RDA was used for assessing the relationship between community composition and the chemical properties of straw. The analyses, namely CCA, CCA-based variation partitioning analysis (VPA), NMDS, and RDA, were completed using the Vegan package of R ver. 2.8.1.
Additional Information
How to cite this article: Zhou, G. et al. Effects of changes in straw chemical properties and alkaline soils on bacterial communities engaged in straw decomposition at different temperatures. Sci. Rep. 6, 22186; doi: 10.1038/srep22186 (2016).
Supplementary Material
Acknowledgments
We thank Ruibo Sun for assistance in analysing the 454 pyrosequencing data. This work was financially supported by the Strategic Pilot and Technology Special Funds of the Chinese Academy of Science (XDB15030302), Science and Technology Service Network Program of the Chinese Academy of Science (KFJ-EW-STS-055-4) and the National Natural Science Foundation of China (41471182), China Agriculture Research System-Wheat (CARS-03), National Basic Research Program (973 Program) of China (2014CB954500).
Footnotes
Author Contributions J.B.Z., G.X.Z. and X.L.X. designed the research; G.X.Z., L.C., Z.H.Y. and C.Z.Z. performed the experiments; G.X.Z. analyzed the data and wrote the paper; J.B.Z., Y.Z.F. and B.Z.Z. revised and edited the manuscript.
References
- Kimura M., Murase J. & Lu Y. Carbon cycling in rice field ecosystems in the context of input, decomposition and translocation of organic materials and the fates of their end products (CO2 and CH4). Soil Biol. Biochem. 36, 1399–1416 (2004). [Google Scholar]
- Lu Y., Watanabe A. & Kimura M. Input and distribution of photosynthesized carbon in a flooded rice soil. Global Biogeochem. Cy. 16, 32-1–32-8 (2002). [Google Scholar]
- Rui J., Peng J. & Lu Y. Succession of bacterial populations during plant residue decomposition in rice field soil. Appl. Environ. Microbiol. 75, 4879–4886 (2009). [DOI] [PMC free article] [PubMed] [Google Scholar]
- Cleveland C. C. et al. Litter quality versus soil microbial community controls over decomposition: a quantitative analysis. Oecologia 174, 283–294 (2014). [DOI] [PubMed] [Google Scholar]
- Kim M., Kim W. S., Tripathi B. M. & Adams J. Distinct bacterial communities dominate tropical and temperate zone leaf litter. Microbial. Ecol. 67, 837–848 (2014). [DOI] [PubMed] [Google Scholar]
- Neher D., Barbercheck M., El-Allaf S. & Anas O. Effects of disturbance and ecosystem on decomposition. Appl. Soil Ecol. 23, 165–179 (2003). [Google Scholar]
- Pankratov T. A., Ivanova A. O., Dedysh S. N. & Liesack W. Bacterial populations and environmental factors controlling cellulose degradation in an acidic Sphagnum peat. Environ. Microbiol. 13, 1800–1814 (2011). [DOI] [PubMed] [Google Scholar]
- Štursová M., Žifčáková L., Leigh M. B., Burgess R. & Baldrian P. Cellulose utilization in forest litter and soil: identification of bacterial and fungal decomposers. FEMS Microbiol. Ecol. 80, 735–746 (2012). [DOI] [PubMed] [Google Scholar]
- Šnajdr J. et al. Transformation of Quercus petraea litter: successive changes in litter chemistry are reflected in differential enzyme activity and changes in the microbial community composition. FEMS Microbiol. Ecol. 75, 291–303 (2011). [DOI] [PubMed] [Google Scholar]
- Rawat S. R., Männistö M. K., Bromberg Y. & Häggblom M. M. Comparative genomic and physiological analysis provides insights into the role of Acidobacteria in organic carbon utilization in Arctic tundra soils. FEMS Microbiol. Ecol. 82, 341–355 (2012). [DOI] [PubMed] [Google Scholar]
- Ward N. L. et al. Three genomes from the phylum Acidobacteria provide insight into the lifestyles of these microorganisms in soils. Appl. Environ. Microbiol. 75, 2046–2056 (2009). [DOI] [PMC free article] [PubMed] [Google Scholar]
- Bray S. R., Kitajima K. & Mack M. C. Temporal dynamics of microbial communities on decomposing leaf litter of 10 plant species in relation to decomposition rate. Soil Biol. Biochem. 49, 30–37 (2012). [Google Scholar]
- Yergeau E. et al. Shifts in soil microorganisms in response to warming are consistent across a range of Antarctic environments. ISME J. 6, 692–702 (2012). [DOI] [PMC free article] [PubMed] [Google Scholar]
- Xiong J. B. et al. Characterizing changes in soil bacterial community structure in response to short-term warming. FEMS Microbiol. Ecol. 89, 281–292 (2014). [DOI] [PubMed] [Google Scholar]
- Stark S., Männistö M. K., Ganzert L., Tiirola M. & Häggblom M. M. Grazing intensity in subarctic tundra affects the temperature adaptation of soil microbial communities. Soil Biol. Biochem. 84, 147–157 (2015). [Google Scholar]
- Wallenstein M. D. & Hall E. K. A trait-based framework for predicting when and where microbial adaptation to climate change will affect ecosystem functioning. Biogeochemistry 109, 35–47 (2012). [Google Scholar]
- Steinweg J. M., Dukes J. S., Paul E. A. & Wallenstein M. D. Microbial responses to multi-factor climate change: effects on soil enzymes. Front. Microbiol. 4, 146 (2013). [DOI] [PMC free article] [PubMed] [Google Scholar]
- Shen C. C. et al. Soil pH drives the spatial distribution of bacterial communities along elevation on Changbai Mountain. Soil Biol. Biochem. 57, 204–211 (2013). [Google Scholar]
- Yadav V. & Malanson G. Progress in soil organic matter research litter decomposition, modelling, monitoring and sequestration. Prog. Phys. Geog. 31, 131–154 (2007). [Google Scholar]
- Bastian F., Bouziri L., Nicolardot B. & Ranjard L. Impact of wheat straw decomposition on successional patterns of soil microbial community structure. Soil Biol. Biochem. 41, 262–275 (2009). [Google Scholar]
- Marschner P., Umar S. & Baumann K. The microbial community composition changes rapidly in the early stages of decomposition of wheat residue. Soil Biol. Biochem. 43, 445–451 (2011). [Google Scholar]
- Xiang X. J. et al. Rapid recovery of soil bacterial communities after wildfire in a Chinese boreal forest. Sci. Rep. 4, 3829 (2014). [DOI] [PMC free article] [PubMed] [Google Scholar]
- Flury S. & Gessner M. O. Experimentally simulated global warming and nitrogen enrichment effects on microbial litter decomposers in a marsh. Appl. Environ. Microbiol. 77, 803–809 (2011). [DOI] [PMC free article] [PubMed] [Google Scholar]
- Luo Y., Wan S., Hui D. & Wallace L. L. Acclimatization of soil respiration to warming in a tall grass prairie. Nature 413, 622–625 (2001). [DOI] [PubMed] [Google Scholar]
- Nemergut D. R., Cleveland C. C., Wieder W. R., Washenberger C. L. & Townsend A. R. Plot-scale manipulations of organic matter inputs to soils correlate with shifts in microbial community composition in a lowland tropical rain forest. Soil Biol. Biochem. 42, 2153–2160 (2010). [Google Scholar]
- Fierer N., Bradford M. A. & Jackson R. B. Toward an ecological classification of soil bacteria. Ecology 88, 1354–1364 (2007). [DOI] [PubMed] [Google Scholar]
- Dorrepaal E. et al. Carbon respiration from subsurface peat accelerated by climate warming in the subarctic. Nature 460, 616–619 (2009). [Google Scholar]
- Singh B. K., Bardgett R. D., Smith P. & Reay D. S. Microorganisms and climate change: terrestrial feedbacks and mitigation options. Nat. Rev. Microbiol. 8, 779–790 (2010). [DOI] [PubMed] [Google Scholar]
- Karhu K. et al. Temperature sensitivity of soil respiration rates enhanced by microbial community response. Nature 513, 81–84 (2014). [DOI] [PubMed] [Google Scholar]
- Kirschbaum M. U. Soil respiration under prolonged soil warming: are rate reductions caused by acclimation or substrate loss? Global Change Biol. 10, 1870–1877 (2004). [Google Scholar]
- Thomson B. C. et al. Vegetation affects the relative abundances of dominant soil bacterial taxa and soil respiration rates in an upland grassland soil. Microbial. Ecol. 59, 335–343 (2010). [DOI] [PubMed] [Google Scholar]
- Esperschutz J. et al. Dynamics of microbial communities during decomposition of litter from pioneering plants in initial soil ecosystems. Biogeosciences 10, 5115–5124 (2013). [Google Scholar]
- Baumann K., Marschner P., Smernik R. J. & Baldock J. A. Residue chemistry and microbial community structure during decomposition of eucalypt, wheat and vetch residues. Soil Biol. Biochem. 41, 1966–1975 (2009). [Google Scholar]
- Wang X. Y., Sun B., Mao J. D., Sui Y. Y. & Cao X. Y. Structural convergence of maize and wheat straw during two-year decomposition under different climate conditions. Environ. Sci. Technol. 46, 7159–7165 (2012). [DOI] [PubMed] [Google Scholar]
- Martínez A., Larrañaga A., Pérez J., Descals E. & Pozo J. Temperature affects leaf litter decomposition in low-order forest streams: field and microcosm approaches. FEMS Microbiol. Ecol. 87, 257–267 (2014). [DOI] [PubMed] [Google Scholar]
- Lu Y., Fu L., Lu Y. H., Hugenholtz F. & Ma K. Effect of temperature on the structure and activity of a methanogenic archaeal community during rice straw decomposition. Soil Biol. Biochem. 81, 17–27 (2015). [Google Scholar]
- Cao X. Y. et al. Solid-state NMR analysis of soil organic matter fractions from integrated physical-chemical extraction. Soil Sci. Soc. Am. J. 75, 1374–1384 (2011). [Google Scholar]
- Walkley A. & Black I. A. An examination of the Degtjareff method for determining soil organic matter, and a proposed modification of the chromic acid titration method. Soil Sci. 37, 29–38 (1934). [Google Scholar]
- Brookes P. C., Landman A., Pruden G. & Jenkinson D. Chloroform fumigation and the release of soil nitrogen: a rapid direct extraction method to measure microbial biomass nitrogen in soil. Soil Biol. Biochem. 17, 837–842 (1985). [Google Scholar]
- Jonasson S., Michelsen A., Schmidt I. K., Nielsen E. V. & Callaghan T. V. Microbial biomass C, N and P in two arctic soils and responses to addition of NPK fertilizer and sugar: implications for plant nutrient uptake. Oecologia 106, 507–515 (1996). [DOI] [PubMed] [Google Scholar]
- Novozamsky I., Houba V., Van Eck R. & Van Vark W. A novel digestion technique for multi‐element plant analysis. Commun. Soil Sci. Plan. 14, 239–248 (1983). [Google Scholar]
- Mao J. D. et al. Quantitative characterization of humic substances by solid-state carbon-13 nuclear magnetic resonance. Soil Sci. Soc. Am. J. 64, 873–884 (2000). [Google Scholar]
- Mao J. D., Olk D. C., Fang X. W., He Z. Q. & Schmidt-Rohr K. Influence of animal manure application on the chemical structures of soil organic matter as investigated by advanced solid-state NMR and FT-IR spectroscopy. Geoderma 146, 353–362 (2008). [Google Scholar]
- Sun R., Zhang X.-X., Guo X., Wang D. & Chu H. Bacterial diversity in soils subjected to long-term chemical fertilization can be more stably maintained with the addition of livestock manure than wheat straw. Soil Biol. Biochem. 88, 9–18 (2015). [Google Scholar]
- Biddle J. F., Fitz-Gibbon S., Schuster S. C., Brenchley J. E. & House C. H. Metagenomic signatures of the Peru Margin subseafloor biosphere show a genetically distinct environment. Proc. Natl. Acad. Sci. 105, 10583–10588 (2008). [DOI] [PMC free article] [PubMed] [Google Scholar]
- Caporaso J. G. et al. QIIME allows analysis of high-throughput community sequencing data. Nature method. 7, 335–336 (2010). [DOI] [PMC free article] [PubMed] [Google Scholar]
- Quince C., Lanzen A., Davenport R. J. & Turnbaugh P. J. Removing noise from pyrosequenced amplicons. BMC bioinformatics 12, 38 (2011). [DOI] [PMC free article] [PubMed] [Google Scholar]
- Caporaso J. G. et al. PyNAST: a flexible tool for aligning sequences to a template alignment. Bioinformatics 26, 266–267 (2010). [DOI] [PMC free article] [PubMed] [Google Scholar]
- Cole J. R. et al. The Ribosomal Database Project (RDP-II): sequences and tools for high-throughput rRNA analysis. Nucleic Acids Res. 33, D294–D296 (2005). [DOI] [PMC free article] [PubMed] [Google Scholar]
- Faith D. P. Conservation evaluation and phylogenetic diversity. Biol. Conserv. 61, 1–10 (1992). [Google Scholar]
- Hill T. C., Walsh K. A., Harris J. A. & Moffett B. F. Using ecological diversity measures with bacterial communities. FEMS Microbiol. Ecol. 43, 1–11 (2003). [DOI] [PubMed] [Google Scholar]
- Chao A. & Bunge J. Estimating the number of species in a stochastic abundance model. Biometrics 58, 531–539 (2002). [DOI] [PubMed] [Google Scholar]
Associated Data
This section collects any data citations, data availability statements, or supplementary materials included in this article.


