Abstract
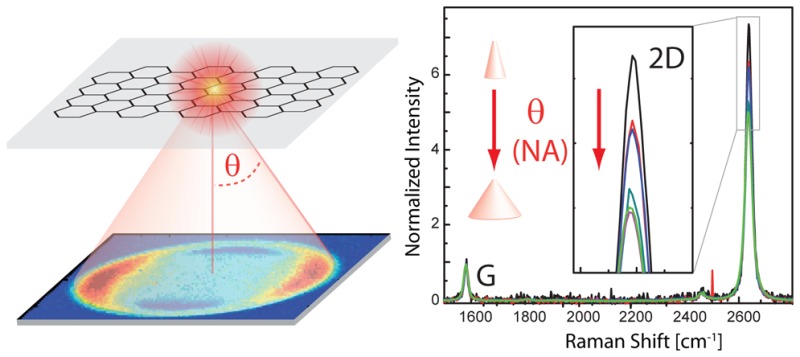
We report the angular distribution of the G and 2D Raman scattering from graphene on glass by detecting back focal plane patterns. The G Raman emission can be described by a superposition of two incoherent orthogonal point dipoles oriented in the graphene plane. Due to double resonant Raman scattering, the 2D emission can be represented by the sum of either three incoherent dipoles oriented 120° with respect to each other, or two orthogonal incoherent ones with a 3:1 weight ratio. Parameter-free calculations of the G and 2D intensities are in excellent agreement with the experimental radiation patterns. We show that the 2D polarization ratio and the 2D/G intensity ratio depend on the numerical aperture of the microscope objective. This is due to the depolarization of the emission and excitation light when graphene is on a dielectric substrate, as well as to tight focusing. The polarization contrast decreases substantially for increasing collection angle, due to polarization mixing caused by the air-dielectric interface. This also influences the intensity ratio I(2D)/I(G), a crucial quantity for estimating the doping in graphene. Our results are thus important for the quantitative analysis of the Raman intensities in confocal microscopy. In addition, they are relevant for understanding the influence of signal enhancing plasmonic antenna structures, which typically modify the sample’s radiation pattern.
Keywords: graphene, Raman scattering, radiation patterns
Graphene is a versatile building block for a variety of applications, ranging from nanophotonics to thin-film transistors and optoelectronics.1 Raman spectroscopy is one of the most used characterization techniques in carbon science and technology.2 The measurement of the Raman spectrum of graphene3 triggered a huge effort to understand phonons, electron–phonon, magneto-phonon, and electron–electron interactions in graphene, as well as the influence of the number and orientation of layers, electric or magnetic fields, strain, doping, disorder, quality and types of edges, and functional groups.4 The Raman spectrum of graphene and few layer graphene (FLG) consists of two fundamentally different sets of peaks. Those, such as D, G, 2D, present also in single layer graphene (SLG), and due to in-plane vibrations,2,5,6 and others, such as the shear (C) modes7 and the layer breathing modes (LBMs),8−11 due to relative motions of the planes themselves, either perpendicular or parallel to their normal.
The G peak corresponds to the high frequency E2g phonon at Γ. The D peak is due to the breathing modes of six-atom rings and requires a defect for its activation.5,12−14 It comes from TO phonons around the Brillouin Zone (BZ) edge K,5,12,13 is active by double resonance (DR),14,15 and is strongly dispersive with excitation energy due to a Kohn Anomaly (KA) at K.16 DR can also happen as intravalley process, that is, connecting two points belonging to the same cone around K (or K′). This gives the so-called D′ peak. The 2D peak is the D peak overtone. The 2D′ peak is the D′ overtone. Since 2D and 2D′ originate from a process where momentum conservation is satisfied by two phonons with opposite wavevectors, no defects are required for their activation, and are thus always present.3,17 Note that, albeit being an in-plane mode, the 2D peak is sensitive to the number of layers (N) since the resonant Raman mechanism that gives rise to it is closely linked to the details of the band structure,3,4,6 the latter changing with N, and the layers relative orientation.18 On the other hand, the C and LBMs are a direct probe of N, since the vibrations themselves are out of plane, thus directly sensitive to N.10,11
While most papers in literature deal with the spectrum of Raman scattered light, its angular distribution has not been considered thus far, to the best of our knowledge. However, the angular distribution of the emission carries important information on the nature of the emissive state, such as its dipolar19 or multipolar20 character, its polarization state,21,22 its coupling to the environment,19,22 and its spatial coherence length.23 In the case of antenna- or tip-enhanced near-field optical microscopy,24−26 the radiation pattern can be used to observe the antenna effect and its directivity.24,27,28 From a practical perspective, the angular distribution of emission determines the detection yield (ratio of detected to emitted light) achieved in an optical measurement, thus being crucial for the quantitative analysis of the observed emission intensities and polarization.
Here, we report the angular distribution of Raman scattering from SLG on glass. This is detected in the back focal plane (BFP) of the collecting microscope objective, giving rise to characteristic BFP patterns. Comparison with analytical calculations shows that the G emission can be represented by the sum of two incoherent orthogonal point dipoles. The 2D band can be described by two mathematically equivalent models. It can be represented as a sum of two incoherent orthogonal point dipoles, with a 3:1 weighting ratio, as expected from polarized Raman scattering.29,30 Alternatively, it can be described as the sum of three incoherent dipoles rotated in-plane by 120° with respect to each other, reflecting the threefold symmetry of the DR around K and K′.29−31 The BFP data also show that the 2D polarization ratio depends on the numerical aperture (NA) of the microscope objective, which also influences the 2D/G intensity ratio for polarized detection. Our results are thus important for the quantitative analysis of the Raman intensities in confocal microscopy.
Results and Discussion
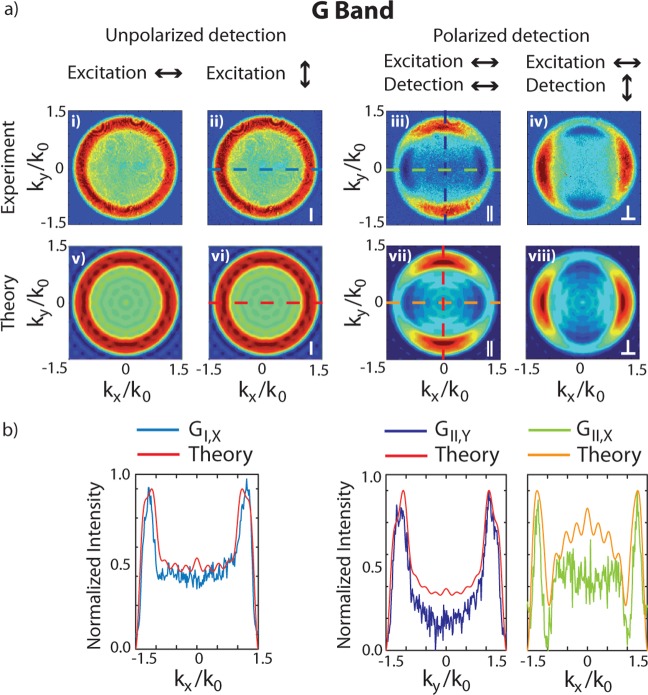
Figure 1 shows a collection of experimental (Figure 1a, i–iv) and calculated (Figure 1a, v–viii) BFP images of the G peak, with and without analyzer in the detection beam path. All patterns are recorded for two orthogonal directions of the excitation polarization. Due to the SLG symmetry properties, this should lead to the same results, as discussed below, thus helping to exclude possible imaging artifacts.
Figure 1.
(a) Experimental and calculated G peak BFP images with and without analyzer. The same scaling is used in each row for the experimental and theoretical data. (b) Cross sections taken through the center of the experimental and calculated BFP patterns in (a). The arrows indicate the direction of polarization.
Without analyzer in the detection beam path, the pattern features a ring of uniform intensity (Figure 1a,i). As a test, the excitation polarization is rotated by 90°, leading to an identical pattern (Figure 1a,ii). The strongest emission is seen for kx2/k02 + ky2/k02 ≥ 1, corresponding to angles exceeding the critical angle of the glass-air interface θcrit = arcsin(nair/nglass), giving NA = nglass sin θcrit = 1. This is expected due to the increased photon density of states in this angular range and the connected enhancement of spontaneous emission.32
For polarized detection, two bright lobes in the direction orthogonal to the detection polarization are seen (Figure 1a,iii). Rotating the analyzer by 90° rotates the resulting pattern, retaining its intensity (Figure 1a,iv). Because the same intensity is seen for parallel and perpendicular detection polarization, we infer that the G band emission is isotropically polarized, consistent with previous reports.29
The comparison between the G peak experimental BFP patterns with analyzer in Figure 1a,iii and iv with the calculated pattern of a point-dipole in Figure 6c indicates that the G Raman scattering in SLG can be modeled by the superposition of two incoherent and orthogonal in-plane point dipoles. This is confirmed by the corresponding series of parameter-free calculated patterns for the respective excitation and detection conditions, presented in the lower row of Figure 1a,v–viii. The quantitative agreement between experimental and theoretical emission distribution can also be seen from the comparison of the corresponding cross sections in Figure 1b.
Figure 6.
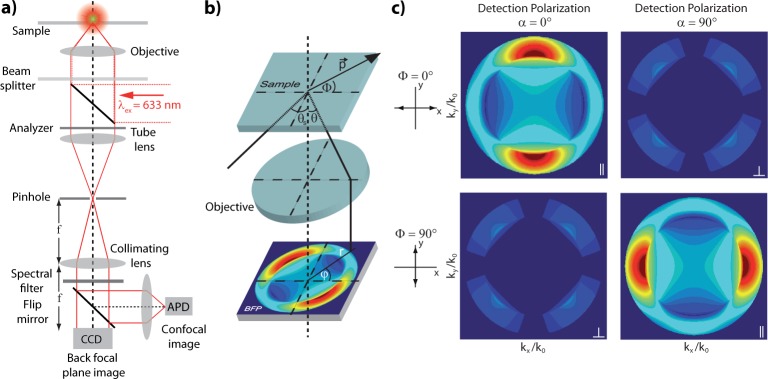
(a) Confocal real space imaging and BFP imaging setup. (b) Scheme illustrating the BFP radiation pattern created by a point-dipole emitter. p⃗, dipole moment; Φ, orientation angle of dipole axis in sample plane; θ, emission angle; θs, incident angle complementary to θ; ϕ, azimuthal angle in back aperture; r, radial distance from optical axis.19 (c) Calculated BFP patterns of an in-plane point dipole on an air–glass interface oriented with Φ = 0° recorded for parallel (Φ = 0°, α = 0° and Φ = 90°, α = 90°) and crossed polarization (Φ = 0°, α = 90° and Φ = 90°, α = 0°), with α the orientation of the analyzer transmission (detection polarization). The emission detected for cross-polarization is due to polarization mixing caused by the air–glass interface.
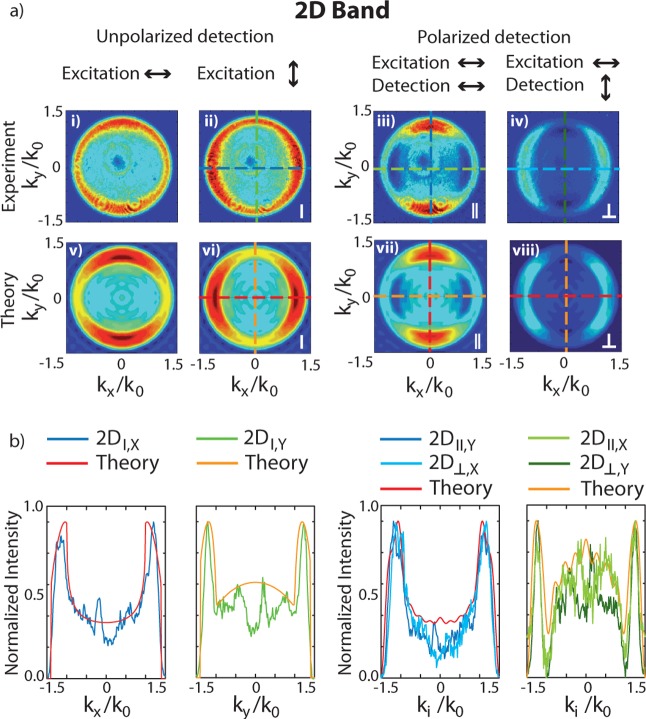
Figure 2a plots the BFP patterns of the 2D band. Unlike those of the G band, they do not exhibit radial symmetry, indicating polarized Raman scattering. The patterns recorded for polarized detection (Figure 2a,iii and iv) also resemble a superposition of two orthogonal dipoles, although with weaker intensity for the cross-polarized case (Figure 2a,iv). The ratio of parallel to cross-polarized 2D intensities r2D = I(2D)∥/I(2D)⊥ was previously reported to be ∼3.29,33 We thus calculate the BFP patterns in Figure 2a,v–viii as the incoherent sum of two orthogonal dipoles with r2D = 3. Both patterns and corresponding cross sections (Figure 2b) are in good agreement with experiments.
Figure 2.
(a) Experimental and calculated 2D BFP images with and without analyzer. The same scaling is used in each row for the experimental and theoretical data. (b) Cross sections taken through the center of the experimental and calculated BFP patterns in (a).
On the other hand, due to the threefold symmetry of the DR Raman process around K and K′, the 2D emission can also be considered to result from three dipoles each rotated in-plane by 120°, as discussed below. For linearly polarized light, the excitation efficiency of the three dipoles scales with the angle δ between the incident field E⃗ and the dipole axis p⃗ as |p⃗·E⃗|2 ∼ cos2 (δ). Without loss of generality, we consider one dipole to be parallel to the laser polarization, and the other two rotated by 120° and 240°, thus excited with a lower efficiency of cos2(120°) = cos2(240°) = 1/4. The BFP patterns calculated with three dipoles weighted 1:1/4:1/4 are in good agreement with the experimental patterns as well as with results obtained by the 2-dipole model.
Using group theory, the G Raman intensity can be calculated as4,29,34,35
| 1 |
where R1 and R2 are the double degenerate E2g Raman polarizability tensors:
| 2 |
and êL and êS are the unit vectors of polarization of incident and scattered light at the focus of the microscope objective.
Equation 1 can also be understood as the sum of two orthogonal incoherent dipoles. The dot products Ri·êS in eq 1 correspond to the oscillation direction of the two orthogonal point dipoles, while the sum of the modulus square accounts for an incoherent superposition. For NA > 1 and for samples on an air–dielectric interface, the polarization directions entering in eq 1 do not correspond to the polarization directions outside the focus, as noted above (see also Figure 6c). Due to its symmetry properties with |R1·êx| = |R2·êy|, the effect of polarization mixing cancels out in the case of the G peak, but not for 2D. This polarization mixing, that becomes visible for nglass sin θ = NA > 1, thus influences the experimentally observed r2D as we will see in the following.
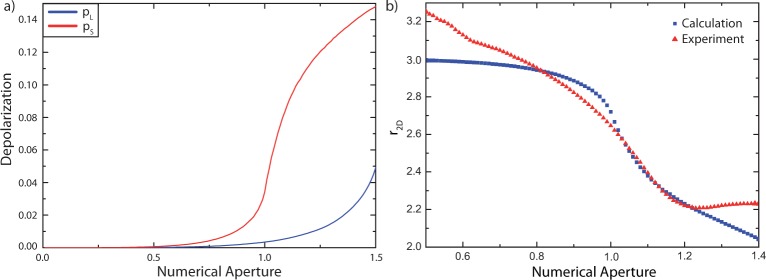
Depolarization occurs for both excitation and emission light. For excitation, it can be quantified by the ratio pL between the intensity component perpendicular to the polarization of a strongly focused linearly polarized Gaussian laser beam I(L)⊥ and the parallel one I(L)∥ as pL = I(L)⊥/ I(L)∥. This NA-dependent ratio can be calculated by integrating over the electric fields at the glass–air interface in the focus of the microscope objective up to the given NA.32,36 For emission, depolarization can be quantified by the ratio pS between the detected intensity for parallel I(S)∥ and perpendicular I(S)⊥ polarization with respect to the emitting dipole (see also Figure 6c). These intensities can be calculated by integrating the corresponding BFP patterns over an increasing angular range.19 Both NA-dependent effects are illustrated in Figure 3a, which shows that they become relevant for NA > 1. Depolarization has a larger influence on the emission than on the excitation light. With this information, eq 1 can be reformulated into a more general expression for both G and 2D:
| 3 |
with i = 1,2 and i = 1–3 in the case of G and 2D, respectively, and j,k = ∥,⊥.
Figure 3.
(a) Depolarization of excitation pL and emission pS at the glass–air interface as a function of the focusing angle θ expressed by NA = n sin θ. (b) Experimental and calculated 2D intensity ratio for parallel and perpendicular polarized light r2D = I(2D)∥/I(2D)⊥. The curve is a plot of eq 6.
The depolarization matrices are developed considering the depolarization of the excitation and emission pL and pS (see Figure 3a):
 |
4 |
with pS = I(S)⊥/I(S)∥ and pL = I(L)⊥/I(L)∥. For NA < 1 the influence of the depolarization matrices can be neglected and eq 3 simplifies to eq 1. We note that the Raman polarization tensor of the totally symmetric 2D phonons does not result in the polarization contrast ∼3 of refs.29,35 This derives from the DR process14,15 and the interplay of photon–electron and electron–phonon coupling.5,12−14 We need to consider intervalley scattering between K and K′ with six possible K–K′ and K′–K combinations.29 Due to symmetry, we can limit the discussion to three K–K′ combinations.29 DR intervalley scattering results in distinct electronic populations around the three different K′ points neighboring the K point, each rotated by 120°.29 We thus describe the 2D band as a sum of three incoherent dipoles corresponding to the following three Raman tensors that directly reflect the symmetries of the electronic populations caused by double resonant Raman scattering:
| 5 |
Tensors R2 and R3 are obtained
via rotation of R1 by 120° and 240°,
correcting the excitation
efficiency of the dipoles by the scaling ratio 1: = 1:
= 1: . As a result, the 2D
intensity depends
on polarization, and is thus influenced by the depolarization of excitation
and emission, unlike the G peak. Because depolarization depends on
NA, r2D becomes NA-dependent as well.
Using eqs 3–5, we obtain
| 6 |
Figure 3b compares the ratio obtained from eq 6 with the experimental ones for increasing NA. Both experimental and theoretical data show a substantial decrease of ∼30% towards larger NA. Deviations of the experimental data from the predicted curve are presumably due to the background correction for laser scattered light for small collection angles and reduced objective transmittance for large ones (see below Figure 5).22,37,38
Figure 5.
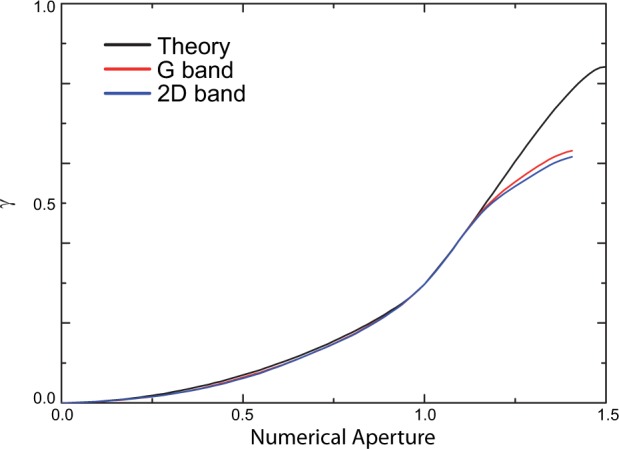
Experimental and calculated fraction of detected light as a function of NA. The experimental curves are normalized to the theoretical value at NA = 1.
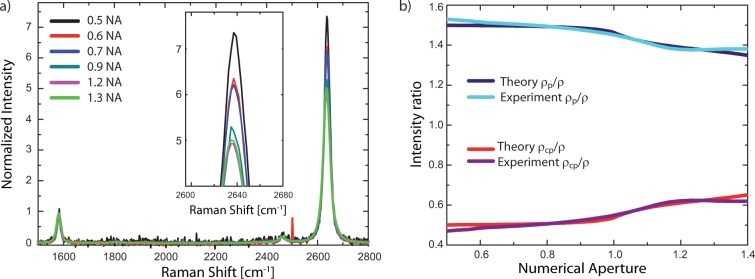
The intensity ratio I(2D)/I(G) is crucial to derive the doping of SLG.4,39−41 Doping also influences the defects determination via I(D)/I(G).42 Polarization mixing caused by the air-glass interface with different effects on I(2D) and I(G) would thus change I(2D)/I(G). The NA dependence of I(2D)/I(G) is illustrated in Figure 4a. We can express I(2D)/I(G) using the NA-dependent r2D:
| 7 |
| 8 |
| 9 |
| 10 |
| 11 |
with ρ being the unpolarized ratio and ρp (ρcp) the polarized ratio for parallel (perpendicular) polarization, where the analyzer is parallel (perpendicular) to the excitation polarization. For ρp, the ratio is larger than for nonpolarized detection because the G peak is isotropic and the 2D peak is partly polarized along the polarization of the excitation laser. Whereas for ρcp the ratio is smaller than for nonpolarized detection (see also Figure 4b). The slightly higher 2D signal for NA = 1.3 compared to that for NA = 1.2 in Figure 4a is consistent with the ratio determined from the experimental BFP patterns r2D, that is seen to slowly increase for NA > 1.2 (Figure 3b).
Figure 4.
(a)
Parallel polarized SLG Raman Spectra as a function of NA. All
spectra are normalized to I(G). (b) NA dependence
of I(2D)/I(G) with  ,
,  , and
, and  as defined
in the text.
Using the representation of SLG Raman emission as the sum of two incoherent dipoles we can now calculate the fraction of light detected in an experiment, γ (see Figure 5). This depends on the collection angle:24
| 12 |
where Ptotal is the total emitted power distributed over the upper halfspace, Puhs, and the lower halfspace, Plhs. In our configuration, the upper halfspace is air and the lower is the glass substrate. γ(NA), measured by collecting the light through the glass using an index matched objective, can be calculated by integrating the theoretical BFP patterns from 0 to NA, followed by normalization of the patterns integrated over 4π (Figure 5). Integration of the experimental G and 2D BFP patterns results in very similar NA dependencies up to NA = 1.2. In Figure 5, the experimental curves are normalized to the theoretical value at NA = 1, accounting for the known lower transmission of the marginal rays for larger NA.22,37,38
The radiation patterns presented above together with the NA dependent detection yield for SLG on glass shown in Figure 5, provide a complete quantitative description of the polarized Raman signals detected in a microscope configuration. In addition, this description will also be important for the discussion of the signal enhancement provided by plasmonic nanostructures placed in the vicinity of SLG. Because plasmonic nanostructures act as optical antennas and are typically connected to an angular redistribution of emission, quantification of the achieved Raman enhancement requires the exact knowledge of the spatial distribution of emission and of the NA dependent fraction of detected light.20,24−26
Because the excitation field is coherent within the focal area, the modulus square in eq 6 would need to include the spatial integral of the induced Raman polarization in case of fully coherent scattering. In general, spatially coherent Raman scattering could influence the observed far-field radiation patterns if the coherence length is ∼λ/4, in which case retardation effects start playing a role.34,35 Since all our experimentally recorded BFP patterns can be quantitatively described using point dipoles located at the same position, the coherence length is expected to be substantially smaller.34,35 Reference (35) reported that spatially coherent Raman scattering influences the near-field optical response with coherence length ∼30 nm. Since this length is <λ/4, our treatment of SLG Raman scattering as spatially incoherent is justified.
Finally, we address the expected effect of depolarization on the D peak. In case of pointlike defects, the D band Raman scattering will behave similarly to the 2D one, because it has nearly the same directional preference for electron–phonon interaction as that of the intervalley resonant Raman process of the 2D band.49,50 We thus expect I(D)/I(G) to have the same depolarization as I(2D)/I(G) for a given NA. For linearly extended defects that are localized in one dimension of the momentum space, such as edges, polarized Raman scattering can be observed.28,43,44 In this case, the D peak intervalley process can occur for armchair edges only when the incident polarization is parallel to the edge. As a result, polarized Raman scattering will occur with an expected contrast of 100%, for perfect edges.44 Here, both depolarization of excitation and emission would reduce the observed contrast, in case of high NA. As an estimate we can use the sum of the two effects shown in Figure 3, deriving a maximum polarization contrast of about (100 – 13 – 2) % = 85% for NA = 1.4, for perfect edges.
Conclusions
We investigated the angular distribution of the G and 2D Raman scattering from graphene on glass by detecting back focal plane patterns. The G Raman emission can be described by a superposition of two incoherent orthogonal point dipoles oriented in the graphene plane. Due to double resonant Raman scattering, the 2D emission can be represented by the sum of either three incoherent dipoles oriented 120° with respect to each other, or two orthogonal incoherent ones with a 3:1 weight ratio. While the G scattering is confirmed to be nonpolarized, we observe polarized scattering in case of the 2D band. The polarization contrast decreases substantially for increasing collection angle, due to polarization mixing caused by the air-dielectric interface. This also influences I(2D)/I(G), a crucial quantity for estimating the doping in graphene. We expect our treatment of the depolarization and the corresponding expression derived for calculating the polarized Raman scattering intensities in eq 4 to be applicable to a wide range of samples including other layered materials, nanotubes, or nanowires. Our results are thus important for the quantitative analysis of the Raman intensities in confocal microscopy with high numerical aperture.
Methods
Sample Preparation
Graphene layers are deposited by micromechanical cleavage45 on Si wafers covered with 300 nm of SiO2. SLGs are identified by a combination of optical microscopy46 and Raman spectroscopy [Renishaw inVia at 514, 633 nm].3,4 SLGs are transferred onto glass by a polymer-based wet transfer process.47 PMMA (molecular weight 950 K) is spin coated onto the substrate where graphite flakes are exfoliated, then the sample is immersed in deionized water, resulting in the detachment of the polymer film due to water intercalation at the PMMA–SiO2 interface.47,48 The flakes attach to the polymer and can be removed from the Si/SiO2 substrate. The polymer+graphene film is then placed onto the glass substrate and, after complete drying of the water, PMMA is removed by acetone. Success of the transfer is confirmed both optically and by Raman spectroscopy. No significant D peak is detected after transfer, showing that the process does not result in structural defects.
Microscope Setup
The experimental setup for real space and back focal plane (BFP) imaging is shown in Figure 6a. Laser excitation at 633 nm is provided by a linearly polarized HeNe laser. A 60× oil immersion objective with NA = 1.4 is used to focus the laser beam onto the sample and to collect the emitted light in backscattering geometry. Narrow band-pass filters (10 nm spectral window) centered at 700 and 760 nm are used to spectrally select the G and 2D signals, respectively. The transmitted Raman signal is then detected by an avalanche photodiode (APD). All polarized intensity data are also corrected for the polarization sensitive transmission of the beam splitter and the other optical elements in the beam path. A charged coupled device (CCD) camera is positioned in the focus of the collimating lens in the detection beam path. A flip mirror allows switching between real space and BFP imaging.
Back Focal Plane Imaging
BFP imaging is a Fourier technique providing data in reciprocal space (Figure 6b). The BFP patterns are scaled by the normalized wavevector components kx/k0 and ky/k0 where k0 = 2π/λ. The area of signal detection is limited by NA as kx2/k02 + ky2/k02 ≤ NA2 = 1.42.
A confocal pinhole with 300 μm diameter is placed on the focus of the tube lens (ft = 200 mm) in order to suppress background light generated out of focus originating from inelastic scattering in the glass substrate, the immersion oil and the microscope objective. Since such a pinhole restricts the detected real space area, it is connected to a broadening in Fourier space. Specifically, multiplication by a circular aperture function in real space with radius raperture will translate into convolution of the signal intensity by [sin(kraperture)/kraperture]2 in k-space, leading to a broadening of the patterns and reduced resolution. As a compromise, a large pinhole with 300 μm diameter is used, substantially exceeding the Airy disk diameter =1.221λ/NA = 36.6 μm at the 700 nm Raman emission wavelength (39.7 μm at 760 nm). All calculated BFP patterns are convoluted with the corresponding function to consider the effect of the confocal pinhole.
The intensity distributions I(kx/k0,ky/k0) in the back focal plane are calculated using the p- and s-polarized components of the electric fields radiated by a point dipole p⃗ on the air-glass interface, depending on its in-plane orientation Φ, the azimuthal and polar emission angles θ and ϕ, and the distance from the center r (see Figure 6b):19
| 13 |
The emission pattern of a point-dipole oriented in the sample plane has a distinct form (Figure 6c). On the borders of the circle, the pattern has two half-moon shaped maxima on opposite sides.19 The line connecting the maxima is perpendicular to the real space orientation of the radiating dipole p⃗. Therefore, the orientation of the dipole can be determined from the orientation of the two maxima.19 The emission detected for cross-polarization (analyzer transmission for α = 90° with dipole orientation Φ = 0°) is due to polarization mixing caused by the air-glass interface (Figure 6c).32
The corresponding depolarization effect occurs also for the excitation polarization. Tight focusing (θ > θcrit) of a linearly polarized laser beam at an air–dielectric interface generates substantial intensity contributions in the two directions perpendicular to the polarization of the unfocused laser light.32 Polarization mixing of both excitation and emission light is considered in the calculations of the BFP pattern and of the resulting polarization and intensity ratios.
Acknowledgments
We acknowledge funding from ERC grants NEWNANOSPEC and Hetero2D, the Deutsche Forschungsgemeinschaft (DFG) through the Nanosystems Initiative Munich (NIM), the EU Graphene Flagship (no. 604391), EPSRC Grants EP/K01711X/1, EP/K017144/1, a Royal Society Wolfson Research Merit Award.
The authors declare no competing financial interest.
References
- Ferrari A. C.; Bonaccorso F.; Fal’ko V.; Novoselov K. S.; Roche S.; Bøggild P.; Borini S.; Koppens F. H. L.; Palermo V.; Pugno N.; et al. Science and Technology Roadmap for Graphene, Related Two-Dimensional Crystals, and Hybrid Systems. Nanoscale 2015, 7, 4598–4810. 10.1039/C4NR01600A. [DOI] [PubMed] [Google Scholar]
- Ferrari A. C.; Robertson J. Raman Spectroscopy of Amorphous, Nanostructured, Diamond-Like Carbon, and Nanodiamond. Philos. Trans. R. Soc., A 2004, 362, 2477–2512. 10.1098/rsta.2004.1452. [DOI] [PubMed] [Google Scholar]
- Ferrari A. C.; Meyer J. C.; Scardaci V.; Casiraghi C.; Lazzeri M.; Mauri F.; Piscanec S.; Jiang D.; Novoselov K. S.; Roth S.; Geim A. K. Raman Spectrum of Graphene and Graphene Layers. Phys. Rev. Lett. 2006, 97, 187401. 10.1103/PhysRevLett.97.187401. [DOI] [PubMed] [Google Scholar]
- Ferrari A. C.; Basko D. M. Raman Spectroscopy as a Versatile Tool for Studying the Properties of Graphene. Nat. Nanotechnol. 2013, 8, 235–246. 10.1038/nnano.2013.46. [DOI] [PubMed] [Google Scholar]
- Tuinstra F.; Koenig J. L. Raman Spectrum of Graphite. J. Chem. Phys. 1970, 53, 1126–1130. 10.1063/1.1674108. [DOI] [Google Scholar]
- Ferrari A. C. Raman Spectroscopy of Graphene and Graphite: Disorder, Electron-Phonon Coupling, Doping and Nonadiabatic Effects. Solid State Commun. 2007, 143, 47–57. 10.1016/j.ssc.2007.03.052. [DOI] [Google Scholar]
- Tan P. H.; Han W. P.; Zhao W. J.; Wu Z. H.; Chang K.; Wang H.; Wang Y. F.; Bonini N.; Marzari N.; Pugno N.; Savini G.; Lombardo A.; Ferrari A. C. The Shear Mode of Multilayer Graphene. Nat. Mater. 2012, 11, 294–300. 10.1038/nmat3245. [DOI] [PubMed] [Google Scholar]
- Lui C. H.; Malard L. M.; Kim S.; Lantz G.; Laverge F. E.; Saito R.; Heinz T. F. Observation of Layer-Breathing Mode Vibrations in Few-Layer Graphene through Combination Raman Scattering. Nano Lett. 2012, 12, 5539–5544. 10.1021/nl302450s. [DOI] [PubMed] [Google Scholar]
- Sato K.; Park J. S.; Saito R.; Cong C.; Yu T.; Lui C. H.; Heinz T. F.; Dresselhaus G.; Dresselhaus M. S. Raman Spectra of Out-Of-Plane Phonons in Bilayer Graphene. Phys. Rev. B: Condens. Matter Mater. Phys. 2011, 84, 035419. 10.1103/PhysRevB.84.035419. [DOI] [Google Scholar]
- Wu J.-B.; Hu Z.-X.; Zhang X.; Han W.-P.; Lu Y.; Shi W.; Qiao X.-F.; Ijias M.; Milana S.; Ji W.; Ferrari A. C.; Tan P. H. Interface Coupling in Twisted Multilayer Graphene by Resonant Raman Spectroscopy of Layer Breathing Modes. ACS Nano 2015, 9, 7440–7450. 10.1021/acsnano.5b02502. [DOI] [PubMed] [Google Scholar]
- Wu J.-B.; Zhang X.; Ijäs M.; Han W.-P.; Qiao X.-F.; Li X.-L.; Jiang D.-S.; Ferrari A. C.; Tan P. H. Resonant Raman Spectroscopy of Twisted Multilayer Graphene. Nat. Commun. 2014, 5, 5309–5317. 10.1038/ncomms6309. [DOI] [PubMed] [Google Scholar]
- Ferrari A. C.; Robertson J. Interpretation of Raman Spectra of Disordered and Amorphous Carbon. Phys. Rev. B: Condens. Matter Mater. Phys. 2000, 61, 14095–14107. 10.1103/PhysRevB.61.14095. [DOI] [Google Scholar]
- Ferrari A. C.; Robertson J. Resonant Raman Spectroscopy of Disordered, Amorphous, and Diamondlike Carbon. Phys. Rev. B: Condens. Matter Mater. Phys. 2001, 64, 075414. 10.1103/PhysRevB.64.075414. [DOI] [Google Scholar]
- Thomsen C.; Reich S. Double Resonant Raman Scattering in Graphite. Phys. Rev. Lett. 2000, 85, 5214–5217. 10.1103/PhysRevLett.85.5214. [DOI] [PubMed] [Google Scholar]
- Baranov A. V.; Bekhterev A. N.; Bobovich Y. S.; Petrov V. I. Interpretation of Certain Characteristics in Raman Spectra of Graphite and Glassy Carbon. Opt. Spektrosc. 1987, 62, 612. [Google Scholar]
- Piscanec S.; Lazzeri M.; Mauri F.; Ferrari A. C.; Robertson J. Kohn Anomalies and Electron-Phonon Interactions in Graphite. Phys. Rev. Lett. 2004, 93, 185503. 10.1103/PhysRevLett.93.185503. [DOI] [PubMed] [Google Scholar]
- Basko D. M.; Piscanec S.; Ferrari A. C. Electron-Electron Interactions and Doping Dependence of the Two-Phonon Raman Intensity in Graphene. Phys. Rev. B: Condens. Matter Mater. Phys. 2009, 80, 165413. 10.1103/PhysRevB.80.165413. [DOI] [Google Scholar]
- Latil S.; Meunier V.; Henrard L. Massless Fermions in Multilayer Graphitic Systems with Misoriented Layers: Ab Initio Calculations and Experimental Fingerprints. Phys. Rev. B: Condens. Matter Mater. Phys. 2007, 76, 201402. 10.1103/PhysRevB.76.201402. [DOI] [Google Scholar]
- Lieb M. A.; Zavislan J. M.; Novotny L. J. Single-Molecule Orientations Determined by Direct Emission Pattern Imaging. J. Opt. Soc. Am. B 2004, 21, 1210–1215. 10.1364/JOSAB.21.001210. [DOI] [Google Scholar]
- Curto A. G.; Taminiau T. H.; Volpe G.; Kreuzer M. P.; Quidant R.; van Hulst N. F. Multipolar Radiation of Quantum Emitters with Nanowire Optical Antennas. Nat. Commun. 2013, 4, 1750–1757. 10.1038/ncomms2769. [DOI] [PMC free article] [PubMed] [Google Scholar]
- Hecht B.; Bielefeldt H.; Novotny L.; Inouye Y.; Pohl D. W. Local Excitation Scattering, and Interference of Surface Plasmons. Phys. Rev. Lett. 1996, 77, 1889–1892. 10.1103/PhysRevLett.77.1889. [DOI] [PubMed] [Google Scholar]
- Hartmann N.; Piredda G.; Berthelot J.; Colas des Francs G.; Hartschuh A.; Bouhelier A. Launching Propagating Surface Plasmon Polaritons by a Single Carbon Nanotube Dipolar Emitter. Nano Lett. 2012, 12, 177–181. 10.1021/nl203270b. [DOI] [PubMed] [Google Scholar]
- Volkmer A.; Cheng J.-X.; Xie X. S. Vibrational Imaging with High Sensitivity via Epidetected Coherent Anti-Stokes Raman Scattering Microscopy. Phys. Rev. Lett. 2001, 87, 023901. 10.1103/PhysRevLett.87.023901. [DOI] [Google Scholar]
- Böhmler M.; Hartmann N.; Georgi C.; Hennrich F.; Green A.; Hersam M.; Hartschuh A. Enhancing and Redirecting Carbon Nanotube Photoluminescence by an Optical Antenna. Opt. Express 2010, 18, 16443–16451. 10.1364/OE.18.016443. [DOI] [PubMed] [Google Scholar]
- Taminiau T. H.; Stefani F. D.; van Hulst N. F. Optical Antennas Direct Single-Molecule Emission. Nat. Photonics 2008, 2, 234–237. 10.1038/nphoton.2008.32. [DOI] [Google Scholar]
- Kühn S.; Mori G.; Agio M.; Sandoghdar V. Modification of Single Molecule Fluorescence Close to a Nanostructure: Radiation Pattern, Spontaneous Emission and Quenching. Mol. Phys. 2008, 106, 893–941. 10.1080/00268970802002510. [DOI] [Google Scholar]
- Su W.; Roy D. Visualizing Graphene Edges Using Tip-Enhanced Raman Spectroscopy. J. Vac. Sci. Technol. B 2013, 31, 041808. 10.1116/1.4813848. [DOI] [Google Scholar]
- Beams R.; Cançado L. G.; Novotny L. Raman Characterization of Defects and Dopants in Graphene. J. Phys.: Condens. Matter 2015, 27, 083002. 10.1088/0953-8984/27/8/083002. [DOI] [PubMed] [Google Scholar]
- Yoon D.; Moon H.; Son Y.-W.; Samsonidze G.; Park B. H.; Kim J. B.; Lee Y.; Cheong H. Strong Polarization Dependence of Double-Resonant Raman Intensities in Graphene. Nano Lett. 2008, 8, 4270–4274. 10.1021/nl8017498. [DOI] [PubMed] [Google Scholar]
- Sahoo S.; Palai R.; Katiyar R. S. Polarized Raman Scattering in Monolayer, Bilayer, and Suspended Bilayer Graphene. J. Appl. Phys. 2011, 110, 044320. 10.1063/1.3627154. [DOI] [Google Scholar]
- Yoon D.; Son Y.-W.; Cheong H. Strain-Dependent Splitting of the Double-Resonance Raman Scattering Band in Graphene. Phys. Rev. Lett. 2011, 106, 155502. 10.1103/PhysRevLett.106.155502. [DOI] [PubMed] [Google Scholar]
- Novotny L.; Hecht B.. Principles of Nano-Optics, 1st ed.; Cambridge University Press, Cambridge, 2008. [Google Scholar]
- Popov V. N.; Lambin P. Theoretical Polarization Dependence of the Two-Phonon Double-Resonant Raman Spectra of Graphene. Eur. Phys. J. B 2012, 85, 418–438. 10.1140/epjb/e2012-30684-x. [DOI] [Google Scholar]
- Maximiano R. V.; Beams R.; Novotny L.; Jorio A.; Cançado L. G. Mechanism of Near-Field Raman Enhancement in Two-Dimensional Systems. Phys. Rev. B: Condens. Matter Mater. Phys. 2012, 85, 235434. 10.1103/PhysRevB.85.235434. [DOI] [Google Scholar]
- Cançado L. G.; Beams R.; Jorio A.; Novotny L. Theory of Spatial Coherence in Near-Field Raman Scattering. Phys. Rev. X 2014, 4, 031054. 10.1103/PhysRevX.4.031054. [DOI] [PubMed] [Google Scholar]
- Novotny L.; Beversluis M. R.; Youngworth K. S.; Brown T. G. Longitudinal Field Modes Probed by Single Molecules. Phys. Rev. Lett. 2001, 86, 5251–5254. 10.1103/PhysRevLett.86.5251. [DOI] [PubMed] [Google Scholar]
- Wilson T.; Juskaitis R. The Axial Response of Confocal Microscopes with High Numerical Aperture Objective Lenses. Bioimaging 1995, 3, 35–38. . [DOI] [Google Scholar]
- Tang W. T.; Chung E.; Kim Y.-H.; So P. T. C.; Sheppard C. J. R. Investigation of the Point Spread Function of Surface Plasmon-Coupled Emission Microscopy. Opt. Express 2007, 15, 4634–4646. 10.1364/OE.15.004634. [DOI] [PubMed] [Google Scholar]
- Das A.; Pisana S.; Chakraborty B.; Piscanec S.; Saha S. K.; Waghmare U. V.; Novoselov K. S.; Krishnamurthy H. R.; Geim A. K.; Ferrari A. C.; Sood A. K. Monitoring Dopants by Raman Scattering in an Electrochemically Top-Gated Graphene Transistor. Nat. Nanotechnol. 2008, 3, 210–215. 10.1038/nnano.2008.67. [DOI] [PubMed] [Google Scholar]
- Pisana S.; Lazzeri M.; Casiraghi C.; Novoselov K. S.; Geim A. K.; Ferrari A. C.; Mauri F. Breakdown of the Adiabatic Born-Oppenheimer Approximation in Graphene. Nat. Mater. 2007, 6, 198–201. 10.1038/nmat1846. [DOI] [PubMed] [Google Scholar]
- Basko D. M.; Piscanec S.; Ferrari A. C. Electron-Electron Interactions and Doping Dependence of the Two-Phonon Raman Intensity in Graphene. Phys. Rev. B: Condens. Matter Mater. Phys. 2009, 80, 165413. 10.1103/PhysRevB.80.165413. [DOI] [Google Scholar]
- Bruna M.; Ott A. K.; Ijas M.; Yoon D.; Sassi U.; Ferrari A. C. Doping Dependence of the Raman Spectrum of Defected Graphene. ACS Nano 2014, 8, 7432–7441. 10.1021/nn502676g. [DOI] [PubMed] [Google Scholar]
- Cançado L. G.; Pimenta M. A.; Neves B. R. A.; Dantas M. S. S.; Jorio A. Influence of the Atomic Structure on the Raman Spectra of Graphite Edges. Phys. Rev. Lett. 2004, 93, 247401. 10.1103/PhysRevLett.93.247401. [DOI] [PubMed] [Google Scholar]
- Casiraghi C.; Hartschuh A.; Qian H.; Piscanec S.; Georgi C.; Fasoli A.; Novoselov K. S.; Basko D. M.; Ferrari A. C. Raman Spectroscopy of Graphene Edges. Nano Lett. 2009, 9, 1433–1441. 10.1021/nl8032697. [DOI] [PubMed] [Google Scholar]
- Novoselov K. S.; Geim A. K.; Morozov S. V.; Jiang D.; Zhang Y.; Dubonos S. V.; Grigorieva I. V.; Firsov A. A. Electric Field Effect in Atomically Thin Carbon Films. Science 2004, 306, 666–669. 10.1126/science.1102896. [DOI] [PubMed] [Google Scholar]
- Casiraghi C.; Hartschuh A.; Lidorikis E.; Qian H.; Harutyunyan H.; Gokus T.; Novoselov K. S.; Ferrari A. C. Rayleigh Imaging of Graphene and Graphene Layers. Nano Lett. 2007, 7, 2711–2717. 10.1021/nl071168m. [DOI] [PubMed] [Google Scholar]
- Bonaccorso F.; Sun Z.; Hasan T.; Ferrari A. C. Graphene Photonics and Optoelectronics. Nat. Photonics 2010, 4, 611–622. 10.1038/nphoton.2010.186. [DOI] [Google Scholar]
- Bonaccorso F.; Lombardo A.; Hasan T.; Sun Z.; Colombo L.; Ferrari A. C. Production and Processing of Graphene and 2D Crystals. Mater. Today 2012, 15, 564–589. 10.1016/S1369-7021(13)70014-2. [DOI] [Google Scholar]
- Venezuela P.; Lazzeri M.; Mauri F. Theory of double-resonant Raman spectra in graphene: Intensity and line shape of defect-induced and two-phonon bands. Phys. Rev. B: Condens. Matter Mater. Phys. 2011, 84, 035433. 10.1103/PhysRevB.84.035433. [DOI] [Google Scholar]
- Sasaki K.; Tokura Y.; Sogawa T. The origin of Raman D band: bonding and antibonding orbital in graphene. Crystals 2013, 3, 120–140. 10.3390/cryst3010120. [DOI] [Google Scholar]


