Abstract
Water molecules play a vital role in biological and engineered systems by controlling intermolecular interactions in the aqueous phase. Inhomogeneous fluid solvation theory provides a method to quantify solvent thermodynamics from molecular dynamics or Monte Carlo simulations and provides an insight into intermolecular interactions. In this study, simulations of TIP4P-2005 and TIP5P-Ewald water molecules around a model beta sheet are used to investigate the orientational correlations and predicted thermodynamic properties of water molecules at a protein surface. This allows the method to be benchmarked and provides information about the effect of a protein on the thermodynamics of nearby water molecules. The results show that the enthalpy converges with relatively little sampling, but the entropy and thus the free energy require considerably more sampling to converge. The two water models yield a very similar pattern of hydration sites and these hydration sites have very similar thermodynamic properties, despite notable differences in their orientational preferences. The results also show that a protein surface affects the free energy of water molecules to a distance of approximately 4.0 Å, which is in line with previous work. In addition, all hydration sites have a favourable free energy with respect to bulk water, but only when the water-water entropy term is included. A new technique for calculating this term is presented and its use is expected to be very important in accurately calculating solvent thermodynamics for quantitative application.
Introduction
The important role of water molecules in controlling intermolecular interactions in the aqueous phase is commonly underappreciated and is often ignored. However, the timescales now accessible to Monte Carlo (MC) and molecular dynamics (MD) simulations using explicit water molecules have facilitated calculations of the thermodynamics of water molecules in bulk water[1] and at protein surfaces.[2] The methods of inhomogeneous fluid solvation theory (IFST)[3], thermodynamic integration (TI)[4], and free-energy perturbation (FEP)[5] have all been employed for this purpose. IFST has proved to be particularly useful in understanding the binding affinity of native partners[6] and potential drug molecules.[7] IFST operates by calculating the free energy of water molecules by considering the average interaction energy and the entropy derived from intermolecular correlations. This free energy can be compared to the free energy of a water molecule in bulk water, calculated using the same method.
In previous work, the enthalpy, entropy and free energy of water molecules in bulk water have been calculated and the relative orientations of neighbouring water molecules have been studied[8]. In this paper, a similar analysis is extended to a biological context by modelling water molecules surrounding a model beta sheet protein using IFST. This allows consideration of the convergence of the predicted thermodynamic properties based upon sampling of the MD trajectories and an assessment of the length scale over which proteins affect the thermodynamics of surrounding water molecules. Both issues are very important when implementing IFST to calculate absolute free energies of water molecules around a protein and free energy changes upon binding. The relative orientations of neighbouring water molecules at the protein surface are also recorded and these can be compared directly to the relative orientations in bulk water. Orientational correlations have an important effect on the entropy of water, both in the bulk liquid[1,9] (REF Giaquinta) and at protein surfaces[2,10], yet methods to model them remain underdeveloped.
In bulk water, the choice of the water model affects the orientational correlations[8] and recent work using FEP predicts that this also affects the thermodynamic properties of water molecules in biological complexes[11] and the mechanism of protein folding.[12] It is thus interesting to consider the effect of the water model on the results in the present case and thus all simulations and calculations were performed with both the TIP4P-2005[13] and TIP5P-Ewald[14] water models. These two water models were chosen as they represent two classes of water model, both of which reproduce the oxygen-oxygen, oxygen-hydrogen and hydrogen-hydrogen radial distribution functions reasonably well but which differ in their orientational correlations (REF). The TIP4P-2005 model include four sites in total, two hydrogen atoms, an oxygen atom and an extra atom with zero mass to represent a lone pair. The TIP5P-Ewald model uses two hydrogen atoms, an oxygen atom and two lone pairs. The use of additional interaction sites leads to increased simulation times and thus the choice of water model is a very important one. Importantly, these two models displayed notably different properties in bulk water, where the TIP4P-2005 model demonstrated a preference to act as a planar hydrogen bond acceptor whereas the TIP5P-Ewald model demonstrated a preference to act as a tetrahedral hydrogen bond acceptor[8]. The effect of the water model on orientational correlations at protein surfaces is an area of great importance and one which has not been fully explored.
In this study, the orientational correlations and the predicted thermodynamic properties of TIP4P-2005 and TIP5P-Ewald water molecules around a model beta sheet are considered.
Methods
MD simulations of water surrounding an ideal antiparallel pleated beta sheet were performed using NAMD[15] with the water models TIP4P-2005 and TIP5P-Ewald. Sites with high water density were identified and the orientational correlations and the calculated excess enthalpies, entropies and free energies, compared to bulk water, were calculated using IFST.
Beta Sheet Geometry
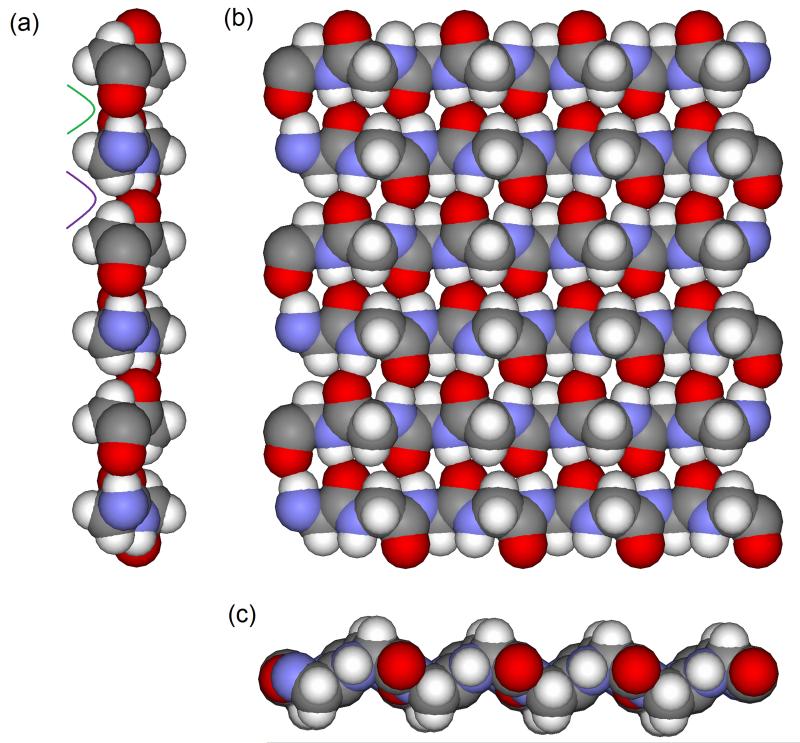
An ideal glycine beta strand was generated using the CHARMM27 force field[16-17] bond length and bond angle parameters and dihedral angles of φ = −120° and ψ = 120°. The strand was oriented such that it ran along the X axis with the C=O carbonyl bond aligned with the Y axis. This single strand was then replicated to generate a second strand. The second strand was rotated by 180° around the Y axis and translated by 4.877875 Å along the Y axis. It was then translated by 0.58 Å in the X direction to produce the shear that is characteristic of antiparallel beta sheets.[18] These two antiparallel strands were then replicated twice more to generate six strands in total. Strands three and four were translated by 9.75575 Å along the Y axis and strands five and six were translated by 19.5115Å along the Y axis. To avoid edge effects, the beta sheet extended across the periodic boundaries between adjacent unit cells to create an approximately uniform infinite sheet. To create a repeating unit, the beta sheet extends for 25.57 Å in the X axis and 29.2673 Å in the Y axis. The beta sheet used in the simulation can be seen in Figure 1. Whilst polyglycine I forms a rippled beta sheet rather than a pleated beta sheet[19], this idealised beta sheet is simply a testing ground for thermodynamic analysis rather than a detailed exploration of polyglycine itself.
Figure 1. The model beta sheet used in the simulations.
The model glycine beta sheet is displayed as atom coloured space filling with views along the (a) X axis, (b) Y axis and (c) Z axis. The narrow and wide grooves are identified in green and purple respectively.
System Setup
To solvate the systems, the SOLVATE program[20] (REF Delete) version 1.0 from the Max Planck Institute was used to generate a water sphere of radius 50.0 Å around the beta sheet. No ions were included in the simulations. This stage of preparation was undertaken in order to generate a reasonable water density. This sphere was then cut to a rectangular box with side lengths x= 25.57 Å, y= 29.2673 Å, and z=25.0 Å. All hydrogen atoms were then deleted from the system and all the necessary hydrogen atoms and lone pairs were built using the appropriate geometry for each water model. This stage of preparation was undertaken to ensure that the geometries of the water molecules were standardized. Each cube contained 527 water molecules. All protein atoms were fixed for the entirety of the setup, equilibration and production simulations.
Equilibration
All systems were treated using periodic boundary conditions and the electrostatics were modeled using the particle mesh Ewald method [21]. The lengths of the rectangular box were fixed along the X and Y axis, but allowed to vary along the Z axis during 100 ps of MD equilibration at 300 K in an NPT ensemble. This stage of preparation was undertaken to generate an equilibrated water density. This was followed by MD equilibration for 1 ns at 300 K in an NVT ensemble. All systems were brought to equilibrium before continuing the simulations by verifying that the systems had reached a point where the energy fluctuations were stable. After equilibration, the number density of water molecules far from the beta sheet fluctuated around the bulk density value of 0.033 molecules/Å3 for both water models.
Molecular Dynamics
Production simulations were performed for 40.0 ns at 300 K. All MD simulations were performed using the NAMD program version 2.8[22] with the CHARMM27 force field[16-17] using an MD time step of 2.0 fs. Electrostatic interactions were modelled with a uniform dielectric and a dielectric constant of 1.0 throughout the setup and production runs. Van der Waals interactions were truncated at 12.0 Å with switching from 8.0 Å. System snapshots were saved every 20.0 fs. All MD simulations were performed using NAMD compiled for use with CUDA-accelerated GPUs.
Water Clustering
The MD simulations were first analysed to cluster the water molecules into distinct spherical regions of high number density. Both sides of the beta sheet were considered. These regions have been termed hydration sites in previous work using IFST [2-3,8]. A radius of 1.2 Å was employed for these hydration sites, in line with prior work[2,8]. Previous applications of this methodology have used the positions of water molecules from the simulation as potential hydration sites[3]. Here a grid-based method was used. The hydration sites were selected by superposing 50,000 snapshots from the MD trajectory to generate a profile of the water density. A Cartesian grid around the beta sheet was then generated, with a resolution of 0.5 Å. The grid was centered on the centroid of the beta sheet. Within the complete water density profile, the grid point with the largest number of water molecules within a 1.2 Å radius was identified. The centroid of all the neighbouring water molecules from any snapshot within 1.2 Å of the grid point was then calculated. This centroid position was identified as the centre of a hydration site and all of the neighbouring water molecules within 1.2 Å were excluded from further consideration. The 1.2 Å sphere around the position of this oxygen atom was defined as a hydration site. The process was then repeated to identify more hydration sites, allowing no new hydration sites within 2.4 Å of a previously defined hydration site. This process was terminated once when the density of the next identified hydration site fell below 1.5 multiplied by the number density of bulk water, which corresponds to an occupancy of 0.36 in the sphere of radius 1.2 Å. The resultant set of hydration sites was then subjected to energy and entropy calculations using IFST.
Energy Evaluations
For each hydration site, the average interaction energy with the protein (Epw) and with the other water molecules (Eww) was calculated from 10,000 snapshots with one taken every 200 ps. All water molecules in the periodic box were considered, including their interactions with neighboring boxes. The differences in interaction energy between bulk water molecules and the water molecules in each site (ΔE) were calculated from the mean interaction energy of a bulk water molecule (Ebulk) as follows
| (1) |
Based on previous work, Ebulk takes the values of −22.65 kcal/mol and −19.34 kcal/mol for TIP4P-2005 and TIP5P-Ewald respectively[8]. ΔE in this case is the difference between the contribution that water molecules within the hydration site make to the total interaction energy of the system and the contribution they make in bulk water to the total interaction energy of the system. This is the same as the ΔE used in the original development of IFST[23] but is not the same as the world energy used in more recent implementations of IFST, which quantifies the difference between the total interaction energy of water molecules within the hydration site and the total interaction energy of a bulk water molecule.[3,6] This was termed the binding energy relative to the bulk (ΔEbinding) by Lazaridis.[23]
| (2) |
Translational Entropy
IFST includes an entropic term to describe the translational ordering of water molecules around a solute (Spw,trans) based on its position relative to the centre of the hydration site (r). Both values can be calculated within any given hydration site as follows.
| (3) |
k is Boltzmann’s constant, ρ is the number density of bulk water and gpw(r) is the translational probability density with respect to bulk water. The protein-water translational probability densities were calculated using a bin size of 0.03 Å for the radial component and 10° for the angular components.
Orientational Entropy
IFST also includes an entropic term to describe the orientational ordering of water molecules around a solute (Spw,orient) based on its orientation within the hydration site (ω).
| (4) |
gpw(ω) is the orientational probability density, which was assumed to be independent of the position within the site and Ω is the integral over the angles. The protein-water orientational probability densities were calculated using a bin size of 10° for the angular components.
Relative Translational Entropy
In addition to the ordering of the water molecules relative to the solute, IFST also considers the ordering of the water molecules relative to each other. The first term to include is the relative translational entropy (Sww,trans) based on the positions (r) and (r') of two water molecules in the protein reference frame.
| (5) |
gww(r, r') is the inhomogeneous water-water translational pair probability density. Calculating this from the protein-water-water triplet correlation function[23-24] requires very large amounts of data. Here it was calculated by assuming that the inhomogeneous pair probability density gww(r, r') is equal to the homogeneous bulk solvent pair probability density gww(R) and depends only on the distance between the water molecules R (REF). The water-water translational probability densities were calculated using a bin size of 0.1 Å for the radial component and 12° for the angular components. Only waters in the first solvation shell within 3.6 Å of the hydration site were considered. Previous work suggests that contributions to Sww,trans are negligible outside the first solvation shell.[6,8,25]
Relative Orientational Entropy
The last entropic term to consider within IFST describes the relative orientational entropy (Sww,orient) based on the relative orientations of two water molecules. The relative orientational entropy can be calculated rigorously as follows.
| (6) |
| (7) |
Ω is the integral over the angles, gpw(ω∣r) is the angular probability density at position r, gpw(ω'∣r') is the angular probability density at position r', and gww(ω,ω'∣r,r') is the inhomogeneous water-water orientational pair probability density at positions r and r'. Accurate estimation of the relative orientational entropy is not possible from simulations carried out using commonly employed timescales due to the vast amounts of sampling required. The calculation thus requires a number of approximations. In previous work, relative orientations have been calculated between all pairs of proximal hydration sites.[6] Here, the relative orientations of all water molecules within the first hydration shell were calculated by considering all pairs of water molecules where one lies within the hydration site and the other lies within 3.6 Å of the hydration site centre. The resulting 3.6 Å sphere was split into subvolumes using a bin size of 0.1 Å for the radial component (r) and 45° for the Euler angles (ω). The relative orientational entropy was calculated between the hydration site and each of the subvolumes. The relative angles were calculated using a bin size of 10°.
| (8) |
Nsite is the mean number of water molecules in the hydration site. Iww was assumed to be dependent on the Euler angle but independent of the distance from the hydration site centre. If the Kirkwood superposition approximation is employed to calculate the pair probability density in equation 7, Iww is then the mutual information between ω and ω'. This can be expressed as the difference between the sum of the entropies of ω and ω' and the pair entropy of ω and ω'.
| (9) |
Spw(ω) is the orientational entropy in the hydration site, Spw(ω') is the orientational entropy in the sphere subvolume, and Sww(ω,ω') is the pair entropy. As an approximation, the pair entropy is calculated as dependent on the relative orientations of two water molecules ωrel. The relative orientation is described by five angles denoted θ1, θ2, χ1, χ2, and φ [1]. The angles θ1 and θ2 describe the angles between the dipole vectors of each water molecule and the intermolecular axis, χ1 and χ2 describe the rotation of each water molecule around its dipole vector and φ describes the rotation around the intermolecular axis.[1]
| (10) |
The full five-dimensional relative orientational entropies Sww(ωrel∣r,r') were estimated by using the second order entropy approximation generated by a truncation of the mutual information expansion.[26-27]
| (11) |
| (12) |
| (13) |
In these equations, S(α∣r,r') is the entropy associated with the angle α, S(α,β∣r,r') is the joint entropy associated with the angles α and β, Ωα is the integral over the angle α, Ωαβ is the integral over the angles α and β, g(α∣r,r') is the conditional probability density for the angle α, and g(α,β∣r,r') is the conditional probability density for the angles α and β. The indices on each sum represent all combinations of the five angles for a given order m. The relative angular probability densities can be integrated, taking advantage of the symmetry of the water molecule. This allows θ1, θ2, χ1, and χ2 to be integrated over the range 0 to π.[1] However, because the water molecules are no longer interchangeable, φ must be integrated over the range 0 to 2π.
Free Energy Calculations
The differences in interaction energy between bulk water molecules and the water molecules in each site (ΔSww) were calculated from the translational and orientational entropy relative to that in bulk using equation 10.
| (14) |
The values of Sww,bulk were calculated with the same protocol used to calculate Sww,trans and Sww,orient. Sww,bulk takes the values of 12.40 cal/mol/K and 12.06 cal/mol/K for TIP4P-2005 and TIP5P-Ewald respectively. All entropies calculated in this work exclude vibrational entropy changes. The difference in free energy (ΔG) for each hydration site can be calculated using equation 15.
| (15) |
Results
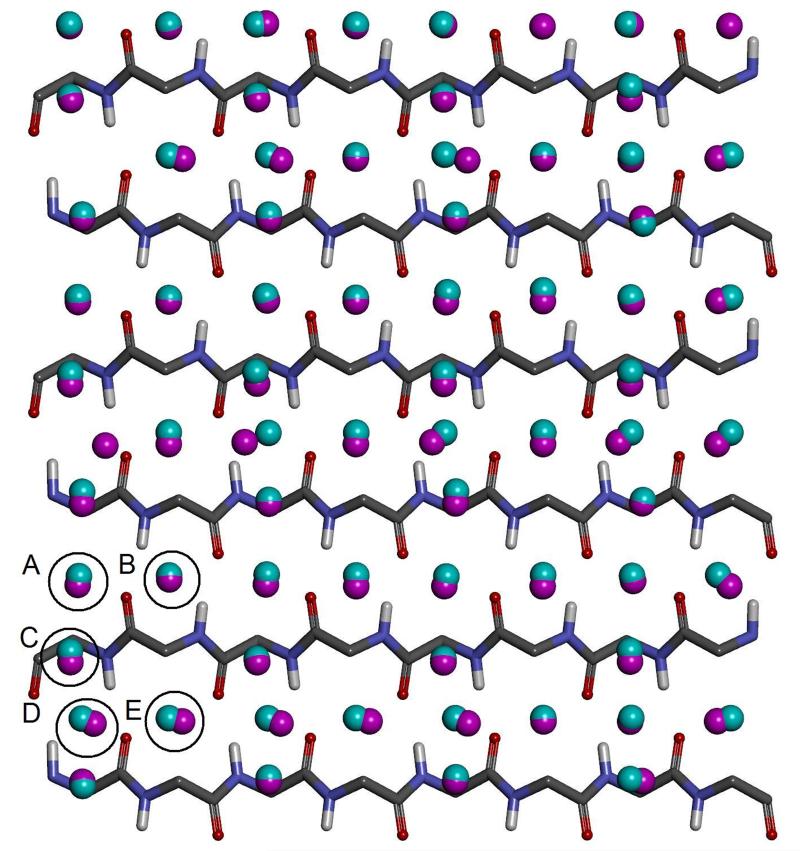
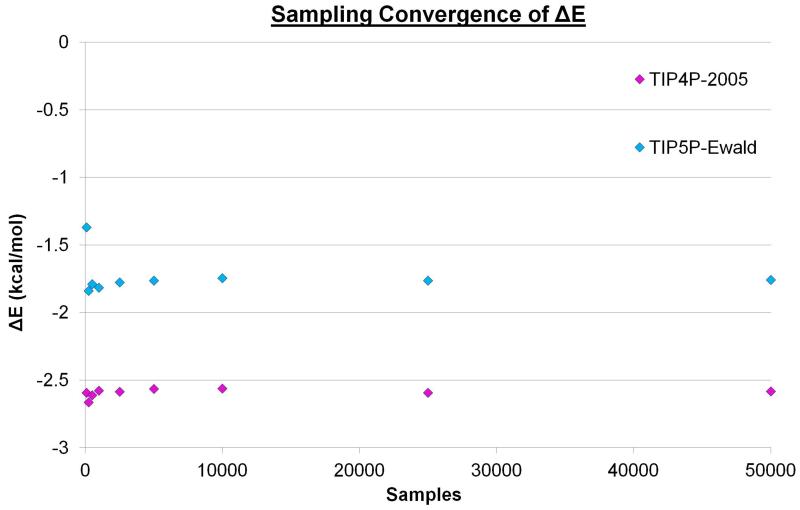
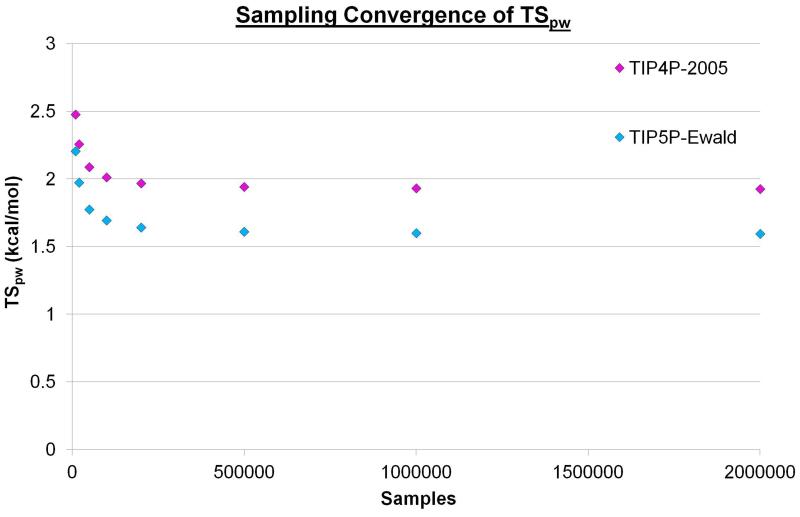
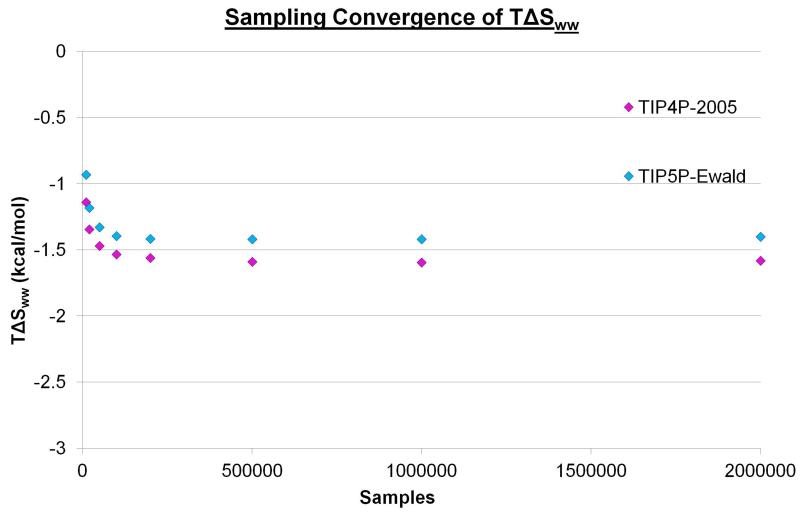
Initially, the simulations for the two water models were analysed to identify sites with high water number density. The locations of these hydration sites can be seen in Figure 2. The two water models yield very similar hydration sites and all 132 hydration sites from the TIP5P-Ewald simulation have a corresponding hydration site from the TIP4P-2005 simulation within 1.0 Å. The RMSD between the 132 TIP5P-Ewald hydration sites and the corresponding hydration sites from the TIP4P-2005 simulation is 0.35 Å. This is not entirely unexpected, as the TIP4P-2005 and TIP5P-Ewald models only afford van der Waals interactions to the oxygen atoms and the Rmin parameters are very similar (1.7729 and 1.737914 respectively). Thus, the distances between water molecules and their ability to enter cavities of a given size are likely to be similar. In addition, there is a clear repeated patterning of hydration sites that can be seen for both water models, with water molecules localising around the two types of groove highlighted in Figure 1a. The top 20 densest sites in the case of the TIP4P-2005 model are also the top 20 densest sites for TIP5P-Ewald model. These hydration sites have a high occupancy of 0.75-0.85 in both cases and are located in the narrow groove of the beta sheet. This is approximately four times the number density of bulk water. The position of such a site is labelled A in Figure 2. Hydration sites with lower occupancies of 0.45-0.55 can be found in the wide groove, above the narrow groove, above the wide groove and between the two grooves. This is approximately twice the number density of bulk water. These sites are labelled B, C, D, and E respectively in Figure 2. Before calculating the properties of the hydration sites it is useful to consider the convergence of the enthalpy and entropies with increased sampling. Figures 3, 4, and 5 show ΔE, TSpw and TΔSww for the densest hydration site for the two water models. ΔE converges with relatively little sampling, requiring only 250 sample points to lie within 5% of the converged answer for the two models. TSpw and TΔSww require considerably more sampling to converge, needing 200,000 and 100,000 sample points to be within 5% of the converged answer for the two models, respectively. These convergence properties will, of course, depend on the bin sizes used in each case, as well as the number density of the site. However, they provide an indication of the amount of data required for convergence. In this case, TSpw and TΔSww are derived from 25,920 and 13,824 sampling bins, corresponding to approximately 7.7 and 7.2 samples per bin, respectively.
Figure 2. The positions of the hydration sites around the beta sheet.
The hydration sites for the TIP4P-2005 and TIP5P-Ewald water models are displayed as magenta and cyan spheres respectively. The protein is displayed as atom coloured sticks. For clarity, only polar hydrogen atoms and only hydration sites on one side of the sheet are shown. The five types of hydration site are ringed with black circles and labelled A (in narrow groove), B (above narrow groove), C (between grooves), D (in wide groove), and E (above wide groove).
Figure 3. The convergence of ΔE with increased sampling.
The calculated enthalpy of the first hydration site for TIP4P-2005 (magenta) and TIP5P-Ewald (cyan) using different levels of sampling from the 2,000,000 configurations. For the nine points plotted for each water model 100, 250, 500, 1000, 2500, 5000, 10,000, 25,000, and 50,000 samples were taken.
Figure 4. The convergence of TSpw with increased sampling.
The calculated protein-water entropy of the first hydration site for the TIP4P-2005 (magenta) and TIP5P-Ewald (cyan) models using different levels of sampling from the 2,000,000 configurations. For the eight points plotted for each water model 10,000, 20,000, 50,000, 100,000, 200,000, 500,000, 1,000,000, and 2,000,000 samples were taken.
Figure 5. The convergence of TΔSww with increased sampling.
The calculated water-water entropy of the first hydration site for TIP4P-2005 (magenta) and TIP5P-Ewald (cyan) using different levels of sampling from the 2,000,000 configurations. For the eight points plotted for each water model 10,000, 20,000, 50,000, 100,000, 200,000, 500,000, 1,000,000, and 2,000,000 samples were taken.
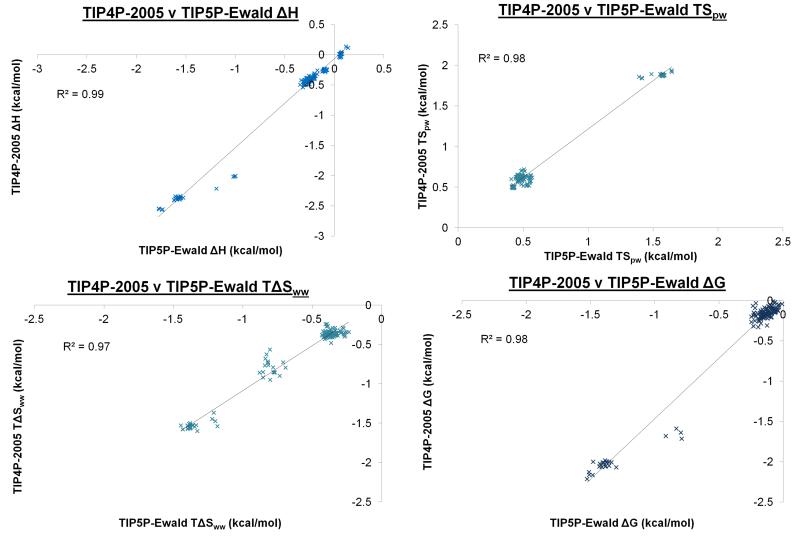
After studying the convergence of each of the thermodynamic properties, the difference between the predicted thermodynamic properties were considered for corresponding TIP4P-2005 and TIP5P-Ewald hydration sites. Corresponding hydration sites are defined as those which are within 1.0 Å of each other. Plots of ΔE, TSpw, TΔSww, and ΔG for the two models can be seen in Figure 6. For corresponding TIP4P-2005 and TIP5P-Ewald hydration sites, the coefficients of determination for ΔE, TSpw, TΔSww, and ΔG are 0.99, 0.98, 0.97 and 0.98. The thermodynamic properties thus have very similar trends in both cases. For corresponding TIP4P-2005 and TIP5P-Ewald hydration sites, the RMSDs between ΔE, TSpw, TΔSww, and ΔG are 0.38, 0.18, 0.10 and 0.29 kcal/mol respectively. The main difference arises in the ΔE term and this is consistent with previous work suggesting that the excess energies of the two models are notably different, with the TIP4P-2005 model providing a more accurate prediction of the experimental excess enthalpy and free energy of liquid water. Despite this difference, the RMSD of 0.29 kcal/mol for the free energies suggests that the two models predict similar thermodynamic properties for hydration sites in this case. However, it is worth noting that the largest difference in ΔG between the two models is 0.85 kcal/mol. Thus, for any given hydration site the two models may predict thermodynamic properties that differ by a significant amount. All hydration sites make a favourable (negative) contribution to the total free energy of the system and this is generally derived from a favourable contribution to the total enthalpy and an unfavourable contribution to the total entropy.
Figure 6. The calculated free energies of the hydration sites for the TIP4P-2005 and TIP5P-Ewald water models.
A plot of the calculated enthalpies, protein-water entropies, water-water entropies and free energies for all the corresponding hydration sites from the TIP4P-2005 and TIP5P-Ewald water models. Hydration sites from the two models are identified as corresponding if they lie within 1.0 Å of each other. The smaller clusters of points with more positive (unfavourable) contributions to the protein-water entropies and more negative (favourable) contributions to the enthalpies, water-water entropies and free energies are the twenty hydration sites that are in the narrow grooves of the beta sheet.
The differences in predicted thermodynamic properties for the two models are also shown by considering examples for each of the five specific types of hydration sites. Data for hydration sites in the narrow groove, in the wide groove, above the narrow groove, above the wide groove and between the two grooves can be seen in Table 1. It is interesting to note that the hydration site in the narrow groove has a significantly favourable energy (ΔE) compared to bulk water. This arises from favourable electrostatic interactions with the protein amide and carbonyl groups. There is an entropic penalty for localising the water at this position (TSpw) but this is countered by decreased ordering of the surrounding water molecules because there are fewer neighbours (TΔSww) and leads to a favourable contribution to the total free energy (ΔG). The other hydration sites make small and favourable contributions to the total free energy overall. It is interesting to note that the world energy (binding energy relative to bulk or) has a positive and unfavourable value of ΔEbinding= +0.34 kcal/mol for the hydration site in the narrow groove using the TIP5P-Ewald model. The contribution to the interaction energy for this site has a negative and favourable value of ΔE= −1.74 kcal/mol. Thus, identifying this hydration site as energetically favourable or unfavourable depends on how the energy is defined.
Table I. The calculated thermodynamic properties of five hydration sites.
The thermodynamic properties of five hydration sites calculated using the TIP4P-2005 and TIP5P-Ewald water models. For the hydration sites in the wide groove, the narrow groove, above the narrow groove, above the wide groove and between the grooves the positions of the hydration site for the two water models are 0.196 Å, 0.171 Å, 0.117 Å, 0.124 Å and 0.124 Å apart, respectively.
| Water Model | Hydration Site Location | Occupancy | ΔH | TSpw | TΔSww | TΔS | ΔG |
|---|---|---|---|---|---|---|---|
| TIP4P | In Narrow Groove (A) | 0.83 | −2.56 | 1.97 | −1.58 | 0.39 | −2.17 |
| TIP5P | In Narrow Groove (A) | 0.75 | −1.74 | 1.64 | −1.38 | 0.26 | −1.49 |
| TIP4P | In Wide Groove (D) | 0.48 | −0.05 | 0.64 | −0.85 | −0.21 | −0.26 |
| TIP5P | In Wide Groove (D) | 0.50 | 0.08 | 0.55 | −0.88 | −0.33 | −0.25 |
| TIP4P | Above Narrow Groove (B) | 0.52 | −0.36 | 0.60 | −0.35 | 0.25 | −0.11 |
| TIP5P | Above Narrow Groove (B) | 0.49 | −0.21 | 0.48 | −0.39 | 0.09 | −0.12 |
| TIP4P | Above Wide Groove (E) | 0.49 | −0.26 | 0.51 | −0.39 | 0.12 | −0.14 |
| TIP5P | Above Wide Groove (E) | 0.44 | −0.10 | 0.43 | −0.40 | 0.03 | −0.07 |
| TIP4P | Between Grooves (C) | 0.51 | −0.45 | 0.65 | −0.48 | 0.17 | −0.28 |
| TIP5P | Between Grooves (C) | 0.48 | −0.27 | 0.46 | −0.36 | 0.10 | −0.17 |
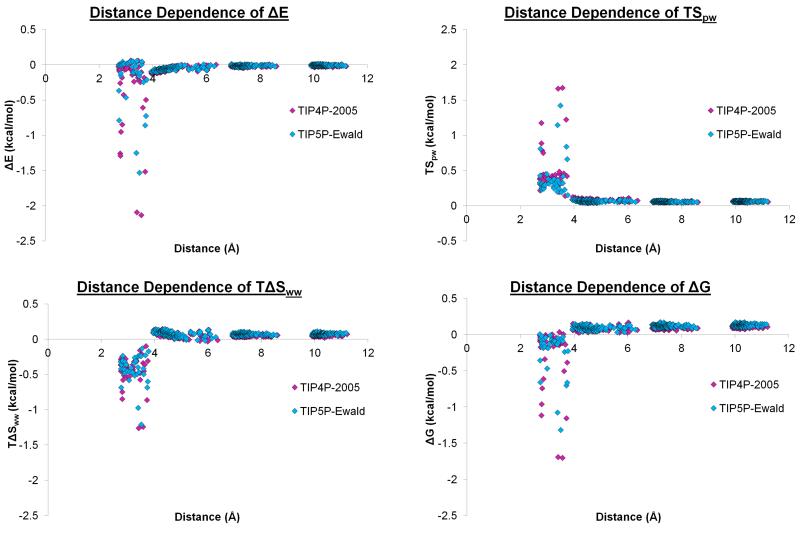
In addition to the thermodynamic properties for the hydration sites around the beta sheet, it is instructive to consider the length scales over which the thermodynamics of water are affected by the proximity of the beta sheet. Figure 7 shows a plot of the ΔE, TSpw, TΔSww, and ΔG for the two models at grid points located at increasing distance from the beta sheet. Grid points closer than the combined van der Waals radii of oxygen and hydrogen were excluded, to avoid considering grid points within the protein. ΔE declines rapidly and has no contribution greater than 0.2 kcal/mol at distances greater than 4.0 Å for either model. TSpw and TΔSww also decline rapidly over a similar length scale to ΔE, with no contribution greater than 0.2 kcal/mol above 4.0 Å for either model. Thus, ΔG is affected to a distance of approximately 4.0 Å from the surface of the beta sheet. The thermodynamic properties for both water models are affected over very similar length scales. Similar effects have been considered before for a non-polar ligand binding at a non-polar cavity[28-30] where a very similar length scale was observed. However, this is the first analysis of the length scales over which a macromolecule affects the thermodynamic properties of water molecules.
Figure 7. Thermodynamic properties of water molecules at grid points around the protein.
The enthalpies, protein-water entropies, water-water entropies and free energies of water molecules with respect to bulk within a 1.2 Å sphere at Cartesian grid points around the protein. The results for TIP4P-2005 and TIP5P-Ewald are displayed in magenta and cyan respectively. The grid has a 3.0 Å resolution and is centred on the centroid of the protein.
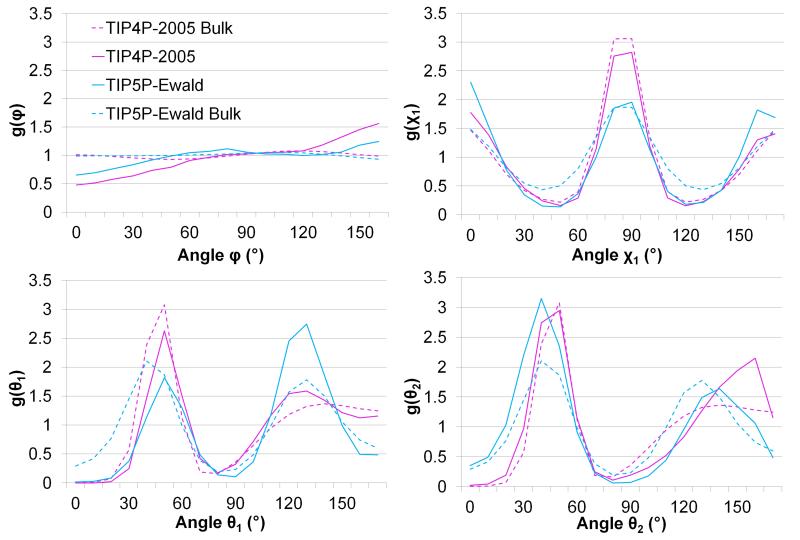
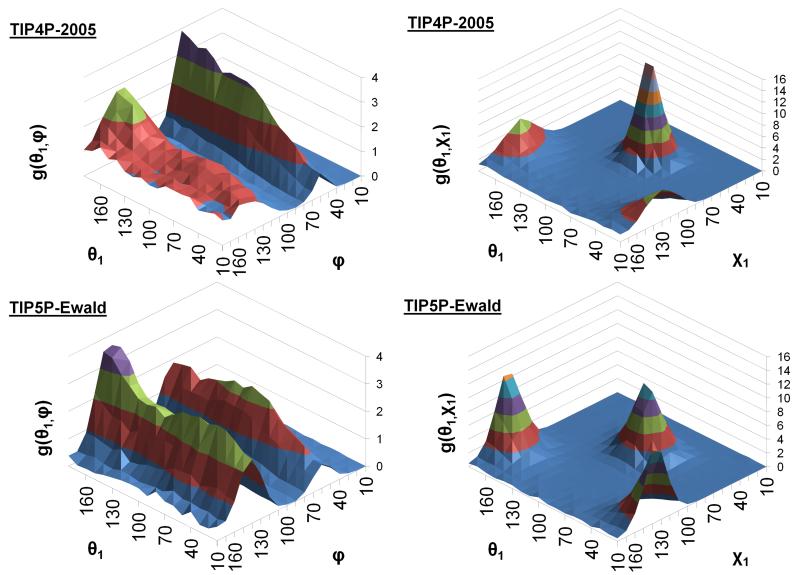
In addition to a thermodynamic analysis of the water molecules, it is interesting to consider the relative orientations of water molecules in adjacent hydration sites for the two models. Such an analysis has been performed previously for the TIP4P water model [1] and in a comparison of the TIP3P-Ewald, TIP4P-2005, TIP5P-Ewald, and SWM4-NDP water models.[8] Figure 8 shows the relative angular distributions for the φ, χ1, θ1, and θ2 angles between the densest hydration site in the narrow groove and an adjacent site above the narrow groove. The plots are very similar to those obtained in bulk water, particularly in the case of the χ1 plot. The θ1 and θ2 distributions are also similar, although in the case of the TIP5P-Ewald model the symmetry of the two peaks is broken, suggesting that the proclivity of waters in these sites to act as hydrogen bond donors and acceptors is not equal. The φ plot is, however, different to that obtained in bulk water, being notably more structured. These differences are also illustrated in the distributions of pairs of angles presented in Figure 9. The plot of g(θ1,φ) reveals that φ shows considerably more structure in combination with θ1 and that this structure is different for the two models. The difference between the two models is also revealed by the plot of g(θ1, χ1), which shows peaks at the same relative angles but with very different probability densities. It is interesting that the two water models predict similar thermodynamic properties for the hydration site, particularly the entropies, despite these differences in the relative orientations of the water molecules.
Figure 8. The angular distribution functions of φ, χ1, θ1 and θ2 for the two models.
The φ, χ1, θ1, and θ2 angular distribution functions from TIP4P-2005 (magenta) and TIP5P-Ewald (cyan) between 2.7 Å and 2.8 Å for bulk water (dashed lines) and in the first hydration site (solid lines).
Figure 9. Surface plots of the θ1/χ1 and θ1/φ angular distribution functions for the two models.
The θ1/θ2 and θ1/φ pair distribution functions for the two models between 2.7 Å and 2.8 Å. The probability densities g(θ1/θ2) and g(θ1/φ) are represented by the level of the surface and coloured in bands of height of 2.0 and 1.0 respectively.
Discussion
Explicit consideration of the thermodynamics of water molecules is an important aspect of modelling intermolecular interactions. This paper attempts to benchmark and analyse calculations of the enthalpy, entropy and free energy of water molecules around a model beta sheet for two water models, TIP4P-2005 and TIP5P-Ewald.
The paper introduces a new method to calculate the difference in water-water entropy between water molecules at a protein surface and in bulk. This is based on the mutual information between the orientations of water molecules in two subvolumes. The relative orientations are defined using the five relative angles and the five-dimensional relative orientational entropies are calculated using the second order entropy approximation generated by a truncation of the mutual information expansion. Such an approximation is necessary due to the vast amounts of data required for calculating the relative orientational entropy. However, including this term is calculated be very important, as TΔSww is calculated to be of a similar magnitude to TSpw but opposite in sign. This can be understood on the basis that a water molecule at a protein surface has fewer neighbours than in bulk and thus has reduced relative orientational ordering. In addition, much of the relative orientational order of the water molecules is captured by the TSpw term and thus assigning all of the orientational entropy to the TSpw term is arbitrary. Thus it is not sufficient to include the TSpw term for the system but ignore the TΔSww terms from both the system and bulk water. This important aspect can be captured more completely by employing the mutual information in equations 9 and 10. Ignoring TΔSww thus leads to a more positive prediction of the free energy. Whilst this result may not be general, TΔSww must be quantified to provide accurate predictions of solvent thermodynamics.
Initial calculations on the convergence properties of the thermodynamic properties suggest that the enthalpies converge with relatively few samples, in agreement with previous studies.[31] However, the entropies and thus the free energies require significantly more sampling to converge and thus any implementation of IFST requires a careful consideration of the sampling requirements. This simple model of a beta sheet suggests that there are regularly spaced and high density hydration sites in one of the grooves. These sites make a more favourable contribution to the total free energy than they would in bulk by approximately 2.0 kcal/mol for each water. A favorable contribution of water molecules to the free energy is in line with the initial implementation of IFST (REF) but is at odds with more recent applications of IFST, where water molecules are generally predicted to make an unfavorable contribution to the free energy (REF). This is likely due to the inclusion or exclusion of the TΔSww term and the calculation of the free energy versus the binding free energy. Other hydration sites have a lower density and a similar free energy to bulk. It is somewhat surprising that the surface of a beta sheet is predicted to be hydrophilic, with the total contribution to the free energy of water molecules being favourable. Recent work suggests that water molecules around backbone carbonyl and amide groups make an unfavourable contribution to the free energy.[32] This may be due to different simulation protocols, application to different systems, use of the binding energy instead of the energy contribution or exclusion of the water-water entropy term. However, a favourable contribution to the free energy for water molecules at the surface of a beta sheet by no means precludes the association of beta sheets in solution accompanied by the expulsion of water, as this depends also on the interaction between the sheets. Furthermore, crystal waters may remain between the sheets, requiring additional calculations to quantify their contribution to the free energy.
Whilst the TIP4P-2005 and TIP5P-Ewald water models give very similar results for all of the calculated thermodynamic properties, the largest difference in ΔG for the two models is 0.85 kcal/mol. This would be a significant difference when using these predictions in a quantitative manner, as would be required when estimating protein-ligand binding affinities for molecular docking or molecular design. Analysis of the change in free energy at grid points at increasing distance from the protein surface suggests that ΔG is affected to a distance of approximately 4.0 Å for these two models. Whilst this agrees with previous studies, it may not be applicable to charged surfaces and this should be investigated in further work. Finally, analysis of the relative angular distributions for the two water models highlights significant differences in the solvent structure at the protein surface. This result is consistent with previous analysis of solvent structure in bulk, showing key differences between the TIP4P-2005 and TIP5P-Ewald models, but it does not appear to strongly affect the thermodynamic properties, which remain very similar for the two models. However, this difference may affect the thermodynamics in cases where bridging hydrogen bonding interactions are important and may also influence the kinetics of transitions between different states. Whilst validation of these models is difficult, experimental data may be available to validate predictions of solvent structure at protein surfaces. Such considerations are beyond the scope of this work, but are very important and should be explored in further work.
In conclusion, the results of this study suggest that a protein surface affects the free energy of water molecules to a distance of 4.0 Å and predicts that all hydration sites have a favourable free energy with respect to bulk when the water-water entropy term is included. The thermodynamic predictions are the same for the two water models tested here, despite notable differences in the relative orientational preferences. It is also clear that the amount of sampling necessary must be considered carefully in any implementation of IFST. Calculations of solvent thermodynamics are a fundamental aspect of accurately modelling intermolecular interactions in solution, but must be performed as rigorously as possible using sufficient data.
Acknowledgements
Acknowledgements go to Mike Payne for careful reading of the manuscript, Stuart Rankin for technical help and the NVIDIA CUDA Centre of Excellence at the Cambridge HPCS for use of the CUDA-accelerated GPUs. All calculations were performed using the Darwin Supercomputer of the University of Cambridge High Performance Computing Service (http://www.hpc.cam.ac.uk/) provided by Dell Inc. using Strategic Research Infrastructure Funding from the Higher Education Funding Council for England and were funded by the EPSRC under grant EP/F032773/1. Thanks for financial support go to the MRC, Wellcome Trust and EPSRC.
References
- 1.Lazaridis T, Karplus M. J Chem Phys. 1996;105(10):4294–4316. [Google Scholar]
- 2.Li Z, Lazaridis T. J Phys Chem B. 2006;110(3):1464–1475. doi: 10.1021/jp056020a. [DOI] [PubMed] [Google Scholar]
- 3.Abel R, Young T, Farid R, Berne BJ, Friesner RA. J Am Chem Soc. 2008;130(9):2817–2831. doi: 10.1021/ja0771033. [DOI] [PMC free article] [PubMed] [Google Scholar]
- 4.Hamelberg D, McCammon JA. J Am Chem Soc. 2004;126(24):7683–7689. doi: 10.1021/ja0377908. [DOI] [PubMed] [Google Scholar]
- 5.Michel J, Tirado-Rives J, Jorgensen WL. J Am Chem Soc. 2009;131(42):15403–15411. doi: 10.1021/ja906058w. [DOI] [PMC free article] [PubMed] [Google Scholar]
- 6.Huggins DJ, Marsh M, Payne MC. J Chem Theory Comput. 2011;7(11):3514–3522. doi: 10.1021/ct200465z. [DOI] [PMC free article] [PubMed] [Google Scholar]
- 7.Abel R, Wang L, Friesner RA, Berne BJ. J Chem Theory Comput. 2010;6(9):2924–2934. doi: 10.1021/ct100215c. [DOI] [PMC free article] [PubMed] [Google Scholar]
- 8.Huggins DJ. J Chem Phys. 2012;136(7) doi: 10.1063/1.3683447. In Press. [DOI] [PMC free article] [PubMed] [Google Scholar]
- 9.Lazaridis T. J Phys Chem B. 1998;102(18):3531–3541. [Google Scholar]
- 10.Li Z, Lazaridis T. Abstr Pap Am Chem Soc. 2003;226:U442–U442. [Google Scholar]
- 11.Fadda E, Woods RJ. J Chem Theory Comput. 2011;7(10):3391–3398. doi: 10.1021/ct200404z. [DOI] [PubMed] [Google Scholar]
- 12.Florová P, Sklenovský P, Banáš P, Otyepka M. J Chem Theory Comput. 2010;6(11):3569–3579. doi: 10.1021/ct1003687. [DOI] [PubMed] [Google Scholar]
- 13.Abascal JLF, Vega C. J Chem Phys. 2005;123(23):234505–234505. doi: 10.1063/1.2121687. [DOI] [PubMed] [Google Scholar]
- 14.Rick SW. J Chem Phys. 2004;120(13):6085–6093. doi: 10.1063/1.1652434. [DOI] [PubMed] [Google Scholar]
- 15.Phillips JC, Braun R, Wang W, Gumbart J, Tajkhorshid E, Villa E, Chipot C, Skeel RD, Kale L, Schulten K. J Comput Chem. 2005;26(16):1781–1802. doi: 10.1002/jcc.20289. [DOI] [PMC free article] [PubMed] [Google Scholar]
- 16.MacKerell AD, Bashford D, Bellott M, Dunbrack RL, Evanseck JD, Field MJ, Fischer S, Gao J, Guo H, Ha S, Joseph-McCarthy D, Kuchnir L, Kuczera K, Lau FTK, Mattos C, Michnick S, Ngo T, Nguyen DT, Prodhom B, Reiher WE, Roux B, Schlenkrich M, Smith JC, Stote R, Straub J, Watanabe M, Wiorkiewicz-Kuczera J, Yin D, Karplus M. J Phys Chem B. 1998;102(18):3586–3616. doi: 10.1021/jp973084f. [DOI] [PubMed] [Google Scholar]
- 17.Mackerell AD, Feig M, Brooks CL. J Comput Chem. 2004;25(11):1400–1415. doi: 10.1002/jcc.20065. [DOI] [PubMed] [Google Scholar]
- 18.Ho BK, Curmi PMG. J Mol Biol. 2002;317(2):291–308. doi: 10.1006/jmbi.2001.5385. [DOI] [PubMed] [Google Scholar]
- 19.Pauling L, Corey RB. Proc Natl Acad Sci U S A. 1953;39(4):253. doi: 10.1073/pnas.39.4.253. [DOI] [PMC free article] [PubMed] [Google Scholar]
- 20.Grubmüller H. 1996.
- 21.Darden T, York D, Pedersen L. J Chem Phys. 1993;98(12):10089–10092. [Google Scholar]
- 22.Brooks BR, Bruccoleri RE, Olafson BD, States DJ, Swaminathan S, Karplus M. J Comput Chem. 1983;4(2):187–217. [Google Scholar]
- 23.Lazaridis T. J Phys Chem B. 2000;104(20):4964–4979. [Google Scholar]
- 24.Krumhansl J, Wang S. The Journal of chemical physics. 1972;56:2034. [Google Scholar]
- 25.Zielkiewicz J. J Chem Phys. 2005;123(10):104501. doi: 10.1063/1.2018637. [DOI] [PubMed] [Google Scholar]
- 26.Matsuda H. Physical Review E. 2000;62(3):3096. doi: 10.1103/physreve.62.3096. [DOI] [PubMed] [Google Scholar]
- 27.Killian BJ, Kravitz JY, Gilson MK. The Journal of chemical physics. 2007;127(024107):024107. doi: 10.1063/1.2746329. [DOI] [PMC free article] [PubMed] [Google Scholar]
- 28.Baron R, Setny P, Andrew McCammon J. J Am Chem Soc. 2010;132(34):12091–12097. doi: 10.1021/ja1050082. [DOI] [PMC free article] [PubMed] [Google Scholar]
- 29.Setny P, Baron R, McCammon JA. J Chem Theory Comput. 2010;6(9):2866–2871. doi: 10.1021/ct1003077. [DOI] [PMC free article] [PubMed] [Google Scholar]
- 30.Hummer G. Nature Chem. 2010;2:906–907. doi: 10.1038/nchem.885. [DOI] [PMC free article] [PubMed] [Google Scholar]
- 31.Nguyen C, Gilson MK, Young T. Arxiv preprint arXiv:11084876. 2011 [Google Scholar]
- 32.Beuming T, Che Y, Abel R, Kim B, Shanmugasundaram V, Sherman W. Proteins: Struct, Funct, Bioinf. 2011 doi: 10.1002/prot.23244. [DOI] [PubMed] [Google Scholar]


