

Abstract
Recent studies have shown that metastasis‐associated lung adenocarcinoma transcript 1 (MALAT1) was overexpressed in many human solid cancers, however, its roles in plasma of hepatocellular carcinoma (HCC) patients were unclear. The aim of this study was to investigate the significance of plasma MALAT1 levels in HCC patients. Plasma samples were collected from pre‐operative HCC, hepatic disease patients, and healthy controls, and tissue samples from HCC patients and colorectal cancer patients with liver metastasis. Plasma and tissue MALAT1 levels were measured. Plasma MALAT1 levels were progressively and significantly higher in HCC patients than hepatic disease patients, and higher in hepatic disease patients than healthy controls. The expression of MALAT1 in HCC tissue was slightly higher than that in paired non‐cancerous liver tissue, but not significant. The expression of MALAT1 in the non‐cancerous liver tissue of 20 HCC patients was significantly higher than that in normal liver tissue of 13 colorectal cancer patients. In contrast, plasma MALAT1 levels were significantly low in HCC patients with hepatitis B infection, and significantly high in patients with liver damage B or liver cirrhosis. In a receiver–operator curve analysis of HCC and hepatic disease patients, the cut‐off value of plasma MALAT1 was 1.60 and the area under the curve was 0.66. Plasma MALAT1 levels were not correlated with α‐fetoprotein or protein induced by vitamin K absence II, whereas sensitivity and specificity for the detection of HCC with the combination of MALAT1, α‐fetoprotein, and protein induced by vitamin K absence II were 88.6% and 75%, respectively. In conclusion, the plasma MALAT1 level is associated with liver damage, and has clinical utility for predicting development of HCC.
Keywords: Carcinogenesis, hepatocellular carcinoma, liver damage, long non‐coding RNA, metastasis‐associated lung adenocarcinoma transcript 1
Hepatocellular carcinoma (HCC) is one of the most common malignant tumors worldwide, particularly in East Asian countries.1 Hepatocellular carcinoma has been associated with chronic liver inflammation in hepatic disease patients infected with certain types of hepatitis viruses. However, the risk factors leading to HCC are complex and only partially understood. The clinical heterogeneities of HCC and lack of good diagnostic markers remain a major issue in the clinical management of HCC.2, 3, 4 The need for a reliable diagnostic biomarker for HCC has attracted attention to this field.
Non‐coding RNAs have emerged as a new class of functional transcripts in eukaryotic cells. They have been categorized into three subclasses based on the number of nucleotides: microRNAs, 21–25 nt; small non‐coding RNAs, <200 nt; and long non‐coding RNAs (lncRNAs), ≥200 nt.5, 6, 7 Numerous microRNAs have recently been shown to play key roles in various biological processes in both normal and cancer tissues.8, 9, 10 Many lncRNAs have also been identified and the number of studies examining their roles is rapidly increasing. Guttman et al.11 identified thousands of highly conserved lncRNAs in mammals by means of chromatin signature mapping. Recent studies reported that some lncRNAs played pivotal roles in modulating cancer epigenetics and regulating important biological processes.12, 13, 14 Although it has been reported that circulating nucleic acids are stable and useful for many experiments, their exact roles in cancer development and progression remain unknown.
Metastasis‐associated lung adenocarcinoma transcript 1, also known as MALAT1, is an lncRNA of approximately 8 kb. It was originally found to be overexpressed in non‐small‐cell lung cancer patients who were at high risk of metastasis.14, 15 Recent studies showed that MALAT1 was also overexpressed in many human solid cancers, including breast, pancreas, colon, prostate, and liver cancers.14 Although the functions of MALAT1 in liver tissues are beginning to be understood, its roles in plasma in HCC patients require further study.
We have investigated many circulating RNA biomarkers using plasma samples in cancer patients, and obtained productive results. In the present study, MALAT1 levels in HCC patients were measured in plasma and liver tissue, and their significance or diagnostic utility was evaluated.
Materials and Methods
Patients
Eighty‐eight pre‐operative plasma samples were collected from patients with HCC who underwent hepatectomy at the Kyoto Prefectural University of Medicine (Kyoto, Japan) between April 2010 and December 2012. Serum hepatitis B surface antigen and anti‐hepatitis C antibody were positive in 21 and 46 patients, respectively; 21 patients were negative for both (NonBNonC). Clinical and survival data were available for all patients. Plasma samples were also collected from 51 healthy controls without known cancers or hepatitis B or C infection and 28 hepatic disease patients. The detailed clinicopathological features of HCC and hepatic disease patients, and healthy controls are shown in Tables 1 and 2, and biochemical parameters are shown in Table 3.
Table 1.
Clinicopathological features of hepatocellular carcinoma patients and plasma levels of metastasis‐associated lung adenocarcinoma transcript 1 (MALAT1)
| No. | Plasma MALAT1 levels | P‐value | |||
|---|---|---|---|---|---|
| Low level | High level | ||||
| ≤1.60 (n = 43) | >1.60 (n = 45) | ||||
| Age, years | Mean (range) | 88 | 69 (48–84) | 70 (43–86) | |
| Gender | Female | 37 | 13 | 24 | 0.03 |
| Male | 51 | 30 | 21 | ||
| Hepatitis B antigen | Negative | 67 | 31 | 36 | 0.38 |
| Positive | 21 | 12 | 9 | ||
| Hepatitis C antibody | Negative | 42 | 23 | 19 | 0.29 |
| Positive | 46 | 20 | 26 | ||
| Growth pattern | Expanding | 80 | 41 | 39 | 0.16 |
| Infiltrating | 8 | 2 | 6 | ||
| Capsule invasion | Absent | 42 | 20 | 22 | 0.82 |
| Present | 46 | 23 | 23 | ||
| Serosal invasion | Absent | 83 | 40 | 43 | 0.61 |
| Present | 5 | 3 | 2 | ||
| Portal vein invasion | Absent | 74 | 37 | 37 | 0.62 |
| Present | 14 | 6 | 8 | ||
| Number of tumors | Single | 71 | 32 | 39 | 0.15 |
| Multiple | 17 | 11 | 6 | ||
| Liver damage | A | 75 | 40 | 35 | 0.04 |
| B | 13 | 3 | 10 | ||
| Child–Pugh score | A | 85 | 43 | 42 | 0.08 |
| B | 3 | 0 | 3 | ||
| Liver parenchyma | Normal liver | 5 | 2 | 3 | 0.64 |
| Chronic hepatitis | 55 | 29 | 26 | ||
| Liver cirrhosis | 28 | 12 | 16 | ||
| Stage (UICC) | 1 | 55 | 28 | 27 | 0.52 |
| 2 | 26 | 11 | 15 | ||
| 3 | 6 | 4 | 2 | ||
| 4 | 1 | 0 | 1 | ||
UICC, International Union Against Cancer.Liver damage, defined in the General Rules for the Clinical and Pathological Study of Primary Liver Cancer.
Table 2.
Characteristics of healthy controls and patients with hepatic disease
| Control | Hepatic disease | ||
|---|---|---|---|
| (n = 51) | (n = 28) | ||
| Age, years | Mean (range) | 61 (22–88) | 63 (44–83) |
| Gender | Female | 24 | 16 |
| Male | 27 | 12 | |
| Hepatitis B antigen | Negative | 51 | 26 |
| Positive | 0 | 2 | |
| Hepatitis C antibody | Negative | 51 | 18 |
| Positive | 0 | 10 | |
| Liver damage | A | – | 27 |
| B | – | 1 | |
| Child–Pugh score | A | – | 27 |
| B | – | 1 | |
| Disease | Hepatitis B | 0 | 2 |
| Hepatitis C | 0 | 10 | |
| NAFLD | 1 | 7 | |
| NASH | 0 | 9 | |
| Liver parenchyma | Normal liver | 50 | 16 |
| Chronic hepatitis | 1 | 10 | |
| Liver cirrhosis | 0 | 2 |
–, Not applicable. NAFLD, non‐alcohlic fatty liver disease; NASH, non‐alcohlic steato hepatitis. Liver damage, defined in the General Rules for the Clinical and Pathological Study of Primary Liver Cancer.
Table 3.
Biochemical parameters in patients with hepatic disease or hepatocellular carcinoma (HCC) and healthy controls
| Control | Hepatic disease | HCC | |
|---|---|---|---|
| AST (U/L) | 23.9 ± 11.3† | 36.8 ± 13.4 | 45.9 ± 21.5† |
| ALT (U/L) | 21.4 ± 18.1† | 37.8 ± 25.7 | 39.6 ± 22.5 |
| T‐Bil (mg/dL) | 0.82 ± 0.33 | 0.96 ± 0.51 | 0.80 ± 0.32 |
| Alb (g/dL) | 4.32 ± 0.37 | 4.29 ± 0.40 | 4.01 ± 0.49† |
| Plt (×103) | 220 ± 67.8† | 179 ± 68.6 | 143 ± 59.9† |
| PT (%) | 105.7 ± 20.5 | 106.8 ± 15.1 | 96.4 ± 17.0† |
| ICG 15 | – | – | 15.3 ± 8.4 |
†Significant difference compared with hepatic disease patients (P < 0.05). Data are shown as mean ± SD. –,No data. Alb, albumin; ALT, alanine aminotransferase; AST, aspartate aminotransferase; ICG 15, indocyanine green retention rate at 15 min; Plt, platelets; PT, prothrombin percent activity; T‐Bil, total bilirubin.
Tissue samples
Formalin‐fixed paraffin‐embedded HCC tissues and paired non‐cancerous liver tissues collected from 20 out of 66 HCC patients were examined. Of the 20 HCC patients, 14 had hepatitis B or C and six had NonBNonC hepatitis. For the purpose of investigating the effects of hepatic disease on the expression of MALAT1, normal liver tissue samples collected from 13 colorectal cancer patients with liver metastasis were also examined. These patients did not have any other hepatic diseases, and no inflammatory changes were detected in normal liver tissues.
Diagnoses of HCC
Pathological diagnoses and classifications of HCC were carried out according to the General Rules for the Clinical and Pathological Study of Primary Liver Cancer. Hepatocellular carcinoma was staged according to the TNM classification from the International Hepato‐Pancreato‐Biliary Association and the International Union Against Cancer.16 Liver damage classification was defined in the General Rules for the Clinical and Pathological Study of Primary Liver Cancer. The indocyanine green retention test was included in this classification in addition to Child Pugh classification.
Ethical approval
Ethical approval was granted by the Faculty of Science Ethics Committee at Kyoto Prefectural University of Medicine (RBMR‐C‐179). Participants provided written informed consent in order to participate in this study using the approved procedure by the Ethics Committee.
Storage of plasma samples
Blood samples were processed for the isolation of cell‐free nucleic acids immediately after collection using a three‐spin protocol (350 rcf × g for 30 min followed by 700 g for 5 min and 1600 g for 5 min) in order to minimize residual cellular nucleic acids.10, 17 These plasma samples were stored at −80°C until further analyses.
RNA extraction
In plasma samples, total RNA was extracted from 400 μL cell‐free plasma using a mirVana PARIS Kit (Ambion, Austin, TX, USA) and eluted into 100 μL preheated (95°C) Elution Solution, according to the manufacturer's instructions. The concentrations of total RNA in some plasma samples measured by a Qubit 2.0 Fluorometer (Thermo Fisher Scientific, Waltham, MA, USA) are shown in Figure S1. We used these total RNAs without concentration adjustment for the latter analysis. The RNA concentrations between HCC patients and normal controls were not different (P = 0.24; Fig. S1a), and no correlations between total RNA concentrations and plasma MALAT1 levels were shown in HCC patients and normal controls (P = 0.36 and 0.36, respectively; Fig. S1b,c). In liver tissue samples, total RNA was extracted from four slices of 15‐μm‐thick formalin‐fixed paraffin‐embedded tissue (with a total thickness of 60 μm) using a RecoverAll Total Nucleic Acid Isolation Kit (Ambion) and eluted into 60 μL Elution Solution, according to the manufacturer's instructions. RNA samples were stored at −80°C until further analyses.
Detection of MALAT1 levels by quantitative RT‐PCR
In plasma samples, a reverse transcription reaction was carried out by 9 μl RNA of 100 μL total RNA extracted from 400 μL plasma using a High Capacity RNA‐to‐cDNA Kit (Applied Biosystems, Foster City, CA, USA). These cDNA products were pre‐amplified using a TaqMan PreAmp Master Mix Kit (Applied Biosystems) according to the manufacturer's instructions and our previous study.17 The MALAT1 levels were measured in duplicate by a quantitative real‐time PCR using the MALAT1 primer of a human TaqMan Gene Expression Assay Kit (Applied Biosystems) following the manufacturer's protocol. In brief, quantitative PCR analyses were carried out using the Step One Plus Real‐Time PCR system (Applied Biosystems), and cycle threshold (Ct) values were calculated using Step One Software version 2.2.2 (Applied Biosystems). The ΔΔCt method relative to the level of MALAT1 in one control plasma sample was used for comparisons of plasma MALAT1 levels. This control plasma sample was derived from a 43‐year‐old woman who was operated on for a gallbladder polyp and had no specific medication or past history, including cancer or infection. In the present study, we used a relative evaluation method for plasma MALAT1 levels, because no stable or suitable internal controls for plasma lncRNA examinations currently exist.
In tissue samples, the expression of MALAT1 was calculated by quantitative real‐time PCR using the MALAT1 primer of a human TaqMan Gene Expression Assay Kit (Applied Biosystems) following the manufacturer's protocol, and was then normalized according to the expression of β‐actin. These results were evaluated by the 2−ΔΔCt method.
Comparison between plasma MALAT1 levels and clinicopathological features or biochemical parameters
Plasma MALAT1 levels in HCC patients were divided into two groups by the cut‐off values derived from a receiver–operator curve (ROC) analysis, and compared with clinicopathological features. The relationships of biochemical parameters in each group, for example, serum alanine aminotransferase, aspartate aminotransferase, total bilirubin, albumin, prothrombin percent activity, the indocyanine green retention rate at 15 min, platelets, serum α‐fetoprotein (AFP), and protein induced by vitamin K absence II (PIVKAII), were also investigated.
Statistical analysis
The Wilcoxon signed rank test or Mann–Whitney U‐test was used to compare differences of the paired or unpaired samples. Spearman's correlation test was used to determine the relationship between plasma MALAT1 levels and biochemical parameters. A P‐value less than 0.05 was considered to indicate a significant difference. The ROC and the area under the ROC curve (AUC) were used to assess the feasibility of using plasma MALAT1 as a diagnostic tool for the detection of HCC. The Youden index was used to determine cut‐off values for plasma MALAT1 levels. All statistical analyses were carried out using spss for Windows 11.5 (SPSS, Chicago, IL, USA).
Results
Comparison of plasma MALAT1 levels between HCC patients and healthy controls
Plasma MALAT1 levels were 9.17 ± 43.62 (mean ± SD, median 1.62) in HCC patients and 0.85 ± 1.10 (mean ± SD, median 0.40) in healthy controls; therefore, plasma MALAT1 levels were significantly higher in HCC patients than in healthy controls (P < 0.001; Fig. 1a).
Figure 1.
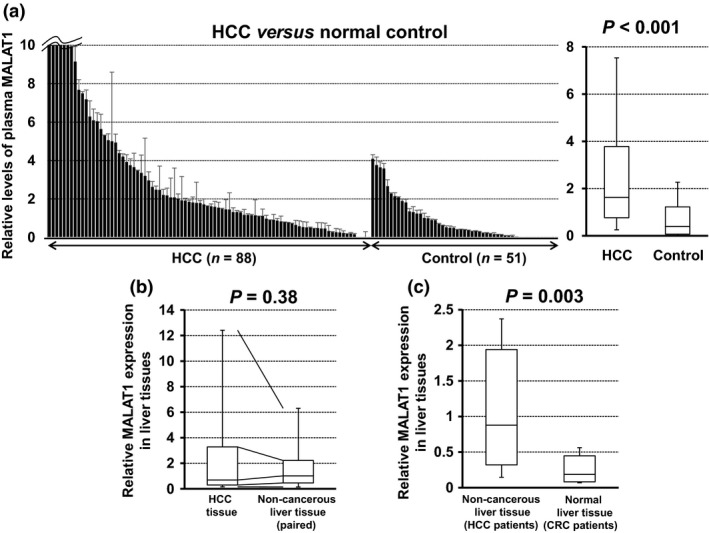
Comparison of plasma and tissue levels of metastasis‐associated lung adenocarcinoma transcript 1 (MALAT1) in hepatocellular carcinoma (HCC) patients and healthy controls. (a) Differences in relative plasma MALAT1 levels between HCC patients (n = 88) and healthy controls (n = 51) were evaluated by the Mann–Whitney U‐test. (b) Differences in relative MALAT1 expression between HCC and paired non‐cancerous liver tissues were evaluated by the Wilcoxon signed rank test. (c) Differences in relative MALAT1 expression between non‐cancerous liver tissue of HCC patients and normal liver tissue of colorectal cancer (CRC) patients with liver metastasis were evaluated by the Mann–Whitney U‐test. (a–c) Upper and lower limits of the box plots and the line inside the boxes indicate the 75th and 25th percentiles and the median, respectively.
Expression of MALAT1 in liver tissues
The expression of MALAT1 was slightly higher in HCC tissue than in paired non‐cancerous liver tissue (n = 20), but was not significant (P = 0.38; Fig. 1b). However, the expression of MALAT1 was significantly higher in the non‐cancerous liver tissue of HCC patients (n = 20) than in normal liver tissue of colorectal cancer patients with liver metastasis (n = 13) (P = 0.003; Fig. 1c).
Plasma MALAT1 levels in hepatic disease patients
Plasma MALAT1 levels in hepatic disease patients (1.10 ± 0.82, median 0.86) were significantly higher than those in healthy controls (P = 0.005; Fig. 2a), and were also significantly lower than those in HCC patients (P = 0.005; Fig. 2a).
Figure 2.
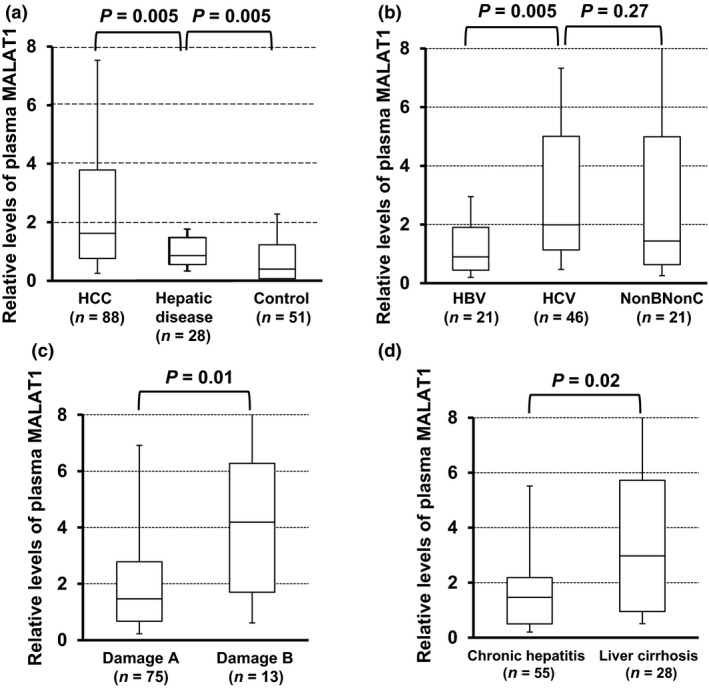
Plasma metastasis‐associated lung adenocarcinoma transcript 1 (MALAT1) levels in patients with hepatocellular carcinoma (HCC) and hepatic disease. (a) Plasma MALAT1 levels in HCC patients (n = 88), hepatic disease patients (n = 28), and healthy controls (n = 51) were evaluated by the Mann–Whitney U‐test. (b–d) Plasma MALAT1 levels in HCC patients with hepatitis B virus (HBV) infection, hepatitis C virus (HCV) infection, or hepatitis with neither (NonBNonC) (b), with liver damage A or B (c), and with chronic hepatitis or liver cirrhosis (d) were evaluated by the Mann–Whitney U‐test. Upper and lower limits of the box plots and the line inside the boxes indicate the 75th and 25th percentiles and the median, respectively.
Subgroup analysis of plasma MALAT1 level in HCC patients
Plasma MALAT1 levels in HCC patients with hepatitis B virus infection were significantly lower than those with hepatitis C virus infection (P = 0.005; Fig 2b). Plasma MALAT1 levels in HCC patients with liver damage B or liver cirrhosis were significantly elevated (P = 0.01 or 0.02, respectively; Fig. 2c,d).
Characteristics of each group
Patients with HCC were slightly older and more frequently accompanied with liver cirrhosis due to a viral infection (Tables 1 and 2). However, biochemical parameters, especially in aspartate aminotransferase, alanine aminotransferase, albumin, and platelets, were growing progressively and significantly worse in hepatic disease and HCC patients (Table 3).
Diagnostic utility of plasma MALAT1
In an ROC analysis between HCC and hepatic disease patients, the cut‐off value of plasma MALAT1 was 1.60 and the AUC was 0.66 (Fig. 3a). Table 1 shows the relationships between plasma MALAT1 levels and clinicopathological features in HCC patients based on the cut‐off value (=1.60). Plasma MALAT1 levels were correlated with gender (P = 0.03) and liver damage classification (P = 0.04), and slightly associated with the Child–Pugh score (P = 0.08); however, no other significant relationships were found, including measurements of AFP or PIVKAII (P = 0.42 and 0.35, respectively; Fig. 3b). Sensitivity and specificity for the detection of HCC with the combination of plasma MALAT1, AFP, and PIVKAII were 88.6% and 75%, respectively (Fig. 3c). This combination was more useful for the diagnosis of HCC than the results obtained when they were used alone.
Figure 3.
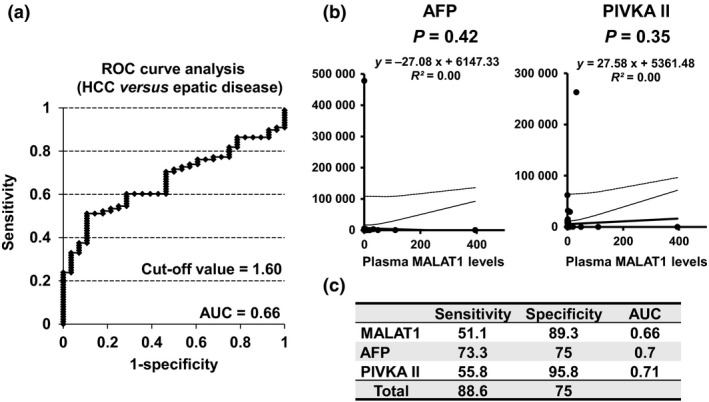
Relationship between plasma metastasis‐associated lung adenocarcinoma transcript 1 (MALAT1) levels and tumor markers. (a) Receiver–operator curve (ROC) analysis of plasma MALAT1 levels in patients with hepatocellular carcinoma (HCC) and hepatic disease. The value of the area under the curve was 0.66 and the cut‐off value was 1.60. (b) Correlations between serum α‐fetoprotein (AFP) and protein induced by vitamin K absence II (PIVKAII) were examined using Spearman's correlation test. (c) The sensitivity and specificity of MALAT1, AFP, and PIVKAII for the detection of HCC in hepatic disease patients are shown. Sensitivity and specificity with the combination of these three parameters were 88.6% and 75%, respectively.
Discussion
Recent studies have shown that MALAT1 played multiple roles in normal and cancerous tissues.14, 15 The expression of MALAT1 is known to be regulated by various molecules, such as TDP‐4318 and DGCR8,19 and is upregulated not only in lung cancer, but also in breast, pancreas, colon, prostate, and liver cancers.14 It has been shown to interact with some molecules, such as SRSF20 and Pc2,21 and alter the pattern of alternative splicing.22 Previous studies suggested that MALAT1 was important for cancer progression, especially metastasis,15, 23 however, lncRNAs, including MALAT1, have recently been implicated in the process of liver regeneration.24, 25 Xu et al.24 reported that lncRNA promoted cell cycle progression and accelerated hepatocyte proliferation during liver regeneration. Yamamoto et al.25 found that lncRNA‐H19 was involved in hepatocyte proliferation in rats and mice.
In the present study, we quantified plasma MALAT1 levels, and confirmed that these levels were progressively and significantly elevated in hepatic disease and HCC patients (Figs 1a and 2a). Our study is the first to examine the potential diagnostic utility of plasma MALAT1 in HCC patients. The expression of MALAT1 in HCC tissue was slightly higher than that in paired non‐cancerous liver tissues, but not significantly (Fig. 1b), whereas its expression in non‐cancerous liver tissue of HCC patients was significantly higher than that in normal liver tissue of colorectal cancer patients (Fig. 1c).
Consistent with our results, Luo et al.26 reported that the expression of MALAT1 was upregulated in HCC and paired cirrhotic liver tissues adjacent to tumors in HCC patients, but not in normal liver tissues. These findings indicate that HCC and adjacent non‐cancerous liver tissues have a considerable overlap in terms of MALAT1 expression and that plasma MALAT1 may be derived from not only HCC tissues but also damaged hepatocytes due to hepatitis viral infection, steatosis, and other hepatic diseases. The coordinated regulation of MALAT1 in HCC and adjacent non‐cancerous liver tissues may show a common set of biological alterations.
Plasma MALAT1 levels in HCC patients with liver damage B or liver cirrhosis were significantly elevated (Fig. 2b,c). These results suggest that plasma MALAT1 levels are affected by the presence of liver damage. Unfortunately we could not examine the liver tissues of hepatic disease patients without HCC, therefore it remains unclear whether extreme elevation of tissue or plasma MALAT1 level in HCC patients are the result of liver damage or development of HCC. Although cirrhosis was more frequently observed in HCC patients (Table 1), liver damage or biochemical parameters were not so worse only in HCC patients (Tables 2 and 3). Plasma MALAT1 levels were also elevated in hepatic disease patients compared to healthy controls (Fig. 2a). Therefore, we considered that liver damage would elevate tissue and plasma MALAT1 levels, but development of HCC would also dramatically elevate them.
Plasma and tissue MALAT1 levels would be progressively elevated in association with liver damage and development of HCC. Puthanveeti et al.27 showed that MALAT1 regulated inflammatory pathways involving inflammatory cytokines in diabetes. Liu et al.28 also reported that a variant genotype of the single nucleotide polymorphism rs619586 in MALAT1 was significantly protective against the risk of HCC in never‐drinkers. Therefore, the upregulation of MALAT1 in non‐cancerous liver tissues of patients with hepatic disease may play a significant role in the development of primary hepatic tumors. Further studies are warranted to elucidate the molecular mechanisms underlying the functions of MALAT1 and potential therapeutic targets for HCC.
Alpha‐fetoprotein has been reported to be elevated in benign chronic liver disease without HCC29, 30, 31 or in the regeneration of liver tissues, especially after liver damage.32, 33 Both AFP and PIVKAII are commonly used for the clinical diagnosis of HCC; however, the percentage of false‐negative results range from 10% to 50%.34, 35 A correlation was not previously observed between AFP and PIVKAII levels, and each marker was found to increase independently.34, 36 Therefore, concurrent measurements of both markers will be more effective in the diagnosis of HCC.37
We herein found no correlation between plasma MALAT1 levels and either AFP or PIVKA‐II (Fig. 3b). The combination of plasma MALAT1 levels with AFP and PIVKAII is considered to be more advantageous for the diagnosis of HCC (Fig. 3c), because plasma MALAT1 levels were significantly higher in HCC patients than in hepatic disease patients (Fig. 2a). The false‐negative rate was lower in the triple combination (11.4%) than in the combination of AFP and PIVKAII (18.2%). The retrospective analysis of a relatively small case series was a limitation of the present study, and our results require confirmation involving additional studies on a larger cohort of patients.
In summary, the roles of MALAT1 in liver damage or development of HCC need to be elucidated in more detail, but the plasma MALAT1 level is associated with liver damage and has clinical utility for predicting development of HCC. Additional studies are needed to evaluate the roles of MALAT1 in liver carcinogenesis.
Disclosure Statement
The authors have no conflict of interest.
Supporting information
Fig S1. Concentration of total RNA in plasma samples. (a) Concentration of total RNA and plasma metastasis‐associated lung adenocarcinoma transcript 1 (MALAT1) levels in selected hepatocellular carcinoma patients and healthy controls. Concentrations of total RNA in both groups were evaluated (Mann–Whitney U‐test). The upper and lower limits of the box plots and the line inside the boxes indicate the 75th and 25th percentiles and the median, respectively. (b,c) Correlations between concentration of total RNA and plasma MALAT1 level were examined using Spearman's correlation test.
Acknowledgments
This study was partially supported by a Grant‐in‐Aid for Scientic Research (No. 25860412) (to H Konishi) from the Japan Society for the Promotion of Science.
Cancer Sci 107 (2016) 149–154
Funding Information
This work was partially supported by Japan Society for the Promotion of the Science.
References
- 1. Bosch FX, Ribes J, Diaz M, Cleries R. Primary liver cancer: worldwide incidence and trends. Gastroenterology 2004; 127: S5–16. [DOI] [PubMed] [Google Scholar]
- 2. Wu CC, Cheng SB, Ho WM, Chen JT, Liu TJ, P'eng FK. Liver resection for hepatocellular carcinoma in patients with cirrhosis. Br J Surg 2005; 92: 348–55. [DOI] [PubMed] [Google Scholar]
- 3. Chen XP, Qiu FZ, Wu ZD, Zhang ZW, Huang ZY, Chen YF. Long‐term outcome of resection of large hepatocellular carcinoma. Br J Surg 2006; 93: 600–6. [DOI] [PubMed] [Google Scholar]
- 4. Tung‐Ping Poon R, Fan ST, Wong J. Risk factors, prevention, and management of postoperative recurrence after resection of hepatocellular carcinoma. Ann Surg 2000; 232: 10–24. [DOI] [PMC free article] [PubMed] [Google Scholar]
- 5. Costa FF. Non‐coding RNAs: new players in eukaryotic biology. Gene 2005; 357: 83–94. [DOI] [PubMed] [Google Scholar]
- 6. Lu J, Getz G, Miska EA et al MicroRNA expression profiles classify human cancers. Nature 2005; 435: 834–38. [DOI] [PubMed] [Google Scholar]
- 7. Jopling CL, Yi M, Lancaster AM, Lemon SM, Sarnow P. Modulation of hepatitis C virus RNA abundance by a liver‐specific MicroRNA. Science 2005; 309: 1577–81. [DOI] [PubMed] [Google Scholar]
- 8. Bartel DP. MicroRNAs: genomics, biogenesis, mechanism, and function. Cell 2004; 116: 281–97. [DOI] [PubMed] [Google Scholar]
- 9. Morimura R, Komatsu S, Ichikawa D et al Novel diagnostic value of circulating miR‐18a in plasma of patients with pancreatic cancer. Br J Cancer 2011; 105: 1733–40. [DOI] [PMC free article] [PubMed] [Google Scholar]
- 10. Konishi H, Ichikawa D, Komatsu S et al Detection of gastric cancer‐associated microRNAs on microRNA microarray comparing pre‐ and post‐operative plasma. Br J Cancer 2012; 106: 740–47. [DOI] [PMC free article] [PubMed] [Google Scholar]
- 11. Guttman M, Amit I, Garber M et al Chromatin signature reveals over a thousand highly conserved large non‐coding RNAs in mammals. Nature 2009; 458: 223–27. [DOI] [PMC free article] [PubMed] [Google Scholar]
- 12. Gupta RA, Shah N, Wang KC et al Long non‐coding RNA HOTAIR reprograms chromatin state to promote cancer metastasis. Nature 2010; 464: 1071–76. [DOI] [PMC free article] [PubMed] [Google Scholar]
- 13. Panzitt K, Tschernatsch MM, Guelly C et al Characterization of HULC, a novel gene with striking upregulation in hepatocellular carcinoma, as noncoding RNA. Gastroenterology 2007; 132: 330–42. [DOI] [PubMed] [Google Scholar]
- 14. Lin R, Maeda S, Liu C, Karin M, Edgington TS. A large noncoding RNA is a marker for murine hepatocellular carcinomas and a spectrum of human carcinomas. Oncogene 2007; 26: 851–58. [DOI] [PubMed] [Google Scholar]
- 15. Ji P, Diederichs S, Wang W et al MALAT‐1, a novel noncoding RNA, and thymosin beta4 predict metastasis and survival in early stage non‐small cell lung cancer. Oncogene 2003; 22: 8031–41. [DOI] [PubMed] [Google Scholar]
- 16. Sobin LH, Gospodarowicz MK, Wittekind C. TNM Classification of Malignant Tumours, 7th edn Hoboken: Wiley‐Blackwell, 2010; 30–8. [Google Scholar]
- 17. Arita T, Ichikawa D, Konishi H et al Circulating long non‐coding RNAs in plasma of patients with gastric cancer. Anticancer Res 2013; 33: 3185–93. [PubMed] [Google Scholar]
- 18. Polymenidou M, Lagier‐Tourenne C, Hutt KR et al Long pre‐mRNA depletion and RNA missplicing contribute to neuronal vulnerability from loss of TDP‐43. Nat Neurosci 2011; 14: 459–68. [DOI] [PMC free article] [PubMed] [Google Scholar]
- 19. Macias S, Plass M, Stajuda A, Michlewski G, Eyras E, Cáceres JF. DGCR8 HITS‐CLIP reveals novel functions for the Microprocessor. Nat Struct Mol Biol 2012; 19: 760–66. [DOI] [PMC free article] [PubMed] [Google Scholar]
- 20. Tripathi V, Ellis JD, Shen Z et al The nuclear‐retained noncoding RNA MALAT1 regulates alternative splicing by modulating SR splicing factor phosphorylation. Mol Cell 2010; 39: 925–38. [DOI] [PMC free article] [PubMed] [Google Scholar]
- 21. Yang L, Lin C, Liu W et al ncRNA‐ and Pc2 methylation‐dependent gene relocation between nuclear structures mediates gene activation programs. Cell 2011; 147: 773–88. [DOI] [PMC free article] [PubMed] [Google Scholar]
- 22. Gutschner T, Hammerle M, Diederichs S. MALAT1 – a paradigm for long noncoding RNA function in cancer. J Mol Med 2013; 91: 791–801. [DOI] [PubMed] [Google Scholar]
- 23. Schmidt LH, Spieker T, Koschmieder S et al The long noncoding MALAT‐1 RNA indicates a poor prognosis in non‐small cell lung cancer and induces migration and tumor growth. J Thorac Oncol 2011; 6: 1984–92. [DOI] [PubMed] [Google Scholar]
- 24. Xu D, Yang F, Yuan JH et al Long noncoding RNAs associated with liver regeneration 1 accelerates hepatocyte proliferation during liver regeneration by activating Wnt/beta‐Catenin signaling. Hepatology 2013; 58: 739–51. [DOI] [PubMed] [Google Scholar]
- 25. Yamamoto Y, Nishikawa Y, Tokairin T, Omori Y, Enomoto K. Increased expression of H19 non‐coding mRNA follows hepatocyte proliferation in the rat and mouse. J Hepatol 2004; 40: 808–14. [DOI] [PubMed] [Google Scholar]
- 26. Luo JH, Ren B, Keryanov S et al Transcriptomic and genomic analysis of human hepatocellular carcinomas and hepatoblastomas. Hepatology 2006; 44: 1012–24. [DOI] [PMC free article] [PubMed] [Google Scholar]
- 27. Puthanveetil P, Chen S, Feng B, Gautam A, Chakrabarti S. Long non‐coding RNA MALAT1 regulates hyperglycaemia induced inflammatory process in the endothelial cells. J Cell Mol Med 2015; 19: 1418–25. [DOI] [PMC free article] [PubMed] [Google Scholar]
- 28. Liu Y, Pan S, Liu L et al A genetic variant in long non‐coding RNA HULC contributes to risk of HBV‐related hepatocellular carcinoma in a Chinese population. PLoS ONE 2012; 7: e35145. [DOI] [PMC free article] [PubMed] [Google Scholar]
- 29. Chen TM, Huang PT, Tsai MH et al Predictors of alpha‐fetoprotein elevation in patients with chronic hepatitis C, but not hepatocellular carcinoma, and its normalization after pegylated interferon alfa 2a‐ribavirin combination therapy. J Gastroenterol Hepatol 2007; 22: 669–75. [DOI] [PubMed] [Google Scholar]
- 30. Tai WC, Hu TH, Wang JH et al Clinical implications of alpha‐fetoprotein in chronic hepatitis C. J Formos Med Assoc 2009; 108: 210–18. [DOI] [PubMed] [Google Scholar]
- 31. Silver HK, Gold P, Shuster J, Javitt NB, Freedman SO, Finlayson ND. Alpha(1)‐fetoprotein in chronic liver disease. N Engl J Med 1974; 291: 506–8. [DOI] [PubMed] [Google Scholar]
- 32. Yang SS, Cheng KS, Lai YC et al Decreasing serum alpha‐fetoprotein levels in predicting poor prognosis of acute hepatic failure in patients with chronic hepatitis B. J Gastroenterol 2002; 37: 626–32. [DOI] [PubMed] [Google Scholar]
- 33. Horn KD, Wax P, Schneider SM et al Biomarkers of liver regeneration allow early prediction of hepatic recovery after acute necrosis. Am J Clin Pathol 1999; 112: 351–57. [DOI] [PubMed] [Google Scholar]
- 34. Cui R, He J, Zhang F et al Diagnostic value of protein induced by vitamin K absence (PIVKAII) and hepatoma‐specific band of serum gamma‐glutamyl transferase (GGTII) as hepatocellular carcinoma markers complementary to alpha‐fetoprotein. Br J Cancer 2003; 88: 1878–82. [DOI] [PMC free article] [PubMed] [Google Scholar]
- 35. Nguyen MH, Garcia RT, Simpson PW, Wright TL, Keeffe EB. Racial differences in effectiveness of alpha‐fetoprotein for diagnosis of hepatocellular carcinoma in hepatitis C virus cirrhosis. Hepatology 2002; 36: 410–17. [DOI] [PubMed] [Google Scholar]
- 36. Tsai SL, Huang GT, Yang PM, Sheu JC, Sung JL, Chen DS. Plasma des‐gamma‐carboxyprothrombin in the early stage of hepatocellular carcinoma. Hepatology 1990; 11: 481–88. [DOI] [PubMed] [Google Scholar]
- 37. Ishii M, Gama H, Chida N et al Simultaneous measurements of serum alpha‐fetoprotein and protein induced by vitamin K absence for detecting hepatocellular carcinoma. South Tohoku District Study Group. Am J Gastroenterol 2000; 95: 1036–40. [DOI] [PubMed] [Google Scholar]
Associated Data
This section collects any data citations, data availability statements, or supplementary materials included in this article.
Supplementary Materials
Fig S1. Concentration of total RNA in plasma samples. (a) Concentration of total RNA and plasma metastasis‐associated lung adenocarcinoma transcript 1 (MALAT1) levels in selected hepatocellular carcinoma patients and healthy controls. Concentrations of total RNA in both groups were evaluated (Mann–Whitney U‐test). The upper and lower limits of the box plots and the line inside the boxes indicate the 75th and 25th percentiles and the median, respectively. (b,c) Correlations between concentration of total RNA and plasma MALAT1 level were examined using Spearman's correlation test.