

Abstract
A clear consensus does not exist about whether the initial dose of gemcitabine, an essential anticancer antimetabolite, should be reduced in patients with liver dysfunction. Adult patients with biliary tract or pancreatic cancer were divided into three groups according to whether they had mild, moderate, or severe liver dysfunction, evaluated on the basis of serum bilirubin and liver transaminase levels at baseline. As anticancer treatment, gemcitabine at a dose of 800 or 1000 mg/m2 was given as an i.v. infusion once weekly for 3 weeks of a 4‐week cycle. The patients were prospectively evaluated for adverse events during the first cycle, and the pharmacokinetics of gemcitabine and its inactive metabolite, difluorodeoxyuridine, were studied to determine the optimal initial dose of gemcitabine as monotherapy according to the severity of liver dysfunction. A total of 15 patients were studied. Liver dysfunction was mild in one patient, moderate in six, and severe in eight. All 15 patients had been undergoing biliary drainage for obstructive jaundice when they received gemcitabine. Grade 3 cholangitis developed in one patient with moderate liver dysfunction who received gemcitabine at the dose level of 1000 mg/m2. No other patients had severe treatment‐related adverse events resulting in the omission or discontinuation of gemcitabine treatment. The plasma concentrations of gemcitabine and difluorodeoxyuridine were similar among the groups. An initial dose reduction of gemcitabine as monotherapy for the treatment of biliary tract or pancreatic cancers is not necessary for patients with hyperbilirubinemia, provided that obstructive jaundice is well managed. (Clinical trial registration no. UMIN000005363.)
Keywords: Drug dosage, gemcitabine, hyperbilirubinemia, liver dysfunction, obstructive jaundice
Gemcitabine, a fluorinated analogue of deoxycytidine, requires intracellular uptake and phosphorylation to exert its pharmacological activity as an anticancer antimetabolite. Besides the intracellular active metabolite, more than 90% of the given dose of gemcitabine is immediately inactivated to difluorodeoxyuridine (dFdU), another major metabolite, by plasma and liver cytidine deaminase.1 Clinically, gemcitabine is an essential treatment for many types of cancer, including biliary tract and pancreatic cancers. The standard initial dose of gemcitabine for patients with normal liver function is 1000 mg/m2 given as an i.v. infusion over the course of 30 min on days 1, 8, and 15 of a 28‐day cycle.
Patients with biliary tract or pancreatic cancers frequently have obstructive hyperbilirubinemia and jaundice caused by the primary lesions. Because patients with liver laboratory abnormalities such as hyperbilirubinemia and increased liver transaminase (aspartate aminotransferase [AST]/alanine aminotransferase [ALT]) levels may have impaired capacity to metabolize drugs that are primarily metabolized in the liver, leading to increased drug concentrations and potentially severe toxicity, it is generally accepted that the initial dose of anticancer chemotherapy should be reduced. Dose reduction of gemcitabine has also been recommended for patients with liver dysfunction on the basis of previous studies carried out by the Cancer and Leukemia Group B (CALGB).2, 3, 4 However, a clear consensus has yet to be reached on whether the initial dose of gemcitabine should be reduced in patients with liver dysfunction.5, 6 Given that major drug‐metabolizing enzymes in the liver, such as cytochrome P450 and UDP‐glucuronosyltransferase, are not involved in the metabolic pathways of gemcitabine, it is unlikely that liver dysfunction would alter the metabolic capacity of gemcitabine. We therefore hypothesized that use of a reduced dose of gemcitabine would not be necessary, even in patients with severe liver dysfunction.
In this study, the optimal initial dose of gemcitabine as monotherapy was determined in patients with liver dysfunction who received the drug for the treatment of biliary tract or pancreatic cancer. We also studied the pharmacokinetics of gemcitabine and its inactive metabolite, dFdU.
Patients and Methods
The primary objective of this study was to determine the optimal dose of gemcitabine as monotherapy for patients with biliary tract or pancreatic cancer who had mild, moderate, or severe liver dysfunction. The optimal dose was determined primarily on the basis of treatment‐related adverse events occurring during the first cycle of treatment. This study protocol (UMIN000005363) was approved by our Institutional Review Board and was carried out in accordance with the Declaration of Helsinki.
Patients
Eligible patients were aged 20 years or older and had histologically/cytologically confirmed or radiologically diagnosed biliary tract or pancreatic cancer for which gemcitabine monotherapy was indicated as the standard of care. Patients with mild or moderate liver dysfunction also had to have an Eastern Cooperative Oncology Group performance status of 0, 1, or 2, and those with severe liver dysfunction had to have an performance status of 0 or 1. In addition, patients were required to have adequate organ functions, including hematologic function (absolute neutrophil count, ≥1.5 × 10⁹/L; platelets, ≥100 × 109/L; hemoglobin, ≥90 g/L) and renal function (serum creatinine, ≤1.5 mg/dL). Patients with biliary obstruction for which a stent or a drainage tube had been placed were also eligible. Patients serologically positive for hepatitis B surface antigen and/or hepatitis C antibody were excluded.
Study design
The patients were divided into three groups according to whether they had mild, moderate, or severe liver dysfunction, evaluated on the basis of serum total bilirubin and AST/ALT levels at baseline according to the National Cancer Institute Organ Dysfunction Working Group criteria for liver dysfunction7 and were enrolled prospectively. Patients with mild liver dysfunction had to have a bilirubin level of less than the institutional upper limit of normal (ULN, 1.2 mg/dL) with AST/ALT levels higher than the ULN (AST, 33 IU/L; ALT, 27 IU/L) or a bilirubin level 1.0–1.5‐fold higher than the ULN with any AST/ALT levels. Patients with moderate liver dysfunction had to have a bilirubin level 1.5–3.0‐fold higher than the ULN with any AST/ALT levels; patients with severe liver dysfunction had to have a bilirubin level 3.0–10.0‐fold higher than the ULN with any AST/ALT levels.
Gemcitabine was given as an i.v. infusion over the course of 30 min at a dose of 800 or 1000 mg/m2 on days 1, 8, and 15 of a 28‐day cycle. Gemcitabine was administered on an outpatient basis, except for the first few days when blood samples were taken for pharmacokinetic analysis after the patients had been admitted. As antiemetic prophylaxis, the patients generally received dexamethasone alone, which was sometimes combined with a serotonin 5‐HT3 receptor antagonist as required. Other supportive treatments and clinical evaluations in individual patients were essentially left to the discretion of the treating physicians.
Each dose level of gemcitabine required at least three patients, with starting dose levels of 1000 mg/m2 for patients with mild liver dysfunction and 800 mg/m2 and then 1000 mg/m2 for patients with moderate and severe liver dysfunction. An additional one to three patients could be studied, given the heterogeneous patient population of this study. Another dose level of 650 mg/m2 was planned if required. The optimal dose was defined as the dose level at which none or only one of the three to six patients had dose‐limiting toxicity (DLT) during the first cycle. If the patients with severe liver dysfunction tolerated the dose levels of 800 and 1000 mg/m2, these levels were also considered tolerable by patients with moderate liver dysfunction.
Adverse events were evaluated according to the Common Terminology Criteria for Adverse Events, version 4.0, every week until the second cycle began. The following treatment‐related adverse events were defined as DLT: hyperbilirubinemia >3.0‐fold higher than the ULN for longer than 7 days in patients with mild liver dysfunction; hyperbilirubinemia >3.0‐fold higher than the ULN as well as >1.5‐fold higher than the baseline level for longer than 7 days in patients with moderate liver dysfunction; and hyperbilirubinemia >1.5‐fold higher than the baseline level for longer than 7 days in patients with severe liver dysfunction; and elevated AST/ALT levels >5.0‐fold higher than the ULN in patients with baseline levels of less than the ULN or >5.0‐fold higher than the baseline levels in patients with baseline level higher than the ULN. Hyperbilirubinemia and elevated AST/ALT levels that were caused by accidental obstruction of a stent or a drainage tube were not included as DLT. Other treatment‐related adverse events that were considered DLT included: grade 4 neutropenia for longer than 7 days; febrile neutropenia (absolute neutrophil count <1.0 × 10⁹/L and body temperature ≥38.5°C); grade 3 thrombocytopenia that required platelet transfusion; grade 3 nausea, vomiting, or both for longer than 7 days despite antiemetic treatment; and any other grade 4 hematologic or grade 3 or higher non‐hematologic toxicity, except for transient laboratory abnormalities that resolved within 7 days.
Pharmacokinetic sample acquisition
Blood samples for pharmacokinetic analysis were obtained from the patients before starting the gemcitabine infusion, at the end of the infusion, and then at 15, 30, 60, 90, 120, and 240 min. At each time point, 5 mL blood was collected into heparinized tubes preloaded with 50 μL of a 10‐mg/mL solution of tetrahydrouridine (Calbiochem‐Novabiochem, La Jolla, CA, USA), a cytidine deaminase inhibitor, and the sample was centrifuged immediately. The plasma was stored at −20°C until analysis.
Chemicals
Gemcitabine hydrochloride, sodium octyl sulfonate, and 2′‐deoxycitidine were obtained from Sigma‐Aldrich Japan (Tokyo, Japan), and the gemcitabine metabolite dFdU was from Toronto Research Chemicals Novartis Pharma (Toronto, Canada). All chemicals and solvents were of the highest grade commercially available.
Measurements of unchanged gemcitabine and dFdU
Concentrations of unchanged gemcitabine and dFdU were measured using a reverse‐phase HPLC method, with minor modifications.8 Briefly, a 200‐μL aliquot of plasma sample was mixed with 20 μL of 0.82 M perchloric acid and 50 μL of 500 μM 2′‐deoxycytidine (internal standard) in a vortex mixer. The mixture was centrifuged at 16 000 g and 4°C for 5 min, and a 100‐μL aliquot of the supernatant was injected into an HPLC system (7000 series; Hitachi, Tokyo, Japan), equipped with a TSK‐gel ODS‐120T analytical column (4.6 × 250 mm, 4 μm; Tosoh, Tokyo, Japan). High‐performance liquid chromatography was carried out at 40°C at a flow rate of 1.0 mL/min. The mobile phase consisted of 50 mM sodium phosphate buffer (pH 2.9) and 3 mM sodium octyl sulfonate/acetonitrile (90:10). A 25‐min run was carried out isocratically. The eluent was monitored at 267 nm. Concentrations of gemcitabine and dFdU were quantified by comparing the respective peak areas on a chromatogram with that of the internal standard 2′‐deoxycytidine. The quantification limits were 2.0 μM for both gemcitabine and dFdU. The intra‐ and inter‐assay coefficients of variation were 10.3% and 13.1% for gemcitabine and 19.5% and 11.4% for dFdU, respectively.
The plasma concentration–time data for gemcitabine and dFdU were analyzed with a standard non‐compartmental method using WinNonlin version 5.2 software (Pharsight, Mountain View, CA, USA). Areas under the plasma concentration–time curves (AUC, μM h) of gemcitabine and dFdU from time zero to the last sampling time were calculated with the linear trapezoidal rule (until the peak plasma concentration) and linear‐log trapezoidal rule (until the last quantifiable concentration). Gemcitabine clearance (L/h) was obtained by dividing the given dose of gemcitabine (μmol/patient, calculated on the basis of a molecular weight of 263.198) by the AUC, with extrapolation to infinity (dose/AUC).
Statistical analyses
Differences in pharmacokinetic parameters among the groups were tested with the use of t‐tests, using IBM spss Statistics, version 22 (SPSS, Chicago, IL, USA). P‐values of less than 0.05 were considered to indicate statistical significance.
Results
Between January 2011 and June 2014, a total of 15 patients were studied. Liver dysfunction was mild in one patient, moderate in six, and severe in eight (Table 1). Most patients had biliary tract cancer. All 15 patients had been undergoing biliary drainage for obstructive jaundice. Retrospectively, the median bilirubin level before the onset of biliary drainage was 16.5 mg/dL (range, 3.9–24.2), and the bilirubin level declined by 3.0 mg/dL per week on average (range, −7.5 to 0.2) at the time of study enrolment. Patient accrual was becoming poor because of a shift in the standard treatment of biliary tract cancer towards cisplatin‐based combination chemotherapy, especially in patients with mild liver dysfunction. In Japan, cisplatin was approved for the treatment of biliary tract cancer in February 2012, following the public knowledge‐based application in August 2011.
Table 1.
Baseline characteristics of patients with biliary tract or pancreatic cancer with liver dysfunction (n = 15)
| Group | Mild (n = 1) | Moderate (n = 6) | Severe (n = 8)† | |||
|---|---|---|---|---|---|---|
| Definition | Total bilirubin | <ULN | or | 1.0–1.5 × ULN | 1.5–3.0 × ULN | 3.0–10.0 × ULN |
| AST/ALT | >ULN | Any | Any | Any | ||
| Dose level, n | ||||||
| 800 mg/m2 | – | 4 | 5† | |||
| 1000 mg/m2 | 1 | 2 | 3 | |||
| Gender, n | ||||||
| Male | 1 | 6 | 3 | |||
| Female | 0 | 0 | 5 | |||
| Median age, years (range) | 59 | 64.5 (48–80) | 63.5 (51–77) | |||
| Performance status, n | ||||||
| 0 | 1 | 4 | 3 | |||
| 1 | 0 | 2 | 5 | |||
| 2 | 0 | 0 | – | |||
| Primary site of cancer, n | ||||||
| Extrahepatic bile duct (perihilar) | 1 | 4 | 4 | |||
| Intrahepatic bile duct | 0 | 1 | 3 | |||
| Gallbladder | 0 | 1 | 0 | |||
| Pancreatic | 0 | 0 | 1 | |||
| Biliary drainage, n | ||||||
| External | 0 | 4 | 6 | |||
| Internal | 1 | 2 | 2 | |||
| Liver laboratory tests, median (range) | ||||||
| Bilirubin (mg/dL) | 1.0 | 2.9 (2.0–3.5) | 5.5 (4.7–7.0)‡ | |||
| AST (IU/L) | 61 | 47 (23–75) | 55 (40–100)‡ | |||
| ALT (IU/L) | 73 | 82 (28–147) | 70 (12–88)‡ | |||
†One patient with severe liver dysfunction was excluded from the assessment of adverse events. ‡Based on data from seven patients. –, not applicable. ALT, alanine aminotransferase; AST, aspartate aminotransferase; ULN, upper limit of normal.
Adverse events
Cholangitis developed in one patient with severe liver dysfunction who received a dose level of 800 mg/m2. This adverse event was obviously related to drainage tube dislocation, and the patient was excluded from the analysis of treatment‐related adverse events. The other 14 patients were assessable for adverse events (Table 2). Thirteen patients had no severe treatment‐related adverse events resulting in the omission or discontinuation of gemcitabine treatment. One 82‐year‐old man who had biliary tract cancer with moderate liver dysfunction received a dose level of 1000 mg/m2 and developed grade 3 cholangitis. Cholangitis developed on day 27 and resolved immediately after replacement of the drainage tube and treatment with i.v. sulbactam/cefoperazone. The causal relation to gemcitabine treatment could not be ruled out, and the event was considered a DLT. Because none of the three patients with severe liver dysfunction had treatment‐related adverse events at a dose level of 1000 mg/m2 and because the patient accrual was poor, the enrolment of further subjects was discontinued, and 1000 mg/m2 was determined to be tolerable and optimal for all the three groups.
Table 2.
Treatment‐related adverse events during the first cycle of gemcitabine treatment in patients with biliary tract or pancreatic cancer with liver dysfunction (n = 13)
| Group | Moderate (n = 6) | Severe (n = 7) | ||
|---|---|---|---|---|
| Grade 1/2 | Grade 3/4 | Grade 1/2 | Grade 3/4 | |
| 800 mg/m2, n (%) | n = 4 | n = 4 | ||
| Leucopenia | 4 (100) | 0 | 2 (50) | 1 (25) |
| Neutropenia | 1 (25) | 2 (50) | 0 | 2 (50) |
| Anemia | 1 (25) | 0 | 3 (75) | 0 |
| Thrombocytopenia | 2 (50) | 0 | 3 (75) | 0 |
| Fatigue | 3 (75) | 0 | 1 (25) | 0 |
| Anorexia | 2 (50) | 0 | 2 (50) | 0 |
| Vomiting | 0 | 0 | 1 (25) | 0 |
| Constipation | 3 (75) | 0 | 1 (25) | 0 |
| Fever | 2 (50) | 0 | 0 | 0 |
| Infection | 1 (25) | 0 | 1 (25) | 0 |
| Dysgeusia | 1 (25) | 0 | 0 | 0 |
| Dry skin | 0 | 0 | 1 (25) | 0 |
| 1000 mg/m2, n (%) | n = 2 | n = 3 | ||
| Leucopenia | 1 (50) | 0 | 3 (100) | 0 |
| Neutropenia | 1 (50) | 0 | 0 | 1 (33.3) |
| Anemia | 1 (50) | 0 | 1 (50) | 0 |
| Thrombocytopenia | 1 (50) | 0 | 2 (66.7) | 1 (33.3) |
| Fatigue | 0 | 0 | 1 (33.3) | 0 |
| Anorexia | 1 (50) | 0 | 2 (66.6) | 0 |
| Vomiting | 0 | 0 | 1 (33.3) | 0 |
| Constipation | 2 (100) | 0 | 1 (33.3) | 0 |
| Diarrhea | 0 | 0 | 1 (33.3) | 0 |
| Fever | 1 (50) | 0 | 2 (66.6) | 0 |
| Cholangitis | 0 | 1 (50)† | 1 (33.3) | 0 |
| Dysgeusia | 0 | – | 1 (33.3) | – |
†Grade 3 toxicity that was considered a dose‐limiting toxicity. One patient with mild liver toxicity had grade 1 thrombocytopenia. –, not applicable.
Pharmacokinetic analyses
All 15 patients were assessable for the pharmacokinetic analysis. Because all blood samples were obtained cautiously within 2 min of the appointed times, the planned sampling times were used to estimate the pharmacokinetic parameters (Table 3). The plasma gemcitabine concentrations appeared to be similar among the groups, whereas the plasma dFdU concentrations seemed slightly lower in the one patient with mild liver dysfunction than in the patients with moderate or severe liver dysfunction (Fig. 1). Another patient with severe liver dysfunction who received a dose level of 1000 mg/m2 showed the highest AUC (50.33 μM h) and the lowest clearance (73.76 L/h/m2) of gemcitabine with the delayed time to maximum concentration of dFdU (Fig. 1b). The patient who experienced DLT showed ordinary pharmacokinetic parameters (Table 3). At a dose level of 800 mg/m2, the plasma drug concentrations did not differ significantly between the four patients with moderate liver dysfunction and the five patients with severe liver dysfunction.
Table 3.
Pharmacokinetic parameters of gemcitabine and difluorodeoxyuridine (dFdU) in patients with biliary tract or pancreatic cancer with liver dysfunction (n = 15)
| Group | Mild | Moderate | Severe | ||
|---|---|---|---|---|---|
| 1000 mg/m2 | 800 mg/m2 | 1000 mg/m2 | 800 mg/m2 | 1000 mg/m2 | |
| n = 1 | n = 4 | n = 2 | n = 5 | n = 3 | |
| Gemcitabine | |||||
| Cmax (μM) | 53.91 | 72.13, 58.85 | |||
| Mean ± SD | 39.06 ± 10.30 | 27.42 ± 9.16 | 74.39 ± 21.05 | ||
| AUC0–last (μM h) | 20.29 | 21.85, 20.25 | |||
| Mean ± SD | 15.95 ± 6.77 | 10.95 ± 3.57 | 35.23 ± 13.65 | ||
| Clearance (L/h/m2) | 182.80 | 161.20, 180.65 | |||
| Mean ± SD | 204.98 ± 69.69 | 281.11 ± 117.97 | 110.99 ± 35.62 | ||
| dFdU | |||||
| Cmax (μM) | 98.33 | 106.79, 156.61 | |||
| Mean ± SD | 94.83 ± 15.55 | 100.23 ± 16.35 | 114.41 ± 8.61 | ||
| AUC0–last (μM h) | 157.94 | 253.65, 290.99 | |||
| Mean ± SD | 212.46 ± 22.63 | 216.15 ± 29.86 | 270.67 ± 14.99 | ||
Parameters of the patient who had a dose‐limiting toxicity are underlined. AUC, area under the plasma drug concentration–time curve for time zero to the last sampling time; Cmax, maximum concentration; SD, standard deviation.
Figure 1.
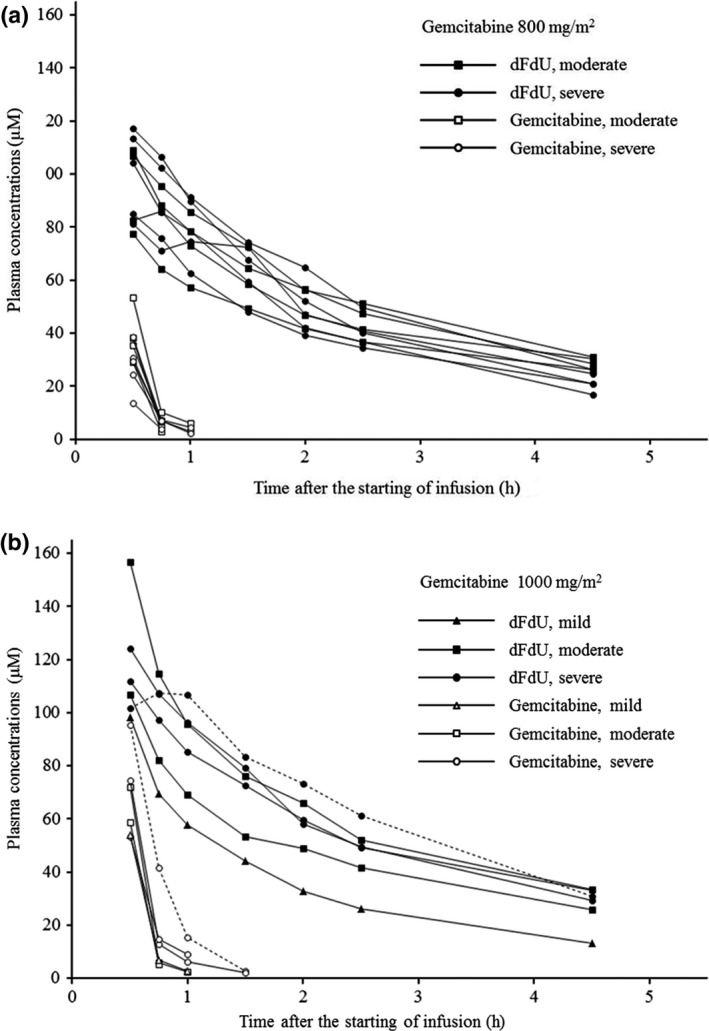
Plasma concentrations of gemcitabine (open symbols) and difluorodeoxyuridine (dFdU; closed symbols) after starting a 30‐min i.v. infusion of gemcitabine at a dose of 800 mg/m2 (a) or 1000 mg/m2 (b) in patients with mild (triangles), moderate (squares), or severe (circles) liver dysfunction. The plasma dFdU concentrations seemed slightly lower in the one patient with mild liver dysfunction (b). Another patient with severe liver dysfunction (circles with dotted line) showed the highest areas under the plasma concentration–time curve and the lowest clearance of gemcitabine with the delayed time to maximum concentration of dFdU (b).
Discussion
This study confirmed that gemcitabine monotherapy at a dose of 1000 mg/m2, the standard dose for patients with normal liver function, was tolerable in patients with biliary tract or pancreatic cancer who had mild, moderate, or even severe liver dysfunction. Although grade 3 cholangitis developed in one patient with moderate liver dysfunction who received gemcitabine at a dose level of 1000 mg/m2, no other patient had severe treatment‐related adverse events resulting in the omission or withdrawal of gemcitabine treatment. The results of this study should be interpreted with caution because all patients had obstructive jaundice and had been undergoing biliary drainage when they received gemcitabine.
Unlike the CALGB study in which hyperbilirubinemia was frequently observed after gemcitabine treatment in patients who had hyperbilirubinemia at baseline,2 the patients in this study did not have liver toxicity, but instead had hematologic toxicity, which is commonly associated with gemcitabine‐based chemotherapy. This distinct difference in toxicity between the two studies probably reflects the difference in patient backgrounds. The majority of patients in the CALGB study had hepatocellular or gastrointestinal cancers and none underwent biliary drainage with a catheter. In contrast, all patients in our study had obstructive jaundice that was well managed when they received gemcitabine. Therefore, the results of our study cannot be simply extrapolated to patients with liver dysfunction who have extensive liver metastases and cirrhosis or other non‐malignant liver diseases. However, obstructive jaundice is a major clinical problem in patients with biliary tract or pancreatic cancers, for which gemcitabine is usually indicated, and we believe that our study provides useful suggestions for the effective management of these conditions. Another study of patients with moderate hyperbilirubinemia (bilirubin levels, mean ± SD = 5.29 ± 3.83 mg/dL) who received gemcitabine at a dose of 1000 mg/m2 by a fixed‐dose rate infusion reported that treatment was tolerable in patients with biliary tract or pancreatic cancer.5 The main type of toxicity was hematologic. Despite the use of a different infusion schedule for gemcitabine, that study also supports our suggestion that patients with liver dysfunction do not require the use of a reduced dose of gemcitabine.
The pharmacokinetic parameters in our study were comparable to those in previous studies of Japanese patients with normal liver function or non‐Japanese patients with liver dysfunction who received similar doses of gemcitabine.2, 5, 9 This finding supports our hypothesis that the ability to metabolize gemcitabine is not altered by liver dysfunction associated with laboratory test abnormalities. The apparently lower dFdU concentrations in the one patient with mild liver dysfunction might be associated with genetic and/or non‐genetic functional variations in cytidine deaminase and nucleoside transporters, instead of liver dysfunction.1, 9 In particular, the highest AUC and the lowest clearance of gemcitabine with the delayed time to maximum concentration of dFdU in one patient with severe liver dysfunction would be associated with heterozygous genotype of CDA*3, a genetic variant of cytidine deaminase, on the basis of the pharmacokinetic profile.10
We conclude that the optimal initial dose of gemcitabine as monotherapy for the treatment of biliary tract or pancreatic cancer in patients with liver dysfunction is 1000 mg/m2 and that an initial dose reduction is unnecessary even in patients who have severe hyperbilirubinemia, provided that obstructive jaundice is well managed.
Disclosure Statement
Yuichi Ando received honoraria and research funding from Yakult Honsha. The other authors have no conflicts of interest.
Acknowledgments
We thank Ms. Yuka Murasaki for her technical assistance. This work was supported in part by a Grant‐in‐Aid from the Ministry of Education, Culture, Sports, Science and Technology of Japan (Training Program for Oncology Professionals).
Cancer Sci 107 (2016) 168–172
Funding Information
Ministry of Education, Culture, Sports, Science and Technology of Japan.
References
- 1. Veltkamp SA, Pluim D, van Eijndhoven MA et al New insights into the pharmacology and cytotoxicity of gemcitabine and 2′,2′‐difluorodeoxyuridine. Mol Cancer Ther 2008; 7: 2415–25. [DOI] [PubMed] [Google Scholar]
- 2. Venook AP, Egorin MJ, Rosner GL et al Phase I and pharmacokinetic trial of gemcitabine in patients with hepatic or renal dysfunction: Cancer and Leukemia Group B 9565. J Clin Oncol 2000; 18: 2780–87. [DOI] [PubMed] [Google Scholar]
- 3. Floyd J, Mirza I, Sachs B, Perry MC. Hepatotoxicity of chemotherapy. Semin Oncol 2006; 33: 50–67. [DOI] [PubMed] [Google Scholar]
- 4. Field KM, Michael M. Part II: Liver function in oncology: towards safer chemotherapy use. Lancet Oncol 2008; 9: 1181–90. [DOI] [PubMed] [Google Scholar]
- 5. Felici A, Di Segni S, Milella M et al Pharmacokinetics of gemcitabine at fixed‐dose rate infusion in patients with normal and impaired hepatic function. Clin Pharmacokinet 2009; 48: 131–41. [DOI] [PubMed] [Google Scholar]
- 6. Teusink AC, Hall PD. Toxicities of gemcitabine in patients with severe hepatic dysfunction. Ann Pharmacother 2010; 44: 750–4. [DOI] [PubMed] [Google Scholar]
- 7. Ramalingam SS, Kummar S, Sarantopoulos J et al Phase I study of vorinostat in patients with advanced solid tumors and hepatic dysfunction: a National Cancer Institute Organ Dysfunction Working Group study. J Clin Oncol 2010; 28: 4507–12. [DOI] [PMC free article] [PubMed] [Google Scholar]
- 8. Kirstein MN, Hassan I, Guire DE et al High‐performance liquid chromatographic method for the determination of gemcitabine and 2′,2′‐difluorodeoxyuridine in plasma and tissue culture media. J Chromatogr B Analyt Technol Biomed Life Sci 2006; 835: 136–42. [DOI] [PubMed] [Google Scholar]
- 9. Sugiyama E, Kaniwa N, Kim SR et al Pharmacokinetics of gemcitabine in Japanese cancer patients: the impact of a cytidine deaminase polymorphism. J Clin Oncol 2007; 25: 32–42. [DOI] [PubMed] [Google Scholar]
- 10. Sugiyama E, Kaniwa N, Kim SR et al Population pharmacokinetics of gemcitabine and its metabolite in Japanese cancer patients: impact of genetic polymorphisms. Clin Pharmacokinet 2010; 49: 549–58. [DOI] [PubMed] [Google Scholar]