Abstract
Chemotaxis is a fundamental biological process where complex chemotactic gradients are integrated and prioritized to guide cell migration toward specific locations. To understand the mechanisms of gradient dependent cell migration, it is important to develop in vitro models that recapitulate key attributes of the chemotactic cues present in vivo. Current in vitro tools for studying cell migration are not amenable to easily study the response of neutrophils to dual gradients. Many of these systems require external pumps and complex setups to establish and maintain the gradients. Here we report a simple yet innovative microfluidic device for studying cell migration in the presence of dual chemotactic gradients through a 3-dimensional substrate. The device is tested and validated by studying the migration of the neutrophil-like cell line PLB-985 to gradients of fMLP. Furthermore, the device is expanded and used with heparinised whole blood, whereupon neutrophils were observed to migrate from whole blood towards gradients of fMLP eliminating the need for any neutrophil purification or capture steps.
Keywords: migrations, neutrophils, chemotaxis, gradients
1 Introduction
Chemotaxis, or soluble gradient dependent cell migration is fundamental to development (Wood, Faria et al. 2006), inflammation (Luster, Alon et al. 2005, Wood, Faria et al. 2006), and metastasis (Payne and Cornelius 2002). While numerous cells are involved in these processes, neutrophils, due to their high motility, are a commonly used cell model for studying chemotaxis. Considered the first responders of the immune system, neutrophils migrate robustly in response to various chemoattractant gradients. These chemoattractants can originate from a variety of sources including other neutrophils and leukocytes and from invading foreign organisms. Common examples of chemoattractants that have been shown to play a role in neutrophil migration include interleukin-8 (Kuijpers, Hakkert et al. 1992), leukotriene B4 (LTB4) (Lammermann, Afonso et al. 2013), complement 5a (Tonnesen, Smedly et al. 1984), and fMet-Lue-Phe (fMLP) (Marasco, Phan et al. 1984, Tonnesen, Smedly et al. 1984, Feng, Nagy et al. 1998). The simultaneous presence of these chemoattractants in vivo serves to guide neutrophils to the site of infection or tissue damage (Heit, Robbins et al. 2008).
To understand neutrophil function, it is important to recapitulate these complex gradients to more accurately depict in vivo migration responses in an in vitro experimental model. Bridging the space between in vivo and in vitro experimentation requires considering the types of decisions migrating cells make based on their environment. Rarely are migrating cells solely exposed to a single gradient. Rather, they are forced to choose their migration pathway based on numerous attractive and repulsive signals. Thus, while understanding how individual chemokines impact cell migration is important, understanding how the simultaneous exposure of cells to multiple gradients dictates cell migration is necessary to more closely model the complex in vivo environments. In zebrafish models, neutrophils have been shown to undergo both chemotaxis, migrating toward an injury site, and subsequent reverse migration, migrating away from the injury (Mathias, Perrin et al. 2006). Developing migration tools that are able to simultaneously expose cells to multiple distally located chemokines could add significant understanding to in vivo observations of how neutrophils behave both spatially and temporally at wounds.
Previously, researchers have successfully used the under agarose assay to study 2-D neutrophil chemotaxis in response to complex gradients (Nelson, Quie et al. 1975, Tranquillo, Zigmond et al. 1988, Foxman, Campbell et al. 1997, Foxman, Kunkel et al. 1999). In this system, wells are created in agarose and, at pre-specified locations, 100,000 purified neutrophils isolated from whole blood are placed within a single well. Chemoattractants are then placed in surrounding wells near the neutrophils. Cell migration is quantified by phase contrast imaging of the migrating population. Based on the chemoattractant well locations, users are able to study synergistic or competing chemoattractant gradients as the neutrophils migrate below the gel. While the under agarose assay has provided important information on the role of competing gradients (Foxman, Campbell et al. 1997, Foxman, Kunkel et al. 1999), similar to other macroscale techniques, the under-agarose assay does not form well-characterized gradients (Lauffenburger and Zigmond 1981), is not amenable to longer migration studies (Nelson, Quie et al. 1975), and requires significant quantities of purified neutrophils. Furthermore, migrating neutrophils do not undergo 3-D migration experienced by cells in vivo.
To address these shortcomings, researchers have developed microfluidic assays to study neutrophil chemotaxis in spatiotemporally controlled gradients (Saadi, Rhee et al. 2007, Abhyankar, Toepke et al. 2008, Haessler, Kalinin et al. 2009, Butler, Ambravaneswaran et al. 2010, Keenan, Frevert et al. 2010, Haessler, Pisano et al. 2011, Kim and Haynes 2012, Sackmann, Berthier et al. 2012, Hoang, Jones et al. 2013, Jones, Hoang et al. 2014, Sackmann, Berthier et al. 2014). In clinical studies involving burn patients, microfluidic assays have provided a platform for measuring neutrophil migration as a predictor of clinical outcome (Butler, Ambravaneswaran et al. 2010). Unfortunately many of these microfluidic techniques require syringe pumps making them less accessible and less adaptable for biology researchers (Sackmann, Fulton et al. 2014). More recently, the Microtechnology Medicine Biology laboratory has developed a Kit-On-A-Lid-Assay (KOALA) for studying neutrophil migration from a drop of whole blood (Sackmann, Berthier et al. 2012). The KOALA device has been used to distinguish neutrophils from asthmatic and non-asthmatic individuals based on chemotaxis read-outs (Sackmann, Berthier et al. 2014). While this assay is easy to use and highly informative, it is unable to form dual gradients, and therefore it does not recapitulate the complex gradients present in vivo.
Here we report a new microfluidic device termed the “PI channel”, for studying chemotaxis through a 3-D environment in the presence of dual gradients. The PI channel includes a cell placement channel that is perpendicular to a chemoattractant containing gel. The gel then serves as the 3-D platform for cellular migration from the cell placement channel. Within this device, the generated gradients are formed within close proximity, therefore modelling complex in vivo gradients. More importantly, this device models neutrophil extravasation by using the basement membrane-like substrate Matrigel® within the gel region to maintain a stable gradient, eliminating the need for any manipulation of the device after setup.
To test the PI channel, we measured the chemotaxis of the commonly used neutrophil-like cell-line PLB-985 (PLB) (Tucker, Lilly et al. 1987, Cavnar, Berthier et al. 2011) in the presence of single or dual fMLP gradients. Upon testing and confirming a migration response of the cell line to LTB4 as well, the migration experiments were expanded to include competing gradients of fMLP and LTB4. To open potential applications of the assay, we also used whole blood. Heparinized whole blood was placed within the cell channel, and neutrophils were induced to migrate from the whole blood source into the chemoattractant containing gel. The ability to study neutrophils directly from whole blood eliminates the need for added sample preparation steps including the isolation and purification of neutrophils that is required by the majority of neutrophil migration assays reducing the overall sample volume required to a few microliters of blood. By facilitating direct migration of neutrophils from whole blood, the PI channel enables the study of neutrophil extravasation in response to dual chemotactic gradients in a 3-D migration assay.
2 Materials and Methods
2.1 Cell Culture and Differentiation
The human, immature myeloid cell line PLB-985 (gift from C. Parent, National Cancer Institute, National Institutes of Health, Bethesda, Maryland) was used for all cell line based migration assays. Cells were cultured in RPMI-1640-glutamine base media (Corning cellgro®, Manassas, VA) with 10% fetal bovine serum (FBS) (Gibco®) and 1% penicillin streptomycin (Pen. Strep.)(Life Technologies Gibco®, Grand Island, NY). The cell line was maintained in sterile conditions at 37°C while in the presence of 5% CO2. Differentiation of the cell line into terminally mature neutrophils was performed according to Cavnar et al.(Cavnar, Berthier et al. 2011). In summary, six days prior to use, an isolated population of 1.3 million cells was placed in a T25 tissue culture flask containing 10 mLs of the culture media to which 130 µL sterile Dimethyl sulfoxide (DMSO)(Sigma Aldrich, Milwaukee, WI, USA) was added. The flask then was allowed to incubate for six days resulting in a terminally mature neutrophil population.
2.2 Reagents
fMLP was obtained from Sigma Aldrich (Milwaukee, WI) and used at a concentration of 1µM. LTB4 was received from Cayman Chemical (Ann Arbor, MI) and used at a concentration of 100nM. All solutions were diluted to the desired concentration in sterile Hank’s Buffer Salt Solution (HBSS)+0.1%Bovine Serum Albumin (BSA) and resultantly contained less than 1% of the original stock suspension when used. Matrigel® was purchased from BD Biosciences (San Jose, CA) and HyClone® HBSS was obtained from Thermo Scientific.
2.3 Device Basic Preparation
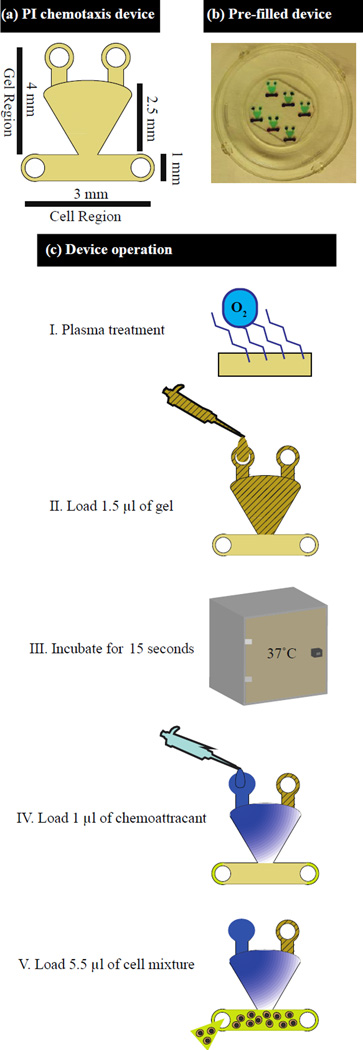
Devices were fabricated following previously described conventional soft lithography techniques (Xia and Whitesides 1998) where a master mold is used to imprint a device design into the polymer Sylgaard 184 polydimethylsiloxane (PDMS)(Dow Corning, Midland, MI). To apply this technique, UV light is used to expose SU-8 photoresist (Microchem, Newton, MA) through patterned photomasks (Imagesetter, Madison, WI). This process is repeated to build up features on the surface of the coated wafer into the desired design. Upon completion of the master, PDMS was mixed at a 10:1 ratio with curing agent, degassed for thirty to forty minutes, poured on the master, and baked at 80°C for four hours. The resultant devices could then be removed from the master, cleared of extra membranes blocking the ports, and plasma treated for use. Oxygen plasma treatment was done in a Femto plasma cleaner system (Electronic Diener, Ebhausen, Germany). For plasma treatment, devices were first cleaned of any visible dust and debris. The top of the device was then placed on an adhesive backing to prevent plasma treatment of the top surface of the device. Each set of 6 devices (2 vertical columns of 3 devices) was plasma treated along with the bottom portion of a 50 mm glass bottom culture dish (MatTek Corporation, Ashland, MA) (Fig. 1a–b). To plasma treat, oxygen was pumped in for three minutes followed by approximately 30 to 40 seconds of plasma generation. Once treated, the devices were removed, placed on their backing, and allowed to adhere on a hot plate for 10 minutes at 60°C. All devices were plasma treated within one to two hours of use.
Fig. 1.
Diagram and operation of PI channel. (a) Diagram of PI chemotaxis device indicating the channel dimensions. (b) PI channel device with the gel region containing green dye and the cell channel containing red dye. (c) Multistep setup of PI channel device
2.4 PLB Device Setup
For trials involving the PLB-985 cell line, Matrigel was mixed 1:1 with sterile filtered HBSS containing 0.1% BSA and then stored on ice. Following the six-day differentiation period, the differentiated PLB-985 cells were re-suspended in HBSS+0.1%BSA at a final concentration of 4 million cells/mL. fMLP and LTB4 were both diluted accordingly in HBSS+0.1%BSA.
Following plasma treatment, droplets of PBS and diH2O were mixed 1:1 and placed around the devices to prevent evaporation. Devices were then loaded in sets of three. To load the devices, the glass bottom containers were placed on a bed of ice while 1.5µL of the Matrigel HBSS mixture was added by incrementally alternating back and forth between the top ports until the entire gel region of the channel was filled (Fig. 1a). This process of gel loading reduced the formation of any air pockets in the gel region of the device. The set of filled devices was then incubated at 37°C for 15 seconds to allow the gel to polymerize as determined by experimental optimization. Once polymerized, either 1µL of the chemoattractant diluted in HBSS+0.1%BSA (fMLP, LTB4) or 1uL of HBSS+0.1%BSA solution (control) was then added to each of the upper ports followed by 5.5µL of the cell solution to the cell region of the channel (Fig. 1a). In total, two glass bottom culture dishes, each filled with 6 devices, were placed in a single omni tray (Thermoscientific, Waltham, MA) for imaging (total of 12 devices) (Fig. 1b). Three of the channels always served as controls in each experimental setup. In the control devices, 1uL of HBSS+0.1%BSA was added to each port rather than the chemoattractant solution. The twelve loaded channels were then incubated at 37°C for between 60 and 90 minutes before time lapse imaging at a 4× magnification on an IX 81 microscope (Olympus) for 1 to 3 hours (Fig. 1c).
2.5 Neutrophil Migration from Whole Blood Device Setup
A modified protocol was developed for the migration of neutrophils from whole blood. For whole blood, the Matrigel mixture was altered to a ratio of 1:2 Matrigel to HBSS+0.1%BSA. Blood was obtained from healthy donors with prior IRB approval. The extracted blood sample was immediately mixed 1:3 with a 150mM heparin solution minutes after extraction. Similar to the PLB-985 cell line, channels were first loaded with the Matrigel solution and incubated at 37°C for 30 seconds. Following the incubation, chemoattractant or control buffer solutions were added to each of the top ports (1µL). Diluted whole blood was then added to the cell region of the channel at a volume of 5.5µL. Completed devices were then allowed to incubate for 40 minutes prior to time-lapse imaging. As in the cell line experiments, twelve devices were setup with three acting as controls loaded only with HBSS+0.1%BSA in the chemoattractant ports.
2.5 Neutrophil Migration from Whole Blood Device Setup
A modified protocol was developed for the migration of neutrophils from whole blood. For whole blood, the Matrigel mixture was altered to a ratio of 1:2 Matrigel to HBSS+0.1%BSA. Blood was obtained from healthy donors with prior IRB approval. The extracted blood sample was immediately mixed 1:3 with a 150mM heparin solution minutes after extraction. Similar to when using the PLB-985 cell line, channels were first loaded with the Matrigel solution and incubated at 37°C for 30 seconds. Following the incubation, chemoattractant or control buffer solutions were added to each of the top ports (1µL). Diluted whole blood was then added to the cell region of the channel at a volume of 5.5µL. Completed devices were then allowed to incubate for 40 minutes prior to time-lapse imaging. As in the cell line experiments, twelve devices were setup with three acting as controls loaded only with HBSS+0.1%BSA in the chemoattractant ports.
2.6 Microscopy and Analysis
Imaging was completed on an Olympus IX 81 (Olympus Corporation of the Americas, Center Valley, PA) microscope with the imaging software program Slidebook 5.0 (3i Inc., Denver, CO). Phase contrast images of each channel were obtained every sixty seconds along the Matrigel-cell interface with a 100 millisecond exposure at a 4× magnification. Channels were imaged for 1 to 3 hours total. The stack of images was used to generate cell tracks of the migrating population with the help of the program FIJI,(Schindelin, Arganda-Carreras et al. 2012) using its manual cell-tracking program MTrackJ.(Meijering, Dzyubachyk et al. 2012)
2.7 Statistical Analysis
Cell migration tracks were graphed and analysed using the open source statistical program R 3.0.3.
3 Results and Discussion
3.1 Device Fluidic Operation
The PI channel depends on the generation of two distinct regions: the chemoattractant containing Matrigel region and the cell region. For the device filling to result in these separate regions, both the PDMS PI Channel and the 50 mm glass bottom petri dish it was bound to were plasma treated prior to operation. Matrigel was then loaded through the top chemoattractant ports and filled the gel region of the device due to the high wettability of the plasma treated surfaces. The stability of the gel boundary at the cell-gel interface is due to the resistance to flow between the gel region and cell channel when adding the cell solution. This resistance to flow is defined by equation (1) where R1 is the resistance to flow into the gel region and R2 is the resistance to flow in the cell region. The variables L, W, and H represent length, width and height for the two regions, respectively. The heights for the cell region (H1) is 250µm versus 50µm in the gel region (H2), and the width of the boundary opening between the channel and gel region is 1mm similar to the width of the cell channel (Supplemental Fig. 1). Assuming a unit distance length for the regions, the resistance to flow from the cell channel into the gel region is approximately 250 times higher than the resistance to flow within the cell channel.
Further adding stability to the cell-gel interface was the experimentally determined 15 second Matrigel polymerization time at 37°C. For the device to function, it was necessary to create an ideal balance between adequate Matrigel polymerization, evaporation, and drying of the gel to successfully load the cell channel without disturbing the cell-gel interface while enabling migration of the cells through the interface.
In the device, the presence of any gradient instability could however heavily influence cell migration. Gradient instability can originate from convective flow induced by evaporation. The use of gel in the PI channel limits the impact of convective flow. As the devices were also bound to a glass bottom petri dish of low height, the dish aided in limiting the presence of a temperature gradient and thus reduced the likelihood of convective flow. Droplets of mixed PBS and water were placed within the dish, which was then placed inside an omnitray lined with dampened Kimwipes to limit the impact of evaporation, a potential contributor to gradient instability.
While evaporation is not a limitation of the PI channel utilizing the presented setup, in order to use the PI channel successfully, the final device requires a balance between the establishment of a gel-cell boundary that is both permeable to migrating cells and resilient enough to withstand the loading of the cell solution. In optimization testing, longer Matrigel polymerization times created a boundary that was resistant to migration where, in chemoattractant setups, cells could be seen accumulating at the gel boundary unable to enter the gel. To overcome the polymerization sensitivity, experimental optimization was performed to obtain the 15 second polymerization time for the PLB985 cell line and a 30 second polymerization time when loading whole blood.
3.2 Modelling, Fluorescent Testing, and PLB985 Migration to Single Gradients
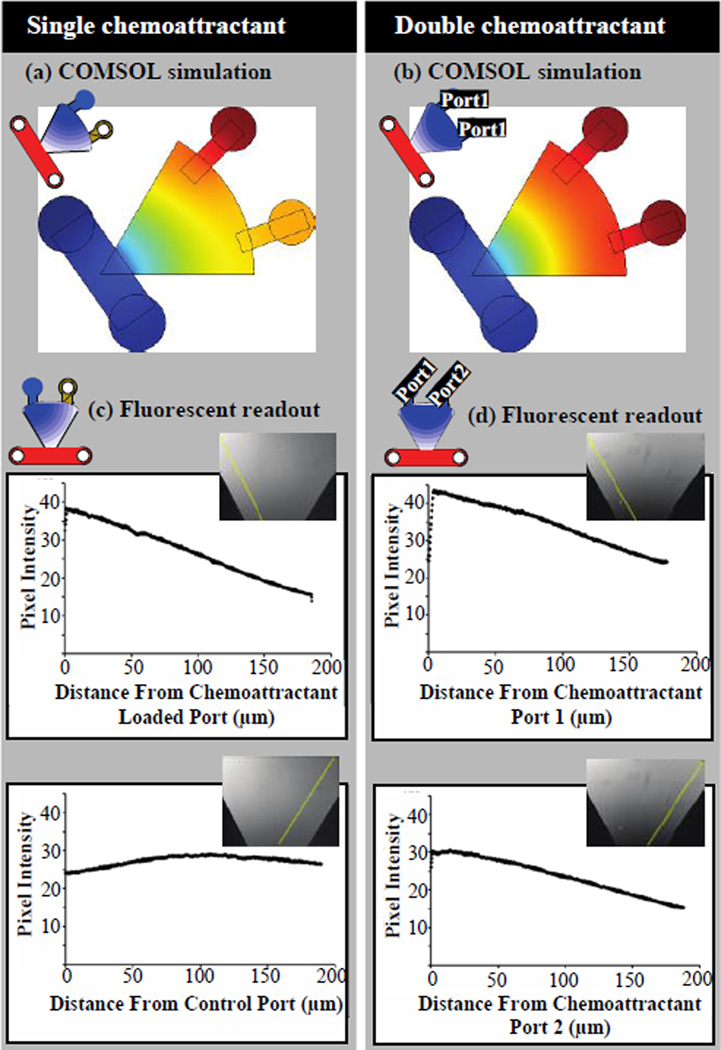
A 2-dimensional model of the PI channel was developed in COMSOL 3.4 numerical simulation software (COMSOL, Burlington, MA). For the diffusion analysis, the chemoattractant source was set to a static concentration of 1 with a diffusion coefficient of 430 µm2/s corresponding to the diffusion rate of Alexa488 in water. The model was used to demonstrate the establishment of a gradient if the chemoattractant was loaded in one port (Fig. 2a) in addition to the loading of the same chemoattractant into both ports (Fig. 2b).
Fig. 2.
COMSOL models and experimentally established fluorescent gradient measurements. (a) COMSOL model and (c) fluorescent readout for single chemoattractant source at 15 minutes post setup. (b) COMSOL model and (d) fluorescent readout for double chemottractant source at 15 minutes post setup
The stable gradient predicted in COMSOL was experimentally confirmed by first placing 2 µl of Alexa488 diluted in PBS in one or both chemoattractant ports. As Alexa488 (MW = 488 Da) has a molecular weight similar to fMLP (MW = 437 Da), it was used to predict the gradient of fMLP in the device. Within the fifteen minutes required for device and microscopy setup, fluorescent imaging demonstrated an already established gradient (Fig. 2c,d). An additional three hours of time-lapse imaging demonstrated continued gradient stability. Characterization of the gradient was repeated with the florescent dye Alexa350 supporting the Alexa488 results (Supplemental Fig. 2).
After experimentally confirming the stability of a single chemoattractant gradient for at least 3 hours (Fig. 2, Supplemental Fig. 2), terminally differentiated PLB cells were placed in the PI channel and exposed to a single gradient of the chemoattractant fMLP loaded in a single port (with a solution of HBSS+0.1%BSA loaded into the other) or fMLP loaded into both ports. For all control setups, a solution of HBSS+0.1%BSA was loaded into each port. To ensure the observed migration was not the result of some artifact of the device, the solutions in the single fMLP gradient devices were switched in another set of channels.
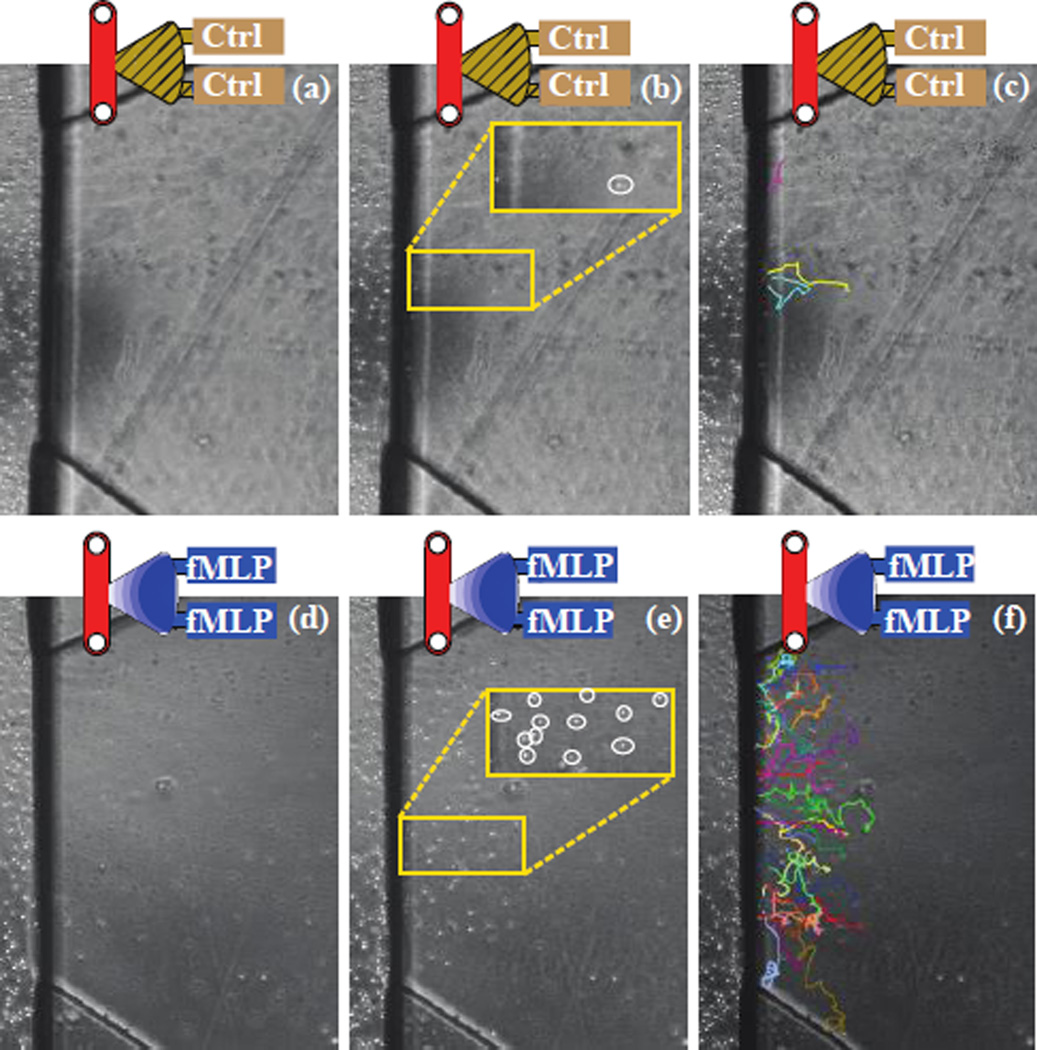
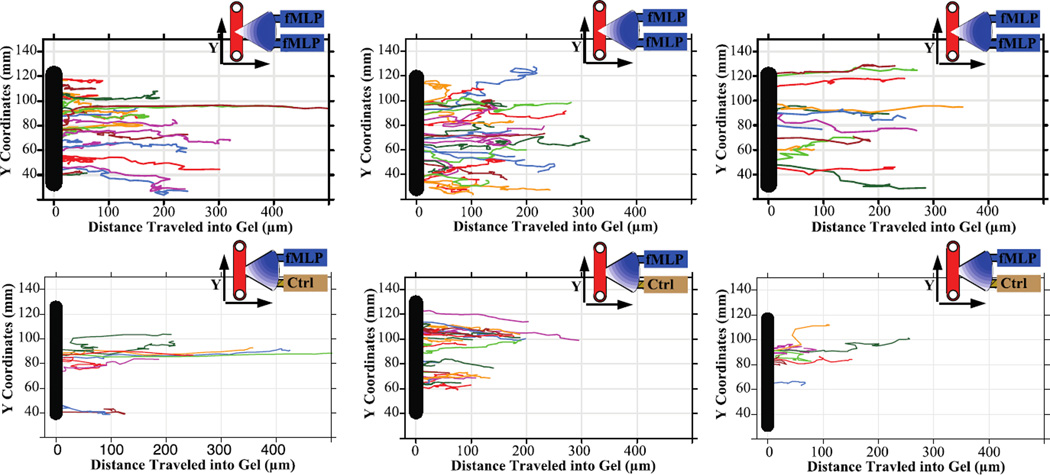
In all control setups, <5 PLBs were observed migrating into the gel region of the device (Fig. 3a–c). However, a significant population of PLBs were observed to migrate in the experimental setups involving fMLP, with more cells migrating when fMLP was loaded in both ports (Fig. 3d–f and 4). Furthermore, the observed migration velocities of the terminally differentiated PLB cells in response to a single (7.73um/min) or double (8.01um/min) fMLP gradient were comparable to previously reported values for neutrophil migration in agarose (Foxman, Kunkel et al. 1999). To confirm the migration of the cells through, rather than above or below the 3D Matrigel matrix, the cells were imaged at the same z location at sixty second intervals. During the established time lapse, the cells could be seen moving in and out of the focal plane (z-direction) to varying degrees, while visual features of the device remained constantly in focus. Had the cells been migrating on a single 2D plane, this oscillation in the z direction would not have been observed.
Fig. 3.
(a–c) Control and (d–f) double fMLP channel (a, d) channels at time zero (b, e) channels at 2 hours with PLBs labelled by white circles, with matching tracks (c, f)
Fig. 4.
Migration tracks of PLBs in response to the chemoattractant fMLP. Tracks show PLBs migrating across the cell-gel interface at varying locations up and down the channel and further into the gel region. Control devices (nor shown) demonstrated no migration. Migration of PLBs to fMLP in the top and bottom chemoattractant port (Top Row). Migration of PLBs to fMLP in only the top port (Bottom Row)
To analyse the migration tracks of the terminally differentiated PLBs, the start of migration was defined as the point at which the cell traversed into the gel region. For analysis, it was important to account for the location of the cell-crossing boundary (gel-cell interface) at which the cell crossed due to the varying gradient slope present at different points along the interface. For example, in the case of the single fMLP source, cells at the boundary that are closer to the fMLP source will be exposed earlier to fMLP and exposed at a higher gradient slope. There was an observed difference between the crossing point of PLBs with a single fMLP gradient versus a double gradient, with the PLBs in the single gradient setup on average crossing the gel boundary at a location 7% of the boundary closer to the chemoattractant source (Fig. 4). Within both setups, the maximum length of the PLB tracks was approximately 300µm with a few cells migrating more than 400µm into fMLP containing gel. In all instances, these long-range migrating cells were located at the midpoint of the cell channel and gel boundary.
Following experimental confirmation of PLB985 cell migration to fMLP, another chemoattractant of similar molecular weight known to induce neutrophil migration, LTB4 (MW=336 Da), was tested in the PI channel. While no migration was observed in control setups, the PLB985 cells were observed to migrate in the presence of an LTB4 gradient. Due to the cell line’s response to both fMLP and LTB4 gradients, these chemoattractants were chosen to test for migration responses to dual, competing gradients.
3.3 Modelling, Fluorescent Testing, and PLB985 Migration to Dual, Competing Gradients
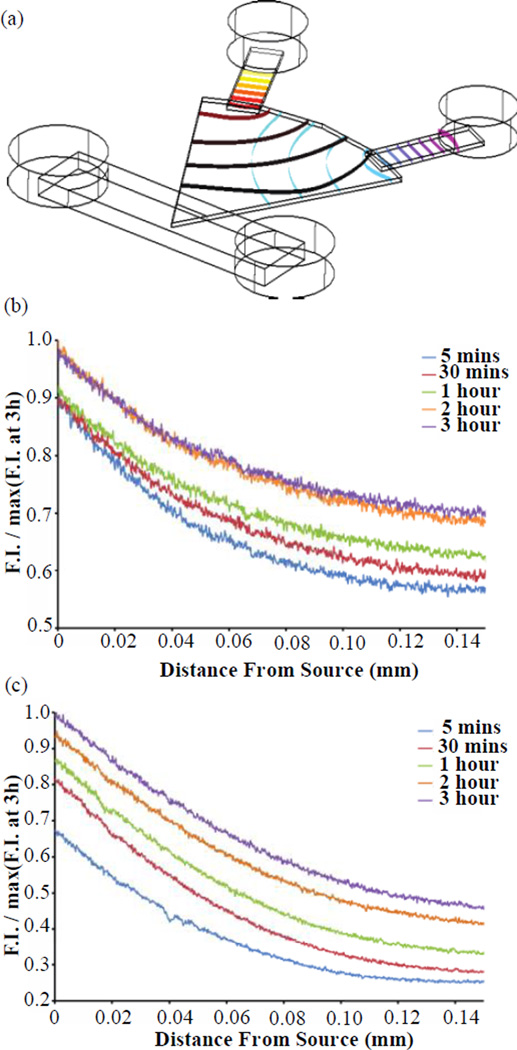
To determine the ability of the PI channel to maintain dual, competing gradients, a COMSOL model was generated depicting the diffusion of two similar molecular weight compounds, Alexa350 and Alexa488, in the same device. The model demonstrated the establishment of the two gradients within the device as well as the existence of a gradient three hours later (Fig. 5a).
Fig 5.
(a) COMSOL model of A350 (upper left port) and A488 (right port) diffusion gradient after 2 hours. (b) A350, (c) A488 (bottom) experimentally measured diffusion normalized to maximum fluorescence across 3 hours confirming formation of gradient within 5 minutes and presence of gradient after 3 hours. Both fluorescent dyes were added and detected from the same device to show the detection of two competing gradients. F.I. : Fluorescence Intensity
Experimental testing of the models was performed by loading solutions of Alexa350 and Alexa488 into the two chemoattractant ports. Following fluorescent time-lapse imaging setup (approximately 5 minutes), the PI channel produced a gradient within 5 minutes and maintained the existence of a gradient for more than 3 hours (Fig. 5b & c). Overall, the COMSOL model and the experimental measurement of fluorescent dyes supported the quick establishment of a gradient (within ~5 minutes of completed device setup) and the continued existence of a gradient for the duration required for experiments (>3 hours) in the context of compounds of similar MW to LTB4 and fMLP.
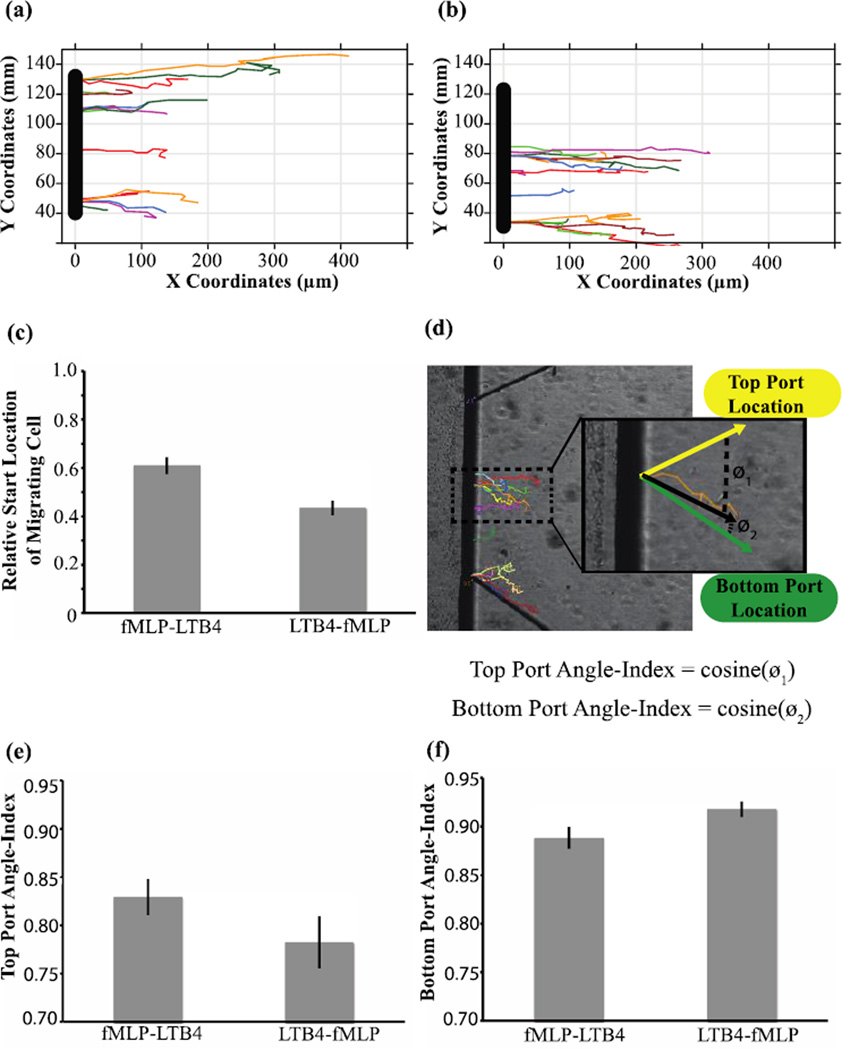
Upon fluorescent confirmation of the stability of competing gradients of similar MW fluorophores, LTB4 and fMLP were used to create competing chemoattractnat gradients. To control for compounding factors related to device setup, the relative location of one chemoattractant to the other was inverted in different PI channel experiments. In one setup fMLP and LTB4 were placed at the top and bottom port, respectively (fMLP-LTB4) (Fig. 6a). The chemoattractant locations were then inverted in alternative setups (LTB4-fMLP) (Fig. 6b). On average in both setups, a migrating PLB was located 7% and 10% closer to the fMLP source, suggesting greater migratory response towards fMLP over LTB4 (Fig. 6c). Furthermore, control setups loaded with HBSS+0.1%BSA alone, showed no migration (see Fig. 3). Notably during the course of tracking migration, longer migratory tracks were occasionally observed along device borders. This may be due to higher local chemoattractant concentration from reflection of the chemoattractant on the wall leading to a chemoattractant build-up at these border regions.
Fig. 6.
PLB985 migration tracks in the presence of fMLP and LTB4. Control devices loaded with HBSS+0.1%BSA rather than chemoattractant (not pictured) showed no cell migration. (a) Sample time-lapse tracks in setup #1 with fMLP (top port) and LTB4 (bottom port). (b) Sample time-lapse tracks in setup #2 with LTB4 (top port) and fMLP (bottom port). (c) The average crossing location of migrating cells indicating a significant difference between setup #1 and setup #2. (d) Angle-index calculation for a single migration track (orange) with the expected migration indicated by green and yellow vectors, and the observed migration vector indicated by a black vector. The Top Port Angle-index is equal to cosine (ø1) and the bottom port Angle-index is equal to cosine(ø2) (e) Angle-index values for the top port indicating a higher value for setup #1 (fMLP in top port). (f) Angle-index values for the bottom port indicating a higher value for setup #2 (fMLP in bottom port)
The observed migration in response to the tested chemoattractants compared to the lack of response in control setups further confirmed the gradient dependence of this migratory response. When competing gradients of fMLP and LTB4 were established in a device, migration of the differentiated cell line showed directional migration towards fMLP over LTB4 as seen in alternative migration studies (Foxman, Campbell et al. 1997). Throughout every experiment, images were acquired at a identical x,y,z location every sixty seconds. As a result of this rapid image acquisition for each channel, not only could horizontal neutrophil tracks be generated, but also cell oscillations in and out of the focal plane (z-plane) could be visualized. Had the cells been experiencing 2D migration either above or below the Matrigel matrix, rather than 3D migration, it would be expected the cells would remain in the same focal plane while migrating, remaining constantly in or out of focus. Due to the varying patterns of each cell moving in focus then out of focus for different number of frames, the cells are most likely migrating through rather than around the 3D substrate.
The ability to image over-time and track single migrating cells in the PI channel enables us to utilize alternative migration metrics not quantifiable with the under-agarose assay. Using time-lapse imaging of the PI channel, we were able to calculate the average angle of movement for a single cell by calculating the vector from the start-point to the end-point cell location. Due to the length of the gel region opening, the expected direction of migration for a cell is dependent on the initial starting point of the migrating cell. To account for this, the expected vector of migration for each cell was calculated relative to the top and bottom chemoattractant port location. The cosine of the angle formed between these two expected migration vectors and the observed migration vector were calculated and termed the AngleIndex (Fig. 6d). The AngleIndex for the upper port was 0.917 for the fMLP-LTB4 setup versus 0.888 for the LTB4-fMLP setup (Fig. 6e). In contrast, the average AngleIndex for the lower port was 0.782 for the fMLP-LTB4 setup versus 0.829 for the LTB4-fMLP setup (Fig. 6f). The observed difference between AngleIndex values for the fMLP-LTB4 versus the LTB4-fMLP design were statistically significant based on the one-sided Wilcoxon rank test, thus validating the utility of this device based on previously reported observations (Foxman, Campbell et al. 1997).
While experimental fluorescent testing of two similarly sized fluorophores (predictive of the gradient establishment of fMLP and LTB4 in the same device) demonstrated similar gradient establishment, if the compounds differed in MW the time to establish a gradient would vary between the two compounds. To visualize this possibility, a larger MW fluorophore was loaded in the PI channel and, while a gradient was established, the fluorophore required a significantly longer incubation (Supplemental Fig. 3) than the previous tested fluorescent molecules (Supplemental Fig. 2). If these compounds were used as competing gradients, the same loading time could not be used for both compounds. While this is a limitation of the device, alternatively sized MW compounds could still be utilized if the loading of the compounds was staggered based on experimentally determined diffusion data of similarly sized fluorophores. Experimental testing with representatively sized fluorophores prior to use would enable the user to appropriately stagger the loading of varying-sized chemoattractants to result in the desired competing gradient profiles at the time of cell loading.
3.4 Migration of Neutrophils Directly from Whole Blood
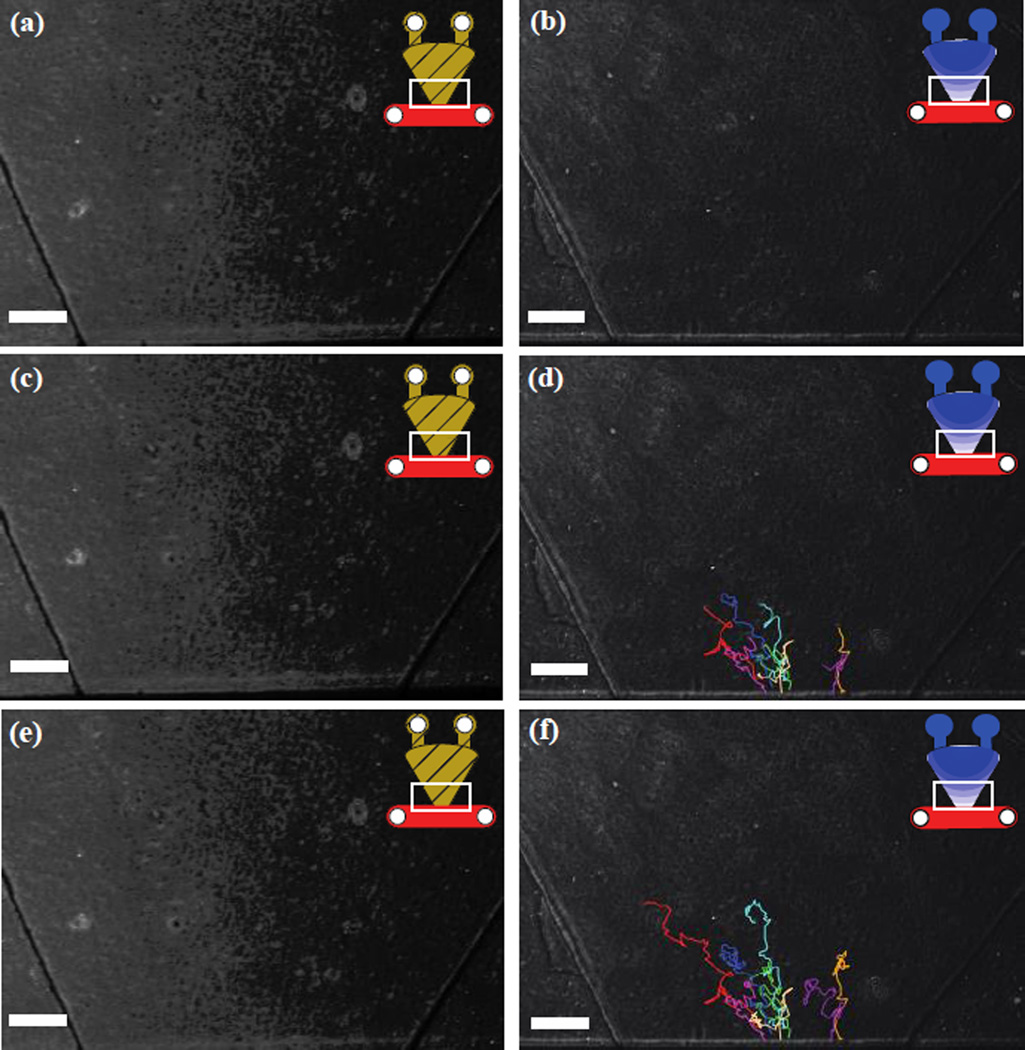
To test the capabilities of the PI channel, heparinised whole blood was placed in the cell channel in the presence of a dual fMLP gradient and compared to control channels loaded with HBSS+0.1%BSA. While no migration was observed in the control set of device, migration was observed in the fMLP channels. Neutrophils were observed to migrate into the gel over a two and half hour period with an average velocity of 3.7 um/minute (Fig 7). Contrary to the majority of previous neutrophil migration assays, no purification or capture steps were necessary reducing the cost and time of the assay. Although, further optimization is required for the PI channel to be widely utilized using whole blood, these experiments serve as a demonstration of its potential as a platform to induce neutrophil in-gel migration from whole blood.
Fig. 7.
Generated tracks of observed neutrophil migration from heparinized whole blood in (left column) control channels and in the (right column) presence of a dual gradient of fMLP. Neutrophil migration tracks at (a,b) initial time point, (c,d) after 1 hour, (e,f) after 2 hours. White bar = 250 µm
4 Conclusions
The simple PI channel device is a robust tool for studying chemotaxis through a 3-D matrix in the presence of both single and dual gradients. The characterization of this migration platform demonstrates its potential use to study migration of neutrophils in response to multiple gradients, as is commonly encountered in vivo. Furthermore, the device has demonstrated its successful application for elucidating a measurable migration response using neutrophils migrating directly from whole blood, opening its potential use for clinical applications and eliminating the need for any neutrophil purification.
Supplementary Material
Acknowledgments
This work was funded by NIH Grant # 5R33CA137673, R01EB010039, R01GM08148, T32GM008692 and the UWCCC Cancer Center Support Grant number P30 CA014520. FMH was supported by the Clinical and Translational Science Award (CTSA) program, through the NIH National Center for Advancing Translational Sciences (NCATS), grant UL1TR000427. The content is solely the responsibility of the authors and does not necessarily represent the official views of the NIH. David J. Beebe holds equity in Bellbrook Labs, LLC, Tasso, Inc. and Salus Discovery, LLC.
Footnotes
Electronic Supplementary Information (ESI) available: [details of any supplementary information available should be included here]. See DOI: 10.1039/b000000x/
References
- Abhyankar VV, Toepke MW, Cortesio CL, Lokuta MA, Huttenlocher A, Beebe DJ. Lab Chip. 2008;8(9):1507–1515. doi: 10.1039/b803533d. [DOI] [PMC free article] [PubMed] [Google Scholar]
- Butler KL, Ambravaneswaran V, Agrawal N, Bilodeau M, Toner M, Tompkins RG, Fagan S, Irimia D. PLoS One. 2010;5(7):e11921. doi: 10.1371/journal.pone.0011921. [DOI] [PMC free article] [PubMed] [Google Scholar]
- Cavnar PJ, Berthier E, Beebe DJ, Huttenlocher A. J Cell Biol. 2011;193(3):465–473. doi: 10.1083/jcb.201010143. [DOI] [PMC free article] [PubMed] [Google Scholar]
- Feng D, Nagy JA, Pyne K, Dvorak HF, Dvorak AM. J Exp Med. 1998;187(6):903–915. doi: 10.1084/jem.187.6.903. [DOI] [PMC free article] [PubMed] [Google Scholar]
- Foxman EF, Campbell JJ, Butcher EC. J Cell Biol. 1997;139(5):1349–1360. doi: 10.1083/jcb.139.5.1349. [DOI] [PMC free article] [PubMed] [Google Scholar]
- Foxman EF, Kunkel EJ, Butcher EC. J Cell Biol. 1999;147(3):577–588. doi: 10.1083/jcb.147.3.577. [DOI] [PMC free article] [PubMed] [Google Scholar]
- Haessler U, Kalinin Y, Swartz MA, Wu M. Biomed Microdevices. 2009;11(4):827–835. doi: 10.1007/s10544-009-9299-3. [DOI] [PubMed] [Google Scholar]
- Haessler U, Pisano M, Wu M, Swartz MA. Proc Natl Acad Sci U S A. 2011;108(14):5614–5619. doi: 10.1073/pnas.1014920108. [DOI] [PMC free article] [PubMed] [Google Scholar]
- Heit B, Robbins SM, Downey CM, Guan Z, Colarusso P, Miller BJ, Jirik FR, Kubes P. Nat Immunol. 2008;9(7):743–752. doi: 10.1038/ni.1623. [DOI] [PubMed] [Google Scholar]
- Hoang AN, Jones CN, Dimisko L, Hamza B, Martel J, Kojic N, Irimia D. Technology (Singap World Sci) 2013;1(1):49. doi: 10.1142/S2339547813500040. [DOI] [PMC free article] [PubMed] [Google Scholar]
- Jones CN, Hoang AN, Dimisko L, Hamza B, Martel J, Irimia D. J Vis Exp. 2014;(88) doi: 10.3791/51215. [DOI] [PMC free article] [PubMed] [Google Scholar]
- Keenan TM, Frevert CW, Wu A, Wong V, Folch A. Lab Chip. 2010;10(1):116–122. doi: 10.1039/b913494h. [DOI] [PMC free article] [PubMed] [Google Scholar]
- Kim D, Haynes CL. Anal Chem. 2012;84(14):6070–6078. doi: 10.1021/ac3009548. [DOI] [PMC free article] [PubMed] [Google Scholar]
- Kuijpers TW, Hakkert BC, Hart MH, Roos D. J Cell Biol. 1992;117(3):565–572. doi: 10.1083/jcb.117.3.565. [DOI] [PMC free article] [PubMed] [Google Scholar]
- Lammermann T, Afonso PV, Angermann BR, Wang JM, Kastenmuller W, Parent CA, Germain RN. Nature. 2013;498(7454):371–375. doi: 10.1038/nature12175. [DOI] [PMC free article] [PubMed] [Google Scholar]
- Lauffenburger DA, Zigmond SH. J Immunol Methods. 1981;40(1):45–60. doi: 10.1016/0022-1759(81)90079-x. [DOI] [PubMed] [Google Scholar]
- Luster AD, Alon R, von Andrian UH. Nat Immunol. 2005;6(12):1182–1190. doi: 10.1038/ni1275. [DOI] [PubMed] [Google Scholar]
- Marasco WA, Phan SH, Krutzsch H, Showell HJ, Feltner DE, Nairn R, Becker EL, Ward PA. J Biol Chem. 1984;259(9):5430–5439. [PubMed] [Google Scholar]
- Mathias JR, Perrin BJ, Liu TX, Kanki J, Look AT, Huttenlocher A. J Leukoc Biol. 2006;80(6):1281–1288. doi: 10.1189/jlb.0506346. [DOI] [PubMed] [Google Scholar]
- Meijering E, Dzyubachyk O, Smal I. Methods Enzymol. 2012;504:183–200. doi: 10.1016/B978-0-12-391857-4.00009-4. [DOI] [PubMed] [Google Scholar]
- Nelson RD, Quie PG, Simmons RL. J Immunol. 1975;115(6):1650–1656. [PubMed] [Google Scholar]
- Payne AS, Cornelius LA. J Invest Dermatol. 2002;118(6):915–922. doi: 10.1046/j.1523-1747.2002.01725.x. [DOI] [PubMed] [Google Scholar]
- Saadi W, Rhee SW, Lin F, Vahidi B, Chung BG, Jeon NL. Biomed Microdevices. 2007;9(5):627–635. doi: 10.1007/s10544-007-9051-9. [DOI] [PubMed] [Google Scholar]
- Sackmann EK, Berthier E, Schwantes EA, Fichtinger PS, Evans MD, Dziadzio LL, Huttenlocher A, Mathur SK, Beebe DJ. Proc Natl Acad Sci U S A. 2014 doi: 10.1073/pnas.1324043111. [DOI] [PMC free article] [PubMed] [Google Scholar]
- Sackmann EK, Berthier E, Young EW, Shelef MA, Wernimont SA, Huttenlocher A, Beebe DJ. Blood. 2012;120(14):e45–e53. doi: 10.1182/blood-2012-03-416453. [DOI] [PMC free article] [PubMed] [Google Scholar]
- Sackmann EK, Fulton AL, Beebe DJ. Nature. 2014;507(7491):181–189. doi: 10.1038/nature13118. [DOI] [PubMed] [Google Scholar]
- Schindelin J, Arganda-Carreras I, Frise E, Kaynig V, Longair M, Pietzsch T, Preibisch S, Rueden C, Saalfeld S, Schmid B, Tinevez JY, White DJ, Hartenstein V, Eliceiri K, Tomancak P, Cardona A. Nat Methods. 2012;9(7):676–682. doi: 10.1038/nmeth.2019. [DOI] [PMC free article] [PubMed] [Google Scholar]
- Tonnesen MG, Smedly LA, Henson PM. J Clin Invest. 1984;74(5):1581–1592. doi: 10.1172/JCI111574. [DOI] [PMC free article] [PubMed] [Google Scholar]
- Tranquillo RT, Zigmond SH, Lauffenburger DA. Cell Motil Cytoskeleton. 1988;11(1):1–15. doi: 10.1002/cm.970110102. [DOI] [PubMed] [Google Scholar]
- Tucker KA, Lilly MB, Heck L, Jr, Rado TA. Blood. 1987;70(2):372–378. [PubMed] [Google Scholar]
- Wood W, Faria C, Jacinto A. J Cell Biol. 2006;173(3):405–416. doi: 10.1083/jcb.200508161. [DOI] [PMC free article] [PubMed] [Google Scholar]
- Xia YN, Whitesides GM. Annual Review of Materials Science. 1998;28:153–184. [Google Scholar]
Associated Data
This section collects any data citations, data availability statements, or supplementary materials included in this article.


