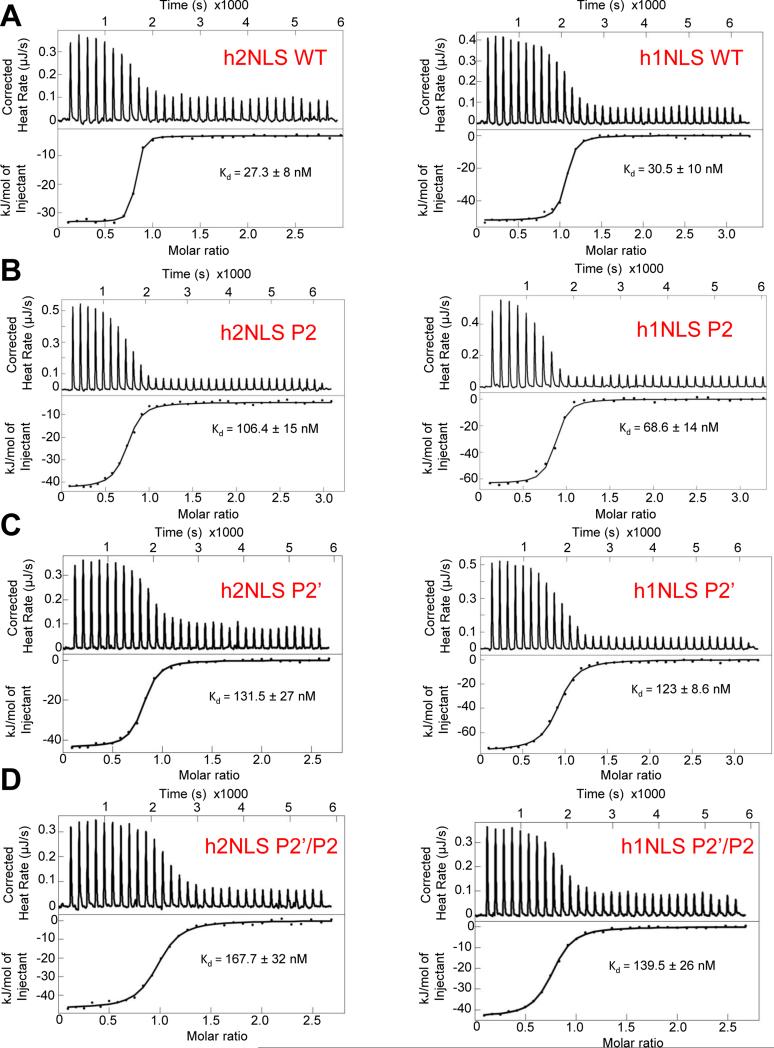
FIGURE 3. Calorimetric analysis of the interaction of h1/h2NLSs with ΔIBB-Kap60.
ITC analysis of the interaction of ΔIBB-Kap60 (in cell) with in syringe (A) WT h2NLS and h1NLS; (B) h2NLS(P2’) and h1NLS(P2’); (C) h2NLS(P2) and h1NLS(P2); (D) h2NLS(P2’/P2) and h1NLS(P2’/P2). Raw data are in the top panel, and the integrated enthalpy plotted as a function of the NLS:ΔIBB-Kap60 molar ratio is shown in the bottom panel. See also Figure S2.

