

Abstract
Preliminary evidence suggests aberrant (mostly reduced) thalamocortical (TC) connectivity in autism spectrum disorder (ASD), but despite the crucial role of thalamus in sensorimotor functions and its extensive connectivity with cerebral cortex, relevant evidence remains limited. We performed a comprehensive investigation of region‐specific TC connectivity in ASD. Resting‐state functional MRI and diffusion tensor imaging (DTI) data were acquired for 60 children and adolescents with ASD (ages 7–17 years) and 45 age, sex, and IQ‐matched typically developing (TD) participants. We examined intrinsic functional connectivity (iFC) and anatomical connectivity (probabilistic tractography) with thalamus, using 68 unilateral cerebral cortical regions of interest (ROIs). For frontal and parietal lobes, iFC was atypically reduced in the ASD group for supramodal association cortices, but was increased for cingulate gyri and motor cortex. Temporal iFC was characterized by overconnectivity for auditory cortices, but underconnectivity for amygdalae. Occipital iFC was broadly reduced in the ASD group. DTI indices (such as increased radial diffusion) for regions with group differences in iFC further indicated compromised anatomical connectivity, especially for frontal ROIs, in the ASD group. Our findings highlight the regional specificity of aberrant TC connectivity in ASD. Their overall pattern can be largely accounted for by functional overconnectivity with limbic and sensorimotor regions, but underconnectivity with supramodal association cortices. This could be related to comparatively early maturation of limbic and sensorimotor regions in the context of early overgrowth in ASD, at the expense of TC connectivity with later maturing cortical regions. Hum Brain Mapp 36:4497–4511, 2015. © 2015 Wiley Periodicals, Inc.
Keywords: autism, thalamus, functional connectivity MRI, diffusion tensor imaging
Abbreviations
- ANOVA
analysis of variance
- ASD
autism spectrum disorder
- DTI
diffusion tensor imaging
- GSR
global signal regression
- iFC
intrinsic functional connectivity
- ROIs
regions of interest
- TC
thalamocortical
- TMI
total motion index
INTRODUCTION
The thalamus is a complex brain structure through which nearly all sensory information is routed. Hence, it plays an important role in shaping what people see, hear, and feel. Specialized regions within the thalamus can be mapped based on their connectivity with cerebral cortex [Zhang et al., 2010]. Early in development, thalamic afferents play an important role in emerging functional specialization of cortical regions [O'Leary and Nakagawa, 2002]. There is also evidence of maturational changes in thalamocortical (TC) connectivity, with progressive strengthening of the frontal connections with dorsal/anterior subdivisions of the thalamus, but weakening of temporal lobe connectivity with ventral/midline/posterior subdivisions [Fair et al., 2010]. Growing interest in the thalamic roles beyond sensorimotor function has been fostered by evidence suggesting thalamic involvement in cognitive domains ranging from language and attention to executive functions and social motivation [Cabeza and Nyberg, 2000].
Autism Spectrum Disorder (ASD) is a neurodevelopmental disorder characterized by impairments in social interaction and communication, along with stereotyped and repetitive behaviors [American Psychiatric Association, 2013]. Growing evidence in autism indicates anomalies of early brain growth affecting cortical organization and brain connectivity [Courchesne et al., 2001]. Findings implicating abnormal thalamic development in ASD include reduced thalamic volume [Tamura et al., 2010], atypical asymmetries in serotonin synthesis [Chugani et al., 1997], as well as reduced neuronal integrity [Friedman et al., 2003], perfusion, and glucose metabolism [Haznedar et al., 2006]. Abnormal activation of TC networks involved in language processing [Müller et al., 1998], reduced thalamic activation during face processing [Kleinhans et al., 2008], and increased functional connectivity between thalamus and fronto‐parietal cortices in ASD have additionally been reported [Mizuno et al., 2006]. Anatomical abnormalities of thalamic white matter tracts have also been reported in ASD, such as white matter compromise in the dentato‐rubro‐thalamic pathway [Jeong et al., 2012], possibly related to motor and communicative deficits, and in the anterior thalamic radiations [Cheon et al., 2011].
In a prior study [Nair et al., 2013], known TC patterns of functional and structural connectivity were replicated for typically developing children, whereas children with ASD showed reduced thalamic connectivity for prefrontal cortex and combined parieto‐occipital lobes, contrasted by partial overconnectivity for the temporal lobe. However, as this study used only a few very large regions of interest, it provided little specific information about thalamic connectivity with specialized cortical regions and of the links between such specialized connectivity and behavioral impairments and symptomatology in ASD. The current study provides such a comprehensive investigation into the specificity of aberrant TC connectivity in ASD, using functional connectivity (resting state iFC) for a total of 68 cerebral cortical seeds as well as anatomical connectivity measures (DTI) for selected ROIs.
METHODS
Participants
One hundred and five children participated in the study, including 60 children with ASD (eight female) and 45 typically developing (TD) children (ten female). For the iFC analyses, 23 ASD and 7 TD participants were excluded because of excessive head motion (as defined below), resulting in a final sample of 37 ASD and 38 TD children. These included 19 ASD and 21 TD participants from our prior study [Nair et al., 2013] and 12 ASD and 22 TD participants shared in the ABIDE consortium [Di Martino et al., 2014b]. For DTI analyses, 26 participants with ASD and 12 TD participants were excluded because of missing field‐maps (8 ASD, 2 TD) or failed quality assessment (e.g. motion artifact; 18 ASD, 10 TD). The final DTI sample included 34 participants with ASD and 33 TD participants. The sample with combined usable data in both modalities consisted of 27 ASD and 30 TD participants. For all analyses, groups were matched for age, handedness, verbal IQ, and nonverbal IQ (Table 1). Clinical diagnoses were confirmed using the Autism Diagnostic Interview – Revised [Rutter et al., 2003b], the Autism Diagnostic Observation Schedule [Lord, 1999], and expert clinical judgment according to DSM‐IV criteria. Children with ASD‐related medical conditions confirmed by genetic testing (e.g., Fragile‐X syndrome, tuberous sclerosis) and other neurological conditions (e.g., epilepsy, Tourette's Syndrome) were excluded, based on parent report during intake interview. Participants in the ASD group were not excluded based on commonly occurring comorbidities with ASD such as attention‐deficit hyperactivity disorder, anxiety disorder, and obsessive compulsive disorder. Participants in the TD group had not reported personal or family history of ASD, nor other neurological or psychiatric conditions, as confirmed both in telephone screening and during direct formal interview with the parents. Informed assent and consent was obtained from all participants and their caregivers in accordance with the University of California, San Diego, and San Diego State University Institutional Review Boards.
Table 1.
Demographic data for Autism Spectrum Disorders (ASD) and typically developing (TD) groups for iFC data, DTI data, and overlap between both datasets
| fcMRI sample | DTI sample | Sample with usable data in both modalities (fcMRI and DTI) | |||||||
|---|---|---|---|---|---|---|---|---|---|
| ASD (n = 37) | TD (n = 38) | P | ASD (n = 34) | TD (n = 33) | P | ASD (n = 27) | TD (n = 30) | P | |
| Age | 13.9 (2.6) 9–17 | 13.0 (2.6) 8–17 | 0.43 | 13.7 (2.8) 7–17 | 12.9 (2.6) 8–17 | 0.24 | 13.6 (2.9) 7–17 | 13.1 (2.5) 8–17 | 0.47 |
| Sex (male:female) | 32:5 | 30:8 | 0.39 | 31:3 | 27:8 | 0.10 | 23:3 | 22:8 | 0.10 |
| Handedness (right:left) | 32:5 | 31:7 | 0.56 | 30:4 | 27:6 | 0.47 | 22:3 | 21:6 | 0.36 |
| Nonverbal IQ | 104.4 (16.9) 62–140 | 107.5 (12.5) 83–137 | 0.37 | 105.2 (16.8) 69–140 | 107.5 (12.8) 83‐137 | 0.54 | 106.4 (16.9) 70‐140 | 107.0 (12.8) 83‐137 | 0.87 |
| Motion (RMSD/TMI) | 0.081 (0.048) 0.021–0.246 | 0.082 (0.041) 0.019–0.166 | 0.92 | 2.12 (3.9) 1.5–11.6 | 0.70 (2.4) 2.1–7.8 | 0.07 | 0.07 (0.02)/0.96 (2.9) | 0.07 (0.04)/0.47 (2.1) | 0.91/0.48 |
Values shown are: Mean (SD), range. Significance value, p, for group matching from chi‐square tests (age, sex) and t‐tests (all others).
Data Acquisition
Imaging data were acquired on a GE Discovery 3T MR750 scanner with an 8‐channel head coil. High‐resolution structural images were acquired with a standard FSPGR T1‐weighted sequence (TR: 11.08 ms; TE: 4.3 ms; flip angle: 45°; FOV 256 mm; 256 × 256 matrix; 180 slices; 1 mm3 resolution). Functional T2‐weighted images were obtained using a single‐shot gradient‐recalled, echo‐planar pulse sequence. One 6:10 minute resting‐state scan was acquired consisting of 185 whole‐brain volumes (TR: 2000 ms; TE: 30 ms; 3.4 mm slice thickness; in‐plane resolution: 3.4 mm2). Physiological measures of respiration and heart rate were also acquired during the scan using a BIOPAC system. Diffusion weighted images were collected with an echo planar imaging (EPI) pulse sequence with full head coverage and encoded for 61 noncollinear diffusion directions at b = 1000 s/mm2, and one at b = 0 s/mm2 (2D EPI; TR = 8500 ms; TE=84.9 ms; flip angle=90°; NEX = 1; FOV = 24 cm; resolution = 1.875 × 1.875 × 2 mm3). Field maps were collected for functional and diffusion weighted sequence to correct for field inhomogeneities (TR = 1,097 ms; TE = 9.5 ms; flip angle=45°; 2 averages).
Neuropsychological data were obtained for both groups using the Wechsler Abbreviated Scale of Intelligence [Wechsler, 1999], the Developmental Test of Visual‐Motor Integration [Beery, 2010], and the Clinical Evaluation of Language Fundamentals – Fourth Edition [Semel et al., 2003]. For the sociocommunicative domain, additional data beyond ADI‐R and ADOS (which were available only for ASD participants) were acquired using the Social Communication Questionnaire [Rutter et al., 2003a], and the Social Responsiveness Scale [Constantino and Gruber, 2005]. Additionally, parent report versions of the Behavior Rating Inventory of Executive Function [Gioia et al., 2000], Sensory Profile [Dunn, 1999], and Repetitive Behavior Scale‐Revised [Lam and Aman, 2007] were acquired for most participants.
Cortical and Thalamic Regions of Interest
The Harvard‐Oxford cortical and subcortical structural atlases were used to derive seed masks for 34 cerebral cortical areas in each hemisphere (68 total) and the thalamus [Makris et al., 2006]. Analyses were performed separately for each hemisphere, i.e., only ipsilateral TC connectivity was considered. For complete listing of ROIs, see Supporting Information Table 1. Thalamic nuclei (as referred to in the Discussion) were identified using the CA_MNI_N27 atlas in Analysis of Functional NeuroImages (AFNI; [Cox, 1996]).
IFC Data Processing
Functional images were processed using the AFNI [Cox, 1996] and FMRIB Software Library (FSL) suites [Smith et al., 2004]. Functional images were slice‐time and head motion corrected registering each functional volume to the middle time point of the scan. Field map correction was applied in each participant using in‐house software for correcting magnetic resonance image distortion because of field inhomogeneity. Functional images were registered to the anatomical images via FSL's FLIRT [Jenkinson et al., 2002]. Both images were resampled (3mm isotropic) and standardized to the atlas space of the MNI152 template via FSL's nonlinear registration tool (FNIRT) for group comparisons. To isolate spontaneous low‐frequency BOLD fluctuations [Cordes et al., 2001], fMRI time series were bandpass filtered (.008 < f < .08 Hz), using a second‐order Butterworth filter, which was also applied to all nuisance regressors described below. Images were spatially smoothed to a Gaussian full width at half‐maximum (FWHM) of 6 mm, using AFNI's 3dBlurToFWHM.
Linear effects attributable to scanner drift were removed during regression. To remove signal from cerebral white matter and lateral ventricles, masks were created at the participant level using FSL's FAST automated segmentation. Masks were trimmed to avoid partial‐volume effects, and an average time series for each segment was extracted and removed via regression. One derivative each for white matter and ventricular time series was also removed. Physiological measures of heart rate and respiration were further modeled as nuisance regressors (usable data not available for 12 ASD and 11 TD participants). Primary analyses were performed without global signal regression (GSR) to avoid the creation of spurious anticorrelations [Murphy et al., 2009] which may substantially distort group difference [Gotts et al., 2013; Saad et al., 2012]. However, given the continuing debate on the virtues of GSR [Power et al., 2014], a secondary analysis including this regressor was also performed.
In view of the known impact of head motion on BOLD correlations [Power et al., 2012] several steps beyond conventional motion correction were taken to reduce the effect of motion. Six rigid‐body motion parameters estimated from motion correction and one derivative for each parameter were modeled as nuisance variables and removed with regression from all analyses. Additionally, motion for each time point, defined as root mean square of the sum displacement of all six translational and rotational axes (RMSD), was determined for each participant and used as a covariate in all group‐level analyses. No significant group differences were found for RMSD, t(73)=0.09, p =0.92. For any instance of RMSD > 0.5 mm, considered excessive motion, the time point as well as the preceding and following time points were censored, or “scrubbed”. If two censored time points occurred within ten time points of each other, all time points between them were censored. Only participants with ≥80% (≥144) time points remaining were included. In total, 342 time points were censored within the ASD group and 370 time points within the TD group. There was no significant group difference for number of time points that remained after censoring (ASD: M = 170.18, SD = 9.99; TD: M = 171.89, SD = 7.23; t(73)=0.21, p = 0.77). No significant group differences in RMSD after censoring were found, t(73)=0.02, p = 0.97. Additionally, a two‐way analysis of variance (ANOVA) tested the effects of group and type of motion (three translational and three rotational), as well as their interaction. The main effect of group was not significant, F(1,438) = 0.05, p = 0.81 nor was the interaction of group and motion type significant, F(5,438) = 0.76, p = 0.63. This suggests that group differences in iFC were unlikely to be driven by motion or related to differences in type of motion.
Partial correlation analyses were undertaken to accentuate the specificity of TC connections. The average BOLD time course was extracted from each cortical ROI. Partial correlations were then computed between each cortical seed and each voxel within ipsilateral thalamus, eliminating the shared variance by partialling out the averaged time series from entire cerebral cortex except the given ROI [Zhang et al., 2008]. These partial correlation coefficients were then converted to a normal distribution using Fisher's r‐to‐z transform. To test for correlations between ROIs and ipsilateral thalamus within each group, we performed one‐sample, two‐tailed t‐tests (p < 0.05) on these Fisher r‐to‐z transformed values. For direct group comparisons, we performed two‐sample, two‐tailed t‐tests (assuming unequal variance; p < 0.05). Statistical maps were adjusted for multiple comparisons (c. 685 voxels within ipsilateral thalamus), using Monte Carlo simulation [Forman et al., 1995], to a corrected p < 0.05. TC connectivities demonstrating significant positive t‐values for the contrast ASD‐TD were considered to be “overconnected”, those with significant negative t‐values “underconnected”. For each cortical seed with significant group differences, the mean z′ was obtained from the cluster of between‐group effects in ipsilateral thalamus in each participant, which was then entered into Pearson correlation analyses with scores obtained from diagnostic and neuropsychological measures.
Diffusion Imaging: Probabilistic Tractography
Diffusion weighted data were preprocessed using the FSL Diffusion Toolbox (FDT; [Smith et al., 2004] Preprocessing included field‐map correction of field inhomogeneities, removal of skull and non‐brain tissue (FSL BET), and eddy current correction (FSL eddy correct). To reduce motion effects on diffusion measures [Yendiki et al., 2013], we thoroughly assessed all scans for subject motion both through visual inspection for (i) signal dropout (ii) image noise and (iii) shifts of head placement, and through quantification of artifacts, excluding any scans with more than minor motion. Motion quantification was performed as recommended by Yendiki et al. [2013]: Mean image translation and rotation applied during eddy correction were recorded as were the severity and frequency of signal drop‐outs across all slices. These four quantities were combined into a total motion index (TMI) and this measure was used as a covariate in all analyses. The diffusion tensor was calculated at each voxel and maps of axial and radial diffusivity (AD and RD), mean diffusivity (MD), and fractional anisotropy (FA) were generated. The FA map was registered to MNI standard space using non‐linear registration (FSL FNIRT) and the FMRIB58 FA template. Transformation matrices were saved to facilitate fiber tracking in native space.
Fiber tracking was performed using the probabilistic tractography algorithms in FSL. The probability distribution of principal diffusion direction was calculated at each voxel in the brain. Multiple streamlines were generated from each voxel in the seed region (thalamus ipsilateral to cortical ROI) using repetitive sampling from the probability distribution, and the resulting output was limited to streamlines reaching the designated target regions (cortical areas). Due to the CPU‐intensive nature of probabilistic tractography, the target regions for these analyses were restricted to ROIs with significant group difference in iFC. For each participant, 1000 streamlines were initiated from each seed voxel generating a probability map of the tract location for each target. Voxels found to be above a threshold probability (minimum of 50 streamlines per voxel) formed a binary mask to define the subject‐specific location of the tract, and the mean MD, RD, AD, and FA were calculated for each tract. These means were used for between‐group comparisons as well as for correlations with scores obtained from neuropsychological and diagnostic measures.
RESULTS
Functional Connectivity
Of the 68 total ROIs, TC‐iFC was found to be reduced for 15 and increased for 9 ROIs. While TC underconnectivity effects in the ASD group predominated for frontal, parietal, and occipital ROIs, effects for temporal ROIs were mixed. For fronto‐thalamic iFC, we found underconnectivity in the ASD group for left middle frontal gyrus (LMFG) and superior frontal gyri (LSFG & RSFG) and supplementary motor area (LSMA & RSMA) bilaterally (Fig. 1A). Conversely, overconnectivity was observed for precentral gyri bilaterally (LPCG & RPCG) and right anterior cingulate cortex (RACC).
Figure 1.
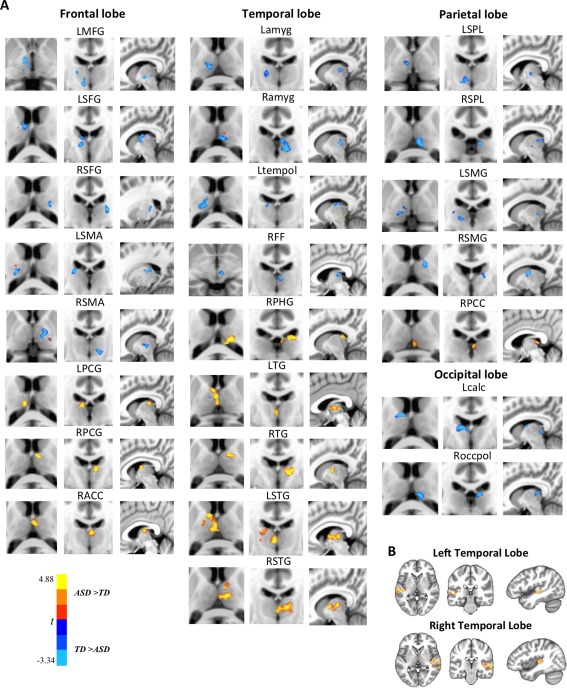
A: iFC between frontal, temporal, parietal, and occipital ROIs from the Harvard‐Oxford cortical atlas and ipsilateral thalamus. Only ROIs with significant between‐group findings are shown. B: Reverse connectivity analysis, using thalamic clusters of overconnectivity with superior temporal gyri (as shown in A) as seeds, indicates regions in and around auditory cortex driving these overconnectivity effects. [Color figure can be viewed in the online issue, which is available at http://wileyonlinelibrary.com.]
Among temporal ROIs, bilateral superior temporal gyri (LSTG & RSTG) and transverse temporal gyri (LTG & RTG) as well as right parahippocampal gyrus (RPHG) were overconnected with thalamus in the ASD group. Conversely, TC underconnectivity was seen in bilateral amygdala (Lamyg & Ramyg), right fusiform gyrus (RFF), and left temporal pole (Ltempol). Given that the most robust overconnectivity finding was detected for STG, which extends from anterior pole to most posterior temporal regions, we conducted a reverse iFC analysis. Within thalamus (left and right separately), clusters of significance from partial correlation analysis for superior temporal ROIs were used as seed for iFC analyses with unilateral temporal lobes. Thalamic overconnectivity was found mainly in posterior sections of Brodmann area 22 in the vicinity of primary auditory cortex (Fig. 1B).
For parietal lobe, underconnectivity with thalamus was observed for superior parietal lobule (LSPL & RSPL) and supramarginal gyri (LSMG & RSMG), whereas right posterior cingulate gyrus (RPCC) showed increased iFC. For occipito‐thalamic iFC, underconnectivity effects were observed for left supracalcarine gyrus (Lcalc) and right occipital pole (Roccpol) (Fig. 1A).
We created a Pearson's correlation matrix including only ROIs with significant iFC group differences to test for possible links between region‐specific overconnectivity and underconnectivity findings (Fig. 2A). ROIs were sorted according to between‐group effects (underconnectivity [indicated by blue font] vs. overconnectivity [red font]). The question of interest was whether thalamic overconnectivity in the ASD group for some ROIs may have come at the expense of ROIs with reduced thalamic iFC; i.e., whether mean z′ for one ROI was negatively correlated with mean z′ for the other. This question could be answered by focus on one quadrant of the matrix (outlined by dashed black line at top right of Fig. 2A), which shows mean z′ correlations between underconnected and overconnected ROIs in the ASD group. For every ROI pair (outlined with white box) within this quadrant that showed significant negative correlations, the correlation coefficients were converted to a normal distribution using Fisher's r‐to‐z transform. Two‐sample, two‐tailed t‐tests (assuming unequal variance; p < 0.05) were performed to determine significant group differences in any of the z‐transformed values for these ROI pairs. Scatterplots (Fig. 2B) were generated for those ROI pairs that showed significant group differences (with the ASD group demonstrating significantly greater negative correlations than the TD group). Namely, these included LMFG pairings with LPCG and RACC, and RPHG pairings with RSMG and Roccpol. For each of these ROI pairs, this indicates that underconnectivity for one was linked to overconnectivity for the other in the ASD (but not the TD) group.
Figure 2.
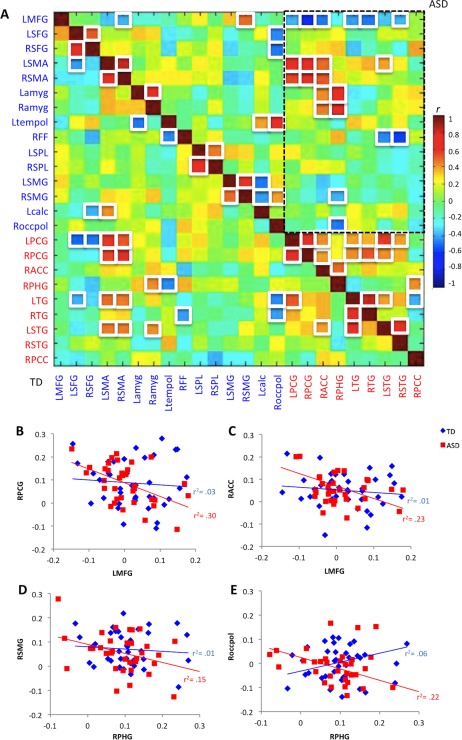
A: Correlation matrix for ROIs with significant iFC group differences. White squares indicate correlations r > 0.39 or r <−0.39 (p < 0.05; FDR corrected). Font color indicates ROIs that were underconnected (blue labels) or overconnected (red labels) with thalamus in the ASD group (abbreviations as in main text). Dashed black line highlights the upper right quadrant of specific interest that shows correlations between underconnected and overconnected ROIs in the ASD group. For example, negative correlation (r =−0.63) for LMFG‐RPCG in the ASD group shows that low iFC with thalamus for LMFG was associated with high iFC for RPCG, indicating possible linkage between the two findings. B–E: Scatterplots for ROI pairs with significant between‐group slope differences, illustrating significant inverse correlations in the ASD group between underconnected and overconnected ROI pairs. [Color figure can be viewed in the online issue, which is available at http://wileyonlinelibrary.com.]
We also ran an analysis combining ROIs with significant iFC between‐group differences into two domains: sensorimotor/limbic (SL) higher‐cognitive/supramodal (SU). We averaged iFC (z′) for all ROIs within each domain in each participant. ROIs in the SL domain included motor (RPCG, LPCG), auditory (RTG, LTG, RSTG, SLTG), visual (Roccpol, Lcalc), and limbic regions (RACC, RPCC, RPHG, Lamyg, Ramyg). ROIs in the SU domain included language (RSMG, LSMG), face processing (RFF), executive control (LMFG, LSFG), and other multimodal cognitive regions (Ltempol, LSPl, RSPL). A two‐way analysis of variance (ANOVA) tested the effects of group and domain (SL vs. SU), as well as their interaction. The main effect of group was not significant, F(1,146) = 0.09, p = 0.82) nor was the main effect of domain F(1, 146) = 0.91, p = 0.51. The interaction of group by domain, however, was significant, F(1,146) = 3.91, p=.0500. This suggests that there was a significant difference in iFC pattern for the ASD group with overconnectivity for SL regions with thalamus and underconnectivity for SU regions with thalamus, which was not evident for the TD group.
Additionally, the Euclidean distance between each ROI with significant between‐group effects and the centroid of ipsilateral thalamus was calculated [Alexander‐Bloch et al., 2012; Fair et al., 2007], using the formula: wherein x, y, z are the MNI coordinates for the centroid of each ROI. Correlations were run with mean z′ scores, covaried for motion and age, averaged across participants within each group. Results showed that functional connectivity indices were negatively correlated with distance in the ASD (r =−0.59, p = 0.002), but not the TD group (r =−.028, p = 0.19). To further test for group differences, Pearson's correlation coefficients were computed for each participant between individual ROI iFC z′ score and corresponding Euclidean distance with thalamus. The correlation coefficients were converted to a normal distribution using Fisher's r‐to‐z transform. Two‐sample, two‐tailed t‐tests (assuming unequal variance; p < 0.05) were performed to determine group differences. No significant group differences were found for the relation between Euclidean distance and iFC z′ scores, t(73) = 0.61, p =0.55.
We further performed Pearson correlations between iFC z′ scores and age, partialling out motion (RMSD). In the TD group, significant negative correlations between age and iFC z′ scores were observed for LTG (r =−0.33, p = 0.04) and RTG (r =−0.33, p = 0.05) and RSMA (r =−0.52, p < 0.001). In the ASD group, only a single age correlation was observed for Lcalc (r =−0.37, p = 0.03).
Finally, we performed secondary iFC analyses modeling GSR as a nuisance variable, given the continued debate about its merits and demerits [Power et al., 2014]. The overall pattern of findings was highly similar to those without GSR (Supporting Information Fig. 1). This similarity can be, in part, attributed to the fact that in analyses without GSR, signal fluctuations in the entire cerebral cortex (except the ROI under analysis) were also partialled out.
Anatomical Connectivity
Due to the computationally demanding nature of probabilistic tractography, the target regions for anatomical connectivity analyses were restricted to the 24 ROIs with significant group difference in iFC (as shown in Fig. 1A). Between group t‐tests of average DTI indices (FA, MD, RD, AD; Table 2) for each tract showed significantly decreased FA (an index often considered to reflect ‘tract integrity’) in the ASD group compared to the TD group for tracts connecting right thalamus with RACC and RSMA. Significant increases in the ASD group were observed for MD in tracts connecting thalamus with SFG and SMA bilaterally and with LPCG, Ltempol, and RSPL; and for RD in those connecting with PCG and SMA bilaterally, as well as RSMA, RACC, RSFG, Ltempol, and RSPL (both MD and RD are often described as negative indices of ‘tract integrity’). Finally, significantly increased AD in the ASD group was observed for tracts connecting thalamus with LSFG, RSFG, and RSPL. No significant group differences in DTI findings were observed for occipital ROIs.
Table 2.
Significant DTI tractography results (all p‐values FDR corrected)
| Lobe | DTI index and region |
|---|---|
| Fractional anisotropy (FA; TD > ASD) | |
| Frontal | RSMA; p = 0.006 |
| RACC; p = 0.006a | |
| Mean diffusivity (MD; ASD > TD) | |
| Frontal | LSFG; p = 0.03 |
| RSFG; p = 0.008 | |
| LSMA; p = 0.05 | |
| RSMA; p = 0.03 | |
| LPCG; p = 0.03a | |
| Temporal | Ltempol; p = 0.04 |
| Parietal | RSPL; p = 0.04 |
| Radial diffusivity (RD; ASD > TD) | |
| Frontal | RSFG; p = 0.006 |
| LSMA; p = 0.05 | |
| RSMA; p = 0.01 | |
| LPCG; p = 0.03a | |
| RPCG; p = 0.04a | |
| RACC; p = 0.05a | |
| Temporal | Ltempol; p = 0.04 |
| Parietal | RSPL; p = 0.04 |
| Axial diffusivity (AD; ASD > TD) | |
| Frontal | LSFG; p = 0.03 |
| RSFG; p = 0.05 | |
| Parietal | RSPL; p = 0.04 |
For all ROIs listed, TC‐iFC underconnectivity was also found, except those marked “a,” for which iFC overconnectivity was detected.
An additional DTI group analysis was undertaken in a sample of 26 ASD and 30 TD participants with matched TMI (P = 0.73). Participants (8 ASD and 3 TD) with more extreme TMI values were eliminated to draw the group averages (ASD: M =−0.31, range =−1.52 to −3.48, SD = 0.91; TD: M =−0.13, range =−2.01 to −2.62, SD = 1.05) closer together. These DTI results were highly similar to those discussed above (Supporting Information Table 2). Therefore, to retain greater power effects, the initial sample of 34 ASD and 33 TD participants was retained for all subsequent DTI analysis.
We again performed Pearson correlation analyses (partialling out motion) between Euclidean distance (from each ROI with significant group difference to the centroid of the ipsilateral thalamus) and mean FA, MD, RD, and AD, each averaged across participants within each group. MD, RD, and AD were all negatively correlated with distance in both groups (all p < 0.01). We also tested for correlations between DTI indices and iFC z′ scores for each region to explore the relationship between anatomical and functional measures, using false discovery rate (FDR) correction for multiple comparisons at p < 0.05 [Benjamini et al., 2001], which is preferable in neuroimaging to the overly conservative Bonferrroni approach [Genovese et al., 2002]. Results indicated that for LSTG iFC z′ scores were positively correlated with AD (r = 0.37, p < 0.02), and MD (r=0.37, p = 0.04), for LTG iFC z′ scores were positively correlated with MD (r = 0.33, p = 0.04) and RD (r = 0.28, p = 0.05), and for RACC iFC z′ scores were positively correlated with AD (r = 0.32, p = 0.04), MD (r = 0.31, p = 0.04), RD (r = 0.29, p = 0.04), and tract volume (r=.33, p=.04). Finally, we performed Pearson correlations between DTI indices and age, detecting no effects that survived FDR correction.
Diagnostic and Neuropsychological Correlates
To explore how functional and anatomical connectivity results related to diagnostic and neuropsychological scores, we performed a series of Pearson correlation analyses for the ASD group, partialling out age and head motion (RMSD for iFC and TMI for DTI). All results were then FDR‐corrected for multiple comparisons. Among iFC measures, we found positive correlations for ADOS and ADI‐R with right cingulate ROIs (reflecting increased symptom severity with greater iFC), but inverse effects for right superior frontal and superior parietal ROIs. Robust positive correlations were detected between iFC z′ scores from RFF with CELF‐4 Total Score, indicating improved language skills with greater connectivity between thalamus and RFF. Robust negative correlations were also detected between iFC z′ scores for RFF and planning/organizing, working memory, metacognition, and global executive composite of the BRIEF (Table 3), indicating greater executive abilities associated with increased iFC.
Table 3.
Correlations between iFC z′ scores and behavioral/diagnostic measures in the ASD group (all p‐values FDR corrected)
| FCMRI z' scores | ||||||||||
|---|---|---|---|---|---|---|---|---|---|---|
| RACC | RSFG | RFF | RSPL | RPCC | ||||||
| Measure | r | p | r | p | r | p | r | p | r | p |
| ADOS total score | 0.39 | 0.01 | ||||||||
| ADOS repetitive behaviors | 0.35 | 0.03 | ||||||||
| ADI‐R social | −0.37 | 0.02 | ||||||||
| ADI‐R communication | −0.38 | 0.02 | ||||||||
| ADI‐R repetitive behaviors | 0.42 | 0.009 | ||||||||
| CELF‐total score | 0.45 | 0.02 | ||||||||
| BRIEF planning/organization (ASD = 25) | −0.37 | 0.02 | ||||||||
| BRIEF working memory | −0.53 | 0.008 | ||||||||
| BRIEF metacognition | −0.52 | 0.009 | ||||||||
| BRIEF global executive composite | −0.42 | 0.04 | ||||||||
For measures that were not available in all participants, sample size per group is shown in italicized brackets
To minimize multiple comparisons testing for links between DTI indices and diagnostic and neuropsychological measures, we only tested correlations of FA (the most commonly used DTI measure) and RD (the index yielding most robust between‐group effects; Table 2) for ROIs with significant group differences in the ASD group. Results showed negative correlations of FA in right frontal TC tracts with SRS and BRIEF, indicating associations between reduced FA and greater impairment with respect to social interaction and executive functions. For SP, we found positive correlations with FA in right frontal tracts, indicating links between sensory behaviors and TC tract structure (Table 4). Additionally, we found positive correlations between RD in both right and left frontal tracts and SRS and BRIEF, further indicating impairment with respect to social interaction and executive functions. These correlations were in the direction of impairment for the ASD group. Therefore, more severe social and executive function scores were associated with compromised anatomical connectivity. Additionally, we also found positive correlations between ADI‐R social scores and RD for superior frontal and superior parietal tracts, suggesting increased symptom severity with higher diffusivity (Table 5).
Table 4.
Correlations between FA and behavioral measures in ASD group (all p‐values FDR corrected)
| Measure | FA | |||
|---|---|---|---|---|
| RACC | RSMA | |||
| r | p | r | p | |
| SCQ total score | −0.45 | 0.01 | ||
| SRS social awareness | −0.47 | 0.01 | −0.48 | 0.01 |
| SRS autistic mannerisms | −0.48 | 0.01 | ||
| SRS social cognition | −0.49 | 0.005 | −0.56 | 0.001 |
| SRS total score | −0.51 | 0.005 | ||
| SP sensation seeking (ASD = 29) | 0.48 | 0.01 | 0.49 | 0.005 |
| SP sensation avoiding | 0.47 | 0.01 | ||
| BRIEF inhibition (ASD = 25) | −0.46 | 0.01 | ||
| BRIEF emotional regulation | −0.48 | 0.01 | −0.50 | 0.005 |
| BRIEF shifting | −0.53 | 0.001 | −0.48 | 0.01 |
| BRIEF monitoring | −0.45 | 0.01 | −0.50 | 0.005 |
| BRIEF behavior regulation index | −0.49 | 0.005 | −0.46 | 0.01 |
| BRIEF metacognition | −0.47 | 0.01 | −0.46 | 0.01 |
| BRIEF global executive composite | −0.49 | 0.005 | −0.46 | 0.01 |
For measures that were not available in all participants, sample size per group is shown in italicized brackets.
For all measures except SP, higher scores indicate more severe symptoms.
Table 5.
Correlations between RD for ROIs showing significant group differences and behavioral/diagnostic measures in the ASD group (all p‐values FDR corrected)
| Measure | RD | |||||||||||
|---|---|---|---|---|---|---|---|---|---|---|---|---|
| RACC | LPCG | LSMA | RSMA | RSFG | RSPL | |||||||
| r | p | r | p | r | p | r | p | r | p | r | p | |
| ADI‐R social | 0.45 | 0.01 | 0.46 | 0.01 | 0.42 | 0.02 | 0.46 | 0.01 | ||||
| ADI‐R communication | 0.42 | 0.02 | ||||||||||
| SRS social awareness | 0.41 | 0.01 | 0.43 | 0.01 | ||||||||
| SRS autistic mannerisms | 0.40 | 0.01 | 0.31 | 0.04 | 0.33 | 0.05 | ||||||
| SRS social communication | 0.38 | 0.02 | ||||||||||
| SRS total score | 0.49 | 0.00 | 0.39 | 0.02 | 0.39 | 0.02 | ||||||
| BRIEF shifting (ASD=25) | 0.46 | 0.01 | ||||||||||
| BRIEF working memory | 0.42 | 0.01 | ||||||||||
| BRIEF monitoring | 0.38 | 0.02 | ||||||||||
| BRIEF metacognition | 0.40 | 0.01 | ||||||||||
| BRIEF global executive composite | 0.41 | 0.01 | ||||||||||
For measures that were not available in all participants, sample size per group is shown in italicized brackets.
DISCUSSION
Our findings indicate that atypical patterns of TC connectivity in ASD differ greatly from region to region, with findings of both under‐ and overconnectivity for each lobe (except the occipital). This expands upon and partly modifies results from an earlier study [Nair et al., 2013] reporting predominantly reduced thalamocortical connectivity (except for the temporal lobe) in ASD. Aside from a larger sample size and stricter protection from motion confounds in the present study, the greater specificity of findings can be attributed to the use of a much larger set of smaller cortical ROIs with narrower functional specialization.
General Patterns of Atypical Thalamic Connectivity in ASD
While atypical TC connectivity in ASD was highly region‐specific, some general principles emerged. Overconnectivity was mostly found for limbic (cingulate, parahippocampal) and sensorimotor regions (auditory, motor), although there were exceptions (underconnectivity for amygdala and occipital ROIs). Conversely, regions involved in multimodal and social cognition, such as executive functions, face processing, and language, were underconnected with thalamus. This pattern partly resembles findings from a large‐sample multisite study [Di Martino et al., 2014a], which reported overconnectivity in children and adults with ASD between sensorimotor cortices and subcortical regions (including thalamus). However, this study did not detect predominant TC underconnectivity for multimodal regions, as observed in the present investigation.
Frontal Connectivity
For the frontal lobe, the overall pattern of findings showed reduced TC‐iFC for higher‐order control regions, mixed effects for motor regions, and overconnectivity for a limbic ROI. First, we found predominantly reduced TC‐iFC for dorsolateral prefrontal regions, known for their roles in executive control, working memory, and attention [Haxby et al., 2000]. Reduced iFC within executive control networks has been reported in ASD [Kana et al., 2007], associated with increased symptom severity [Agam et al., 2010]. Second, for motor‐related frontal regions, findings were mixed. On the one hand, TC‐iFC for the supplementary motor area—important for higher‐order initiation and planning of internally guided movements [Nachev et al., 2008]—was reduced bilaterally. Conversely, primary motor cortex, crucial for voluntary motor execution, showed TC overconnectivity. For precentral gyri, overconnected clusters fell within the anterior and medial dorsal nuclei – thalamic subdivisions typically connected with prefrontal cortex [Jones, 2007]. There was an inverse correlation of TC‐iFC between left middle frontal gyrus and bilateral primary motor cortex, highlighting the possibility of a ‘functional invasion’ by overconnected motor cortex into thalamic territory typically connected to prefrontal cortex. This pattern may relate to earlier fMRI findings of motor‐related activation expanding into prefrontal association areas in adults with ASD [Müller et al., 2003]. Third, overconnectivity was detected for a limbic ROI, right ACC, with a cluster extending from anterior and medial thalamic nuclei, typically connected to prefrontal regions, into right ventral posterolateral nucleus, which typically has somatosensory function [Jones, 2007].
For many of the frontal regions with atypical TC‐iFC (primary motor cortex, supplementary motor area, superior frontal and cingulate gyri), DTI findings also showed white matter compromise in corresponding fronto‐thalamic tracts, consistent with prior studies [Cheon et al., 2011; Cheung et al., 2009; Shukla et al., 2011]. For right anterior cingulate, anatomical tract compromise was correlated with aberrant iFC. Reduced FA in two fronto‐thalamic tracts (for right ACC and right SMA) was also associated with diagnostic severity and executive impairment in ASD, supporting the behavioral significance of connectivity findings.
Temporal Connectivity
While a previous study [Nair et al., 2013] had suggested thalamic functional overconnectivity for the entire temporal lobe, the current results showed regional specificity. We found several subregions with increased iFC in the ASD group, including superior temporal gyri and transverse gyri bilaterally, as well as right parahippocampal gyrus – again in support of the predominant pattern of TC‐iFC overconnectivity for sensorimotor and limbic regions. The overconnectivity clusters for both superior temporal and transverse gyri spilled into the ventral anterior and medial dorsal nuclei – thalamic subdivisions predominantly connecting with prefrontal cortex in the TD brain [Jones, 2007]. A reverse connectivity analysis pinpointed bilateral hotspots of temporo‐thalamic overconnectivity in primary auditory cortex and immediate vicinity. The finding may relate to heightened auditory sensitivity [Matsuzaki et al., 2012], and atypical language development [Groen et al., 2008], which are common in ASD. Thalamic iFC of superior temporal and transverse gyri was correlated with autistic mannerisms, and impaired social interaction and planning abilities. TC‐iFC of transverse gyri (bilaterally) was also inversely correlated with age in the TD group, whereas in the ASD group both overconnectivity and absence of this age‐related effect suggest a lack of typical maturational progression in TC connectivity. The overconnectivity cluster for right parahippocampal gyrus, a region involved in visual encoding and memory [Maguire et al., 1998], was mainly seen in right pulvinar, which is typically connected with medial temporal and parieto‐occipital cortices [Jones, 2007] and may relate to strengths in nonsocial visual processing in ASD [Samson et al., 2012].
Conversely, other parts of the temporal lobe, including bilateral amygdala, left temporal pole, and right fusiform gyrus, were underconnected with thalamus. DTI findings also revealed white matter compromise in tracts connecting left temporal pole and thalamus. Both amygdala and fusiform gyrus play a role in face processing [Kanwisher et al., 1999], and aberrant functioning of these regions is associated with impaired face processing in ASD [Schultz et al., 2003]. Reduced TC‐iFC of right fusiform gyrus was associated with poor language skills and executive functions. Although surprising at first glance, this finding may reflect links between social and executive processing, as suggested by a meta‐analysis of visual processing studies revealing atypically reduced frontal activity during face processing in ASD [Samson et al., 2012]. Weak fusiform‐thalamic response to faces may thus be exacerbated by executive deficits in ASD. In contrast, TC‐iFC of right transverse and left superior temporal gyri was positively correlated with planning and organization skills. TC overconnectivity of auditory cortex furthermore spilled into typically thalamic‐prefrontal networks. Studies have suggested strong connections between dorsolateral prefrontal cortex (DLPFC) and auditory cortex, and involvement of DLPFC in goal‐directed auditory tasks [Procyk and Goldman‐Rakic, 2006]. Our current findings may indicate atypical DLPFC involvement in auditory processing networks in ASD.
Parietal and Occipital Connectivity
For parietal regions, we found mostly reduced iFC, namely with association cortices in superior parietal lobules and supramarginal gyri bilaterally. Superior parietal lobules play important roles in working memory [Koenigs et al., 2009] and spatial orientation [Karnath, 1997], while supramarginal gyri are involved in language functions [Stoeckel et al., 2009] and empathy [Silani et al., 2013]. For both regions volumetric abnormalities have been reported in ASD [Ke et al., 2008]. Our DTI findings also showed compromised thalamic white matter tracts for right SPL, and both iFC and white matter indices were correlated with diagnostic severity. In contrast, a limbic region in right posterior cingulate cortex showed functional overconnectivity with thalamus, associated with repetitive behavior symptom severity. PCC is part of the default mode network, which has been found to be underconnected and poorly modulated (via the salience network) in ASD [Assaf et al., 2010]. The overconnectivity clusters for right posterior cingulate cortex fell mostly within the ventral anterior and ventral lateral nuclei – thalamic subdivisions typically connected with prefrontal and motor cortices [Jones, 2007].
The occipital lobe was the only subdivision with exclusively reduced iFC in the ASD group, presenting the sole exception to the general TC‐iFC pattern of sensorimotor overconnectivity in ASD. Among the underconnected thalamic regions were anterior dorsal nuclei, lateral geniculate nucleus and inferior pulvinar, the latter two typically connecting to occipital cortex. Several studies have indicated increased functional participation of visual cortex in ASD associated with socio‐communicative deficits [Samson et al., 2012]. Our findings suggest that while the occipital lobe may be hyperconnected with itself [Keown et al., 2013], it has reduced connectivity with subcortical visual structures. Reduced thalamic iFC for right occipital pole along with right supramarginal gyrus—both involved in visual/visuospatial processing—was linked with overconnectivity for right parahippocampal gyrus, suggesting enhanced mediotemporal TC connectivity at the expense of parieto‐occipital connectivity in pulvinar [Jones, 2007].
Comparison Between iFC and DTI Findings
There was some convergence of functional and anatomical connectivity findings, with functional underconnectivity for several ROIs (SMA, SFG, left temporal pole, right SPL) accompanied by DTI evidence of white matter compromise. Yet, there were also apparent differences. For temporal regions, group differences in TC‐iFC were robust for STG and TG, without corresponding DTI findings. Notably though, iFC overconnectivity effects were found to be positively correlated with anatomical indices of mean and radial diffusivity for left STG and TG, often considered signs of myelin compromise. For other (especially frontal) regions, both iFC and DTI analyses yielded evidence of aberrant connectivity. For right ACC and bilateral PCG, iFC overconnectivity was associated with increased RD. Right ACC iFC was associated with reduced FA and was significantly correlated with increased MD and RD, again suggesting a link between functional overconnectivity and apparent white matter compromise.
However, the described findings for temporal and frontal ROIs appear contradictory only at first glance and probably reflect limitations of tensor‐based approaches in DTI [Jones et al., 2013]. Generally, the two modalities (iFC, DTI) examine very different parameters of ‘connectivity’ and may therefore not correspond in simple ways. More specifically, reduced FA and increased RD may reflect presence of multiple fiber orientations [Johnson et al., 2013]. Such DTI findings thus do not necessarily imply reduced or impaired connectivity and may, in fact, be consistent with observed functional overconnectivity.
Proximal vs. Distal TC Connectivity
The idea of reduced long‐distance, but increased short‐distance connectivity in ASD has been reiterated in some reviews [Belmonte et al., 2004; Maximo et al., 2014; Wass, 2011], although direct empirical evidence remains limited. We therefore tested whether Euclidian distance of cortical ROIs from thalamus was related to TC‐iFC. A negative correlation was indeed detected in the ASD group, possibly consistent with a hypothesis by Lewis et al. [Lewis et al., 2013] according to which early brain overgrowth in ASD may selectively affect long‐distance connectivity due to greater conduction delays. Although such a correlation was absent in the TD group, a direct group comparison of the relation between distance and TC‐iFC was not significant. Any interpretation of a potential role of distance therefore requires great caution, especially since our measure of Euclidian distance did not optimally accommodate the convoluted morphology of the brain. Rather than distance per se, the pattern of our findings may reflect maturational timelines, suggesting that in the context of early brain overgrowth in ASD [Courchesne et al., 2001], TC connectivity for early‐maturing sensorimotor and limbic regions may be atypically robust, at the expense of TC connectivity for late‐maturing association cortices. These abnormalities are particularly relevant given the importance of TC afferents in the emergence of regional functional specializations in cerebral cortex during early brain development [O'Leary and Nakagawa, 2002].
Limitations
Our ASD cohort was high‐functioning, as only participants able to hold extremely still during MRI scans could be included. Findings may not apply to lower‐functioning children. Second, the inclusionary age range was relatively large. Although, this allowed us to test for age‐related changes, the cross‐sectional nature of our study prevented firm conclusions with respect to maturational changes in TC connectivity between ages 8 and 17 years. Third, our study was more comprehensive for functional connectivity, whereas anatomical analyses (probabilistic tractography) could not be performed for all ROIs due to their computationally demanding nature. Restricting ROIs for these analyses to those with significant iFC group differences, we may have missed some additional group differences in anatomical connectivity. Fourth, atypical thalamocortical connectivity in ASD likely relates to iFC with other subcortical structures (such as basal ganglia) and cerebellum [Khan et al., 2015]. The complex circuits linking these could not be examined in the present study. Finally, our neuropsychological battery included only a few auditory items in the Sensory Profile, but no comprehensive measure of auditory processing and sensitivities that might have permitted broader functional characterization of temporo‐thalamic iFC findings.
CONCLUSIONS
Our findings provide evidence of regionally specific aberrations of thalamic connectivity in frontal and temporal lobes, with additional involvement of some parieto‐occipital ROIs. They suggest—albeit with some exceptions—a gross pattern of functional overconnectivity for earlier‐maturing limbic and sensorimotor regions, but underconnectivity for later maturing supramodal regions. Correlations with diagnostic and behavioral measures further suggest a role of aberrant thalamocortical connectivity in social interaction, executive difficulties, and repetitive and restricted behaviors in ASD.
Supporting information
Supporting Information
ACKNOWLEDGMENTS
None of the authors has any conflict of interest, financial or otherwise, related to the submitted work. Special thanks to the participants and their families. Thanks to Dr. Barbara A. Bailey and Afrooz Jahedi for help with FDR testing.
REFERENCES
- Agam Y, Joseph RM, Barton JJ, Manoach DS (2010): Reduced cognitive control of response inhibition by the anterior cingulate cortex in autism spectrum disorders. Neuroimage 52:336–347. [DOI] [PMC free article] [PubMed] [Google Scholar]
- Alexander‐Bloch AF, Vertes PE, Stidd R, Lalonde F, Clasen L, Rapoport J, Giedd J, Bullmore ET, Gogtay N (2012): The anatomical distance of functional connections predicts brain network topology in health and schizophrenia. Cereb Cortex 23:127–138. [DOI] [PMC free article] [PubMed] [Google Scholar]
- American Psychiatric Association (2013): Diagnostic and Statistical Manual of Mental Disorders Part V. Washington, DC: American Psychiatric Association. [Google Scholar]
- Assaf M, Jagannathan K, Calhoun VD, Miller L, Stevens MC, Sahl R, O'Boyle JG, Schultz RT, Pearlson GD (2010): Abnormal functional connectivity of default mode sub‐networks in autism spectrum disorder patients. Neuroimage 53:247–256. [DOI] [PMC free article] [PubMed] [Google Scholar]
- Beery KE, Beery NA (2010): Beery‐Buktenica Developmental Test of Visual‐Motor Integration, 6th ed. Bloomington, MN: NCS Pearson, Inc. [Google Scholar]
- Belmonte MK, Allen G, Beckel‐Mitchener A, Boulanger LM, Carper RA, Webb SJ (2004): Autism and abnormal development of brain connectivity. J Neurosci 24:9228–9231. [DOI] [PMC free article] [PubMed] [Google Scholar]
- Benjamini Y, Drai D, Elmer G, Kafkafi N, Golani I (2001): Controlling the false discovery rate in behavior genetics research. Behav Brain Res 125:279–284. [DOI] [PubMed] [Google Scholar]
- Cabeza R, Nyberg L (2000): Imaging cognition II: An empirical review of 275 PET and fMRI studies. J Cogn Neurosci 12:1–47. [DOI] [PubMed] [Google Scholar]
- Cheon KA, Kim YS, Oh SH, Park SY, Yoon HW, Herrington J, Nair A, Koh YJ, Jang DP, Kim YB, Leventhal BL, Cho ZH, Castellanos FX, Schultz RT (2011): Involvement of the anterior thalamic radiation in boys with high functioning autism spectrum disorders: A diffusion tensor imaging study. Brain Res 1417:77–86. [DOI] [PubMed] [Google Scholar]
- Cheung C, Chua SE, Cheung V, Khong PL, Tai KS, Wong TK, Ho TP, McAlonan GM (2009): White matter fractional anisotrophy differences and correlates of diagnostic symptoms in autism. J Child Psychol Psychiatry 50:1102–1112. [DOI] [PubMed] [Google Scholar]
- Chugani DC, Muzik O, Rothermel R, Behen M, Chakraborty P, Mangner T, da Silva EA, Chugani HT (1997): Altered serotonin synthesis in the dentatothalamocortical pathway in autistic boys. Ann Neurol 42:666–669. [DOI] [PubMed] [Google Scholar]
- Constantino JN, Gruber CP (2005): Social Responsiveness Scale. Los Angeles, CA: Western Psychological Services. [Google Scholar]
- Cordes D, Haughton VM, Arfanakis K, Carew JD, Turski PA, Moritz CH, Quigley MA, Meyerand ME (2001): Frequencies contributing to functional connectivity in the cerebral cortex in “resting‐state” data. AJNR Am J Neuroradiol 22:1326–1333. [PMC free article] [PubMed] [Google Scholar]
- Courchesne E, Karns CM, Davis HR, Ziccardi R, Carper RA, Tigue ZD, Chisum HJ, Moses P, Pierce K, Lord C, Lincoln AJ, Pizzo S, Schreibman L, Haas RH, Akshoomoff NA, Courchesne RY (2001): Unusual brain growth patterns in early life in patients with autistic disorder: an MRI study. Neurology 57:245–254. [DOI] [PubMed] [Google Scholar]
- Cox RW (1996): AFNI: software for analysis and visualization of functional magnetic resonance neuroimages. Comput Biomed Res 29:162–173. [DOI] [PubMed] [Google Scholar]
- Di Martino A, Fair DA, Kelly C, Satterthwaite TD, Castellanos FX, Thomason ME, Craddock RC, Luna B, Leventhal BL, Zuo XN, Milham MP (2014a): Unraveling the miswired connectome: a developmental perspective. Neuron 83:1335–1353. [DOI] [PMC free article] [PubMed] [Google Scholar]
- Di Martino A, Yan CG, Li Q, Denio E, Castellanos FX, Alaerts K, Anderson JS, Assaf M, Bookheimer SY, Dapretto M, Deen B, Delmonte S, Dinstein I, Ertl‐Wagner B, Fair DA, Gallagher L, Kennedy DP, Keown CL, Keysers C, Lainhart JE, Lord C, Luna B, Menon V, Minshew NJ, Monk CS, Mueller S, Müller RA, Nebel MB, Nigg JT, O'Hearn K, Pelphrey KA, Peltier SJ, Rudie JD, Sunaert S, Thioux M, Tyszka JM, Uddin LQ, Verhoeven JS, Wenderoth N, Wiggins JL, Mostofsky SH, Milham MP (2014b): The autism brain imaging data exchange: towards a large‐scale evaluation of the intrinsic brain architecture in autism. Mol Psychiatry 19:659–667. [DOI] [PMC free article] [PubMed] [Google Scholar]
- Dunn W (1999): The Sensory Profile: User's Manual. San Antonio, TX: The Psychological Corporation. [Google Scholar]
- Fair DA, Bathula D, Mills KL, Dias TG, Blythe MS, Zhang D, Snyder AZ, Raichle ME, Stevens AA, Nigg JT, Nagel BJ (2010): Maturing thalamocortical functional connectivity across development. Front Syst Neurosci 4:10 [DOI] [PMC free article] [PubMed] [Google Scholar]
- Fair DA, Dosenbach NU, Church JA, Cohen AL, Brahmbhatt S, Miezin FM, Barch DM, Raichle ME, Petersen SE, Schlaggar BL (2007): Development of distinct control networks through segregation and integration. Proc Natl Acad Sci U S A 104:13507–13512. 17679691 [Google Scholar]
- Forman SD, Cohen JD, Fitzgerald M, Eddy WF, Mintun MA, Noll DC (1995): Improved assessment of significant activation in functional magnetic resonance imaging (fMRI): Use of a cluster‐size threshold. Magn Reson Med 33:636–647. [DOI] [PubMed] [Google Scholar]
- Friedman SD, Shaw DW, Artru AA, Richards TL, Gardner J, Dawson G, Posse S, Dager SR (2003): Regional brain chemical alterations in young children with autism spectrum disorder. Neurology 60:100–107. [DOI] [PubMed] [Google Scholar]
- Genovese CR, Lazar NA, Nichols T (2002): Thresholding of statistical maps in functional neuroimaging using the false discovery rate. Neuroimage 15:870–878. [DOI] [PubMed] [Google Scholar]
- Gioia GA, Isquith PK, Guy SC, Kenworthy L. (2000): Behavior Rating Inventory of Executive Function. Odessa, FL: Psychological Assessment Resources, Inc. [Google Scholar]
- Gotts SJ, Saad ZS, Jo HJ, Wallace GL, Cox RW, Martin A (2013): The perils of global signal regression for group comparisons: a case study of Autism Spectrum Disorders. Front Human Neurosci 7:356 [DOI] [PMC free article] [PubMed] [Google Scholar]
- Groen WB, Zwiers MP, van der Gaag RJ, Buitelaar JK (2008): The phenotype and neural correlates of language in autism: An integrative review. Neurosci Biobehav Rev 32:1416–1425. [DOI] [PubMed] [Google Scholar]
- Haxby JV, Petit L, Ungerleider LG, Courtney SM (2000): Distinguishing the functional roles of multiple regions in distributed neural systems for visual working memory. Neuroimage 11:380–391. [DOI] [PubMed] [Google Scholar]
- Haznedar MM, Buchsbaum MS, Hazlett EA, LiCalzi EM, Cartwright C, Hollander E (2006): Volumetric analysis and three‐dimensional glucose metabolic mapping of the striatum and thalamus in patients with autism spectrum disorders. Am J Psychiatry 163:1252–1263. [DOI] [PubMed] [Google Scholar]
- Jenkinson M, Bannister P, Brady M, Smith S (2002): Improved optimization for the robust and accurate linear registration and motion correction of brain images. Neuroimage 17:825–841. [DOI] [PubMed] [Google Scholar]
- Jeong JW, Chugani DC, Behen ME, Tiwari VN, Chugani HT (2012): Altered white matter structure of the dentatorubrothalamic pathway in children with autistic spectrum disorders. Cerebellum 11:957–971. [DOI] [PubMed] [Google Scholar]
- Johnson RT, Yeatman JD, Wandell BA, Buonocore MH, Amaral DG, Nordahl CW (2013): Diffusion properties of major white matter tracts in young, typically developing children. Neuroimage 88C:143–154. [DOI] [PMC free article] [PubMed] [Google Scholar]
- Jones DK, Knosche TR, Turner R (2013): White matter integrity, fiber count, and other fallacies: The do's and don'ts of diffusion MRI. Neuroimage 73:239–254. [DOI] [PubMed] [Google Scholar]
- Jones EG (2007): The Thalamus: Cambridge Uni. Press, Cambridge, UK.
- Kana RK, Keller TA, Minshew NJ, Just MA (2007): Inhibitory control in high‐functioning autism: decreased activation and underconnectivity in inhibition networks. Biol Psychiatry 62:198–206. [DOI] [PMC free article] [PubMed] [Google Scholar]
- Kanwisher N, Stanley D, Harris A (1999): The fusiform face area is selective for faces not animals. Neuroreport 10:183–187. [DOI] [PubMed] [Google Scholar]
- Karnath HO (1997): Spatial orientation and the representation of space with parietal lobe lesions. Philos Trans R Soc Lond B Biol Sci 352:1411–1419. [DOI] [PMC free article] [PubMed] [Google Scholar]
- Ke X, Hong S, Tang T, Zou B, Li H, Hang Y, Zhou Z, Ruan Z, Lu Z, Tao G, Liu Y (2008): Voxel‐based morphometry study on brain structure in children with high‐functioning autism. Neuroreport 19:921–925. [DOI] [PubMed] [Google Scholar]
- Keown CL, Shih P, Nair A, Peterson N, Mulvey ME, Muller RA (2013): Local functional overconnectivity in posterior brain regions is associated with symptom severity in autism spectrum disorders. Cell Reports 5:567–572. [DOI] [PMC free article] [PubMed] [Google Scholar]
- Khan AJ, Nair A, Keown CL, Datko M, Lincoln A, Müller RA. Cerebro‐cerebellar resting state functional connectivity in children with Autism Spectrum Disorder. Biol Psychiatry, in press. [DOI] [PMC free article] [PubMed] [Google Scholar]
- Kleinhans NM, Richards T, Sterling L, Stegbauer KC, Mahurin R, Johnson LC, Greenson J, Dawson G, Aylward E (2008): Abnormal functional connectivity in autism spectrum disorders during face processing. Brain 131:1000–1012. [DOI] [PubMed] [Google Scholar]
- Koenigs M, Barbey AK, Postle BR, Grafman J (2009): Superior parietal cortex is critical for the manipulation of information in working memory. J Neurosci 29:14980–14986. [DOI] [PMC free article] [PubMed] [Google Scholar]
- Lam KS, Aman MG (2007): The repetitive behavior scale‐revised: independent validation in individuals with autism spectrum disorders. J Autism Dev Disord 37:855–866. [DOI] [PubMed] [Google Scholar]
- Lewis JD, Theilmann RJ, Townsend J, Evans AC (2013): Network efficiency in autism spectrum disorder and its relation to brain overgrowth. Front Human Neurosci 7:845 [DOI] [PMC free article] [PubMed] [Google Scholar]
- Lord C, Rutter M, DiLavore PC, Risi S, ed. 1999. Autism Diagnotic Observation Schedule. Los Angeles, CA: Western Psychological Services. [Google Scholar]
- Maguire EA, Frith CD, Burgess N, Donnett JG, O'Keefe J (1998): Knowing where things are parahippocampal involvement in encoding object locations in virtual large‐scale space. J Cogn Neurosci 10:61–76. [DOI] [PubMed] [Google Scholar]
- Makris N, Goldstein JM, Kennedy D, Hodge SM, Caviness VS, Faraone SV, Tsuang MT, Seidman LJ (2006): Decreased volume of left and total anterior insular lobule in schizophrenia. Schizophrenia Res 83:155–171. [DOI] [PubMed] [Google Scholar]
- Matsuzaki J, Kagitani‐Shimono K, Goto T, Sanefuji W, Yamamoto T, Sakai S, Uchida H, Hirata M, Mohri I, Yorifuji S, Taniike M (2012): Differential responses of primary auditory cortex in autistic spectrum disorder with auditory hypersensitivity. Neuroreport 23:113–118. [DOI] [PubMed] [Google Scholar]
- Maximo JO, Cadena EJ, Kana RK (2014): The implications of brain connectivity in the neuropsychology of autism. Neuropsychol Rev 24:16–31. [DOI] [PMC free article] [PubMed] [Google Scholar]
- Mizuno A, Villalobos ME, Davies MM, Dahl BC, Müller RA (2006): Partially enhanced thalamocortical functional connectivity in autism. Brain Res 1104:160–174. [DOI] [PubMed] [Google Scholar]
- Müller RA, Chugani DC, Behen ME, Rothermel RD, Muzik O, Chakraborty PK, Chugani HT (1998): Impairment of dentato‐thalamo‐cortical pathway in autistic men: Language activation data from positron emission tomography. Neurosci Lett 245:1–4. [DOI] [PubMed] [Google Scholar]
- Müller RA, Kleinhans N, Kemmotsu N, Pierce K, Courchesne E (2003): Abnormal variability and distribution of functional maps in autism: an FMRI study of visuomotor learning. The American Journal of Psychiatry 160:1847–1862. [DOI] [PubMed] [Google Scholar]
- Murphy K, Birn RM, Handwerker DA, Jones TB, Bandettini PA (2009): The impact of global signal regression on resting state correlations: Are anti‐correlated networks introduced? Neuroimage 44:893–905. [DOI] [PMC free article] [PubMed] [Google Scholar]
- Nachev P, Kennard C, Husain M (2008): Functional role of the supplementary and pre‐supplementary motor areas. Nat Rev Neurosci 9:856–869. [DOI] [PubMed] [Google Scholar]
- Nair A, Treiber JM, Shukla DK, Shih P, Müller RA (2013): Impaired thalamocortical connectivity in autism spectrum disorder: A study of functional and anatomical connectivity. Brain 136:1942–1955. [DOI] [PMC free article] [PubMed] [Google Scholar]
- O'Leary DD, Nakagawa Y (2002): Patterning centers, regulatory genes and extrinsic mechanisms controlling arealization of the neocortex. Curr Opin Neurobiol 12:14–25. [DOI] [PubMed] [Google Scholar]
- Power JD, Barnes KA, Snyder AZ, Schlaggar BL, Petersen SE (2012): Spurious but systematic correlations in functional connectivity MRI networks arise from subject motion. Neuroimage 59:2142–2154. [DOI] [PMC free article] [PubMed] [Google Scholar]
- Power JD, Mitra A, Laumann TO, Snyder AZ, Schlaggar BL, Petersen SE (2014): Methods to detect, characterize, and remove motion artifact in resting state fMRI. Neuroimage 84:320–341. [DOI] [PMC free article] [PubMed] [Google Scholar]
- Procyk E, Goldman‐Rakic PS (2006): Modulation of dorsolateral prefrontal delay activity during self‐organized behavior. J Neurosci 26:11313–11323. [DOI] [PMC free article] [PubMed] [Google Scholar]
- Rutter M, Bailey A, Lord C. (2003a): Social Communication Questionnaire: Western Psychological Services.
- Rutter M, Le Couteur A, Lord C. (2003b): Autism Diagnostic Interview ‐ Revised. Los Angeles, CA: Western Psychological Services. [Google Scholar]
- Saad ZS, Gotts SJ, Murphy K, Chen G, Jo HJ, Martin A, Cox RW (2012): Trouble at rest: How correlation patterns and group differences become distorted after global signal regression. Brain Connect 2:25–32. [DOI] [PMC free article] [PubMed] [Google Scholar]
- Samson F, Mottron L, Soulieres I, Zeffiro TA (2012): Enhanced visual functioning in autism: An ALE meta‐analysis. Hum Brain Mapp 33:1553–1581. [DOI] [PMC free article] [PubMed] [Google Scholar]
- Schultz RT, Grelotti DJ, Klin A, Kleinman J, Van der Gaag C, Marois R, Skudlarski P (2003): The role of the fusiform face area in social cognition: implications for the pathobiology of autism. Philos Trans R Soc Lond B Biol Sci 358:415–427. [DOI] [PMC free article] [PubMed] [Google Scholar]
- Semel E, Wiig EH, Secord WA (2003): Clinical evaluation of language fundamentals, fourth edition (CELF‐4). Toronto, Canada: The Psychological Corporation/A Harcourt Assessment Company. [Google Scholar]
- Shukla DK, Keehn B, Müller RA (2011): Tract‐specific analyses of diffusion tensor imaging show widespread white matter compromise in autism spectrum disorder. J Child Psychol Psychiatry 52:286–295. [DOI] [PMC free article] [PubMed] [Google Scholar]
- Silani G, Lamm C, Ruff CC, Singer T (2013): Right supramarginal gyrus is crucial to overcome emotional egocentricity bias in social judgments. J Neurosci 33:15466–15476. [DOI] [PMC free article] [PubMed] [Google Scholar]
- Smith SM, Jenkinson M, Woolrich MW, Beckmann CF, Behrens TE, Johansen‐Berg H, Bannister PR, De Luca M, Drobnjak I, Flitney DE, Niazy RK, Saunders J, Vickers J, Zhang Y, De Stefano N, Brady JM, Matthews PM (2004): Advances in functional and structural MR image analysis and implementation as FSL. Neuroimage 23 (Suppl 1):S208–S219. 2 [DOI] [PubMed] [Google Scholar]
- Stoeckel C, Gough PM, Watkins KE, Devlin JT (2009): Supramarginal gyrus involvement in visual word recognition. Cortex 45:1091–1096. [DOI] [PMC free article] [PubMed] [Google Scholar]
- Tamura R, Kitamura H, Endo T, Hasegawa N, Someya T (2010): Reduced thalamic volume observed across different subgroups of autism spectrum disorders. Psychiatry Res 184:186–188. [DOI] [PubMed] [Google Scholar]
- Wass S (2011): Distortions and disconnections: Disrupted brain connectivity in autism. Brain Cogn 75:18–28. [DOI] [PubMed] [Google Scholar]
- Wechsler D (1999): Wechsler Abbreviated Scale of Intelligence ‐ 2nd ed San Antonio, TX: The Psychological Corporation. [Google Scholar]
- Yendiki A, Koldewyn K, Kakunoori S, Kanwisher N, Fischl B (2013): Spurious group differences due to head motion in a diffusion MRI study. Neuroimage 88C:79–90. [DOI] [PMC free article] [PubMed] [Google Scholar]
- Zhang D, Snyder AZ, Fox MD, Sansbury MW, Shimony JS, Raichle ME (2008): Intrinsic functional relations between human cerebral cortex and thalamus. J Neurophysiol 100:1740–1748. [DOI] [PMC free article] [PubMed] [Google Scholar]
- Zhang D, Snyder AZ, Shimony JS, Fox MD, Raichle ME (2010): Noninvasive functional and structural connectivity mapping of the human thalamocortical system. Cereb Cortex 20:1187–1194. [DOI] [PMC free article] [PubMed] [Google Scholar]
Associated Data
This section collects any data citations, data availability statements, or supplementary materials included in this article.
Supplementary Materials
Supporting Information