Abstract
In mice, transcription from the zygotic genome is initiated at the mid-1-cell stage after fertilization. Although a recent high-throughput sequencing (HTS) analysis revealed that this transcription occurs promiscuously throughout almost the entire genome in 1-cell stage embryos, a detailed investigation of this process has yet to be conducted using protein-coding genes. Thus, the present study utilized previous RNA sequencing (RNAseq) data to determine the characteristics and regulatory regions of genes transcribed at the 1-cell stage. While the expression patterns of protein-coding genes of mouse embryos were very different at the 1-cell stage than at other stages and in various tissues, an analysis for the upstream and downstream regions of actively expressed genes did not reveal any elements that were specific to 1-cell stage embryos. Therefore, the unique gene expression pattern observed at the 1-cell stage in mouse embryos appears to be governed by mechanisms independent of a specific promoter element.
Keywords: 1-cell embryo, Gene expression, Preimplantation embryo, RNA sequence
Prior to fertilization, growing oocytes actively transcribe their genes, but this process is discontinued when they are fully mature [1]. This transcriptional pause is maintained after fertilization, and during this transcriptionally silent period, all biological processes are governed by maternal mRNA that was transcribed and then accumulated during the growth phase of the oocytes [2]. In mice, the first gene expression from the zygotic genome occurs at the mid-1-cell stage [3, 4]. Transcriptional activity is low in the initial stages of this process and then gradually increases during the 1- and 2-cell stages [4]. Therefore, a large part of the mRNA in 1-cell stage embryos is maternally derived and transcribed during oocyte growth.
Previous studies investigating global gene expression profiles in preimplantation mouse embryos via the use of microarrays identified genes transcribed at the 2-cell stage and later, but not at the 1-cell stage [5,6,7]. This is likely because, depending on the transcription, there is only a small increase in the amount of mRNA during the 1-cell stage, and a comparison of the amounts of mRNA in oocytes and 1-cell stage embryos cannot detect such a small increase. In a recent study, a more quantitative analysis using RNA sequencing (RNAseq) identified approximately 600 genes that are transcribed at the 1-cell stage by identifying genes that showed a 1.5-fold increase between the oocyte stage and the 1-cell stage [8]. Moreover, we recently found that nascent transcripts are rarely spliced in 1-cell stage embryos, and an analysis of the parts of the transcripts that were derived from introns revealed approximately 4,000 protein-coding genes that are transcribed at the 1-cell stage [9]. However, that particular study was conducted with a global view of transcription in the entire genome, and as a result, the characteristics of the expression patterns and regulatory regions of the protein-coding genes were not analyzed in detail. Thus, the present study analyzed the characteristics and regulatory regions of the genes that were transcribed at the 1-cell stage to further elucidate the regulatory mechanisms underlying gene expression in 1-cell stage embryos.
Materials and Methods
Analysis of transcriptome data
An analysis to determine the transcriptomes in metaphase II (MII) stage oocytes and preimplantation embryos was conducted using RNAseq data from a previous study [9]. The RNAseq data from adult tissues and the placenta were obtained from the Long RNAseq project, ENCODE/CSHL (http://hgdownload.cse.ucsc.edu/goldenPath/mm9/encodeDCC/wgEncodeCshlLongRnaSeq/). The present study utilized reads per kilobase per million (RPKM) as an index of the level of expression. RPKM in introns was calculated as follows.
(RPKM in introns) = (total reads of intron in each genes) × 109 / (total reads mapped to mm9 of RNA-Seq) × (length of intron in each genes)
The gene annotation data were obtained from the University of California, Santa Cruz (UCSC), Genome Bioinformatics Group (mm9 releases) (http://hgdownload.soe.ucsc.edu/goldenPath/mm9/database/refGene.txt.gz).
Phylogenetic tree analysis
Pvclust, which is an add-on package for the statistical software R [10], was utilized to create a phylogenetic tree. In this analysis, the actively expressed genes (those ranked in the top 2,000 of the RPKM values) were assigned a value of “1”, while all other genes were assigned a value of “0”.
Analysis to determine the regulatory regions of the protein-coding genes
The regulatory regions of genes that were 1,000 base pairs (bp) upstream and 200 bp downstream from the transcription start site (TSS) were obtained from the UCSC Genome Bioinformatics Group (mm9 releases) and then assessed to identify the GC box [–124 to +5], CAAT box [–155 to –20], TATA box [–90 to +27] and Inr [–55 to +56]. Then, the RepeatMasker program (http://www.repeatmasker.org/) was used to remove low complexity DNA sequences and DNA sequences of interspersed repeats. Promoter elements were detected using the TFBIND software program [11].
A k-mer (k = 6) analysis was performed using the regulatory regions. All possible 6-bp sequences that could be created (46 = 4,096 motifs) were searched for in the sequences of these regions and the number of genes in which a particular 6-mer sequence was found in the regulatory regions was counted.
CpG islands were determined by using an annotation file obtained from the UCSC Genome Bioinformatics Group (mm9 releases; http://hgdownload.soe.ucsc.edu/goldenPath/mm9/database/cpgIslandExt.txt.gz). CpG density was classified as described previously [12].
Analysis of the phenotype associated with adult tissues and the placenta
Information regarding the phenotype associated with disruption of the protein-coding genes was obtained from ToppGene Suite [13], and the p-values of the phenotypes were calculated by a previously reported method [13].
Results
Identification of genes transcribed at the 1-cell stage
We previously found that most mRNAs transcribed at the 1-cell stage are not spliced [9]. Therefore, the RPKM values for the introns of the genes transcribed in the 1-cell stage embryos should be considerably higher in 1-cell stage embryos than in MII stage oocytes. By comparing the intron RPKM values between MII stage oocytes and 1-cell stage embryos, genes transcribed at the 1-cell stage could be identified even if they were also actively transcribed in oocytes. The genes in the 1-cell stage embryos for which the RPKM values for the introns were at least 1.5-fold greater than those in MII stage oocytes were identified; a total of 11,470 genes were transcribed in the 1-cell stage embryos (Supplementary Table 1).
Analysis of gene expression patterns in 1-cell stage embryos
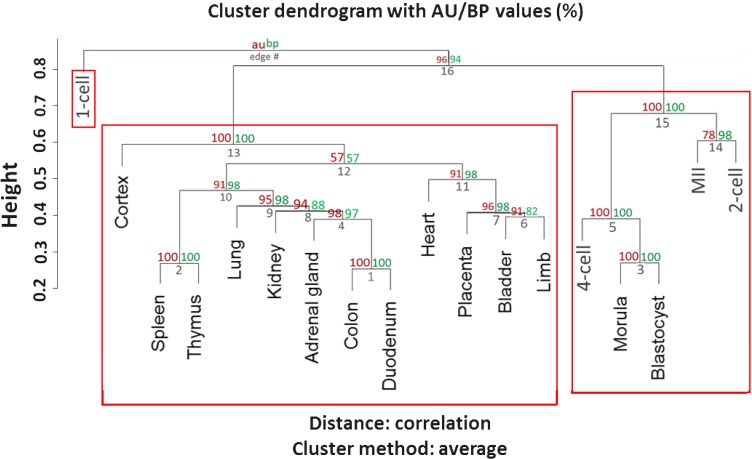
To examine the regulatory mechanisms underlying gene expression at the 1-cell stage, the actively expressed genes for which the RPKM values in the introns were ranked in the top 2,000 were analyzed. By analyzing similarities in the sets of actively expressed genes between the preimplantation embryos and various tissues, the genes could be roughly classified into three groups. The first group included all tissues, the second group included embryos at all stages of preimplantation development (except for the 1-cell stage), and the third group consisted of only 1-cell stage embryos (Fig. 1). Based on the findings according to this grouping, the gene expression pattern in 1-cell stage embryos was unique.
Fig. 1.
Hierarchical clustering of MII oocytes, preimplantation embryos, and 12 different tissues. The similarities of the gene expression patterns in MII stage oocytes, preimplantation embryos and 12 different tissues were analyzed by pvclust [10], which is an add-on package for the statistical software R. Genes with an RPKM value that were ranked in the top 2,000 were defined as actively expressed. For the 1-cell stage embryos, the RPKM values in introns were used to determine the top 2,000 active genes. In the pvclust analysis, the actively expressed genes were given a value of “1,” and the others were given a value of “0.” The values and branches represent approximately unbiased (AU) p-values (red), bootstrap probability values (green) and cluster labels (gray). Clusters are marked by red rectangles.
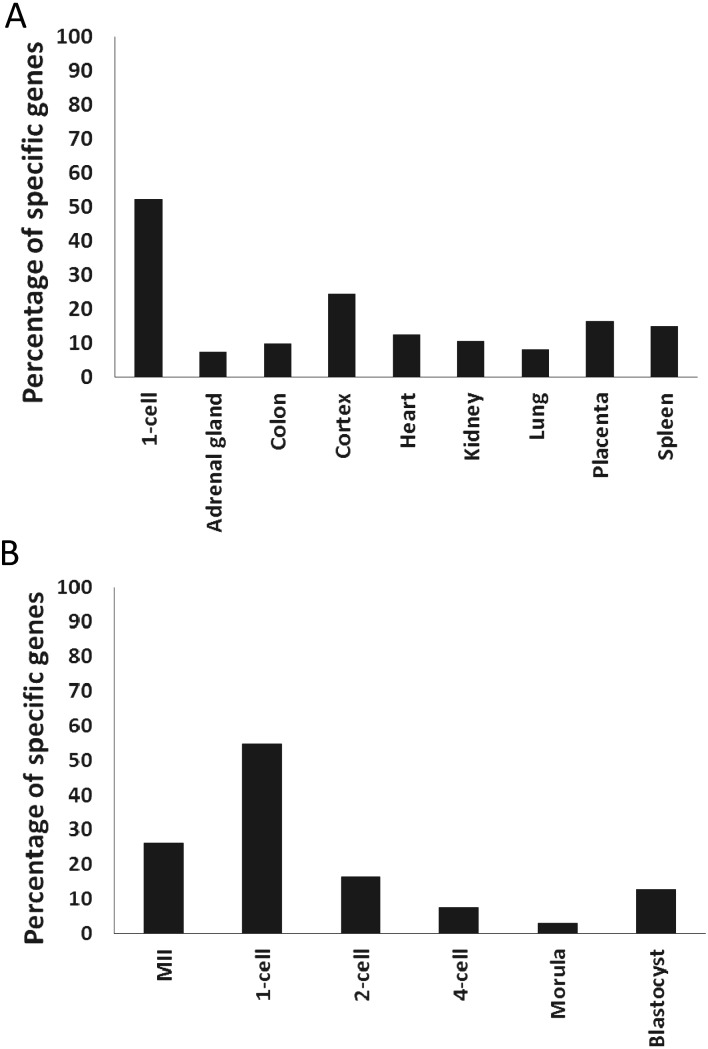
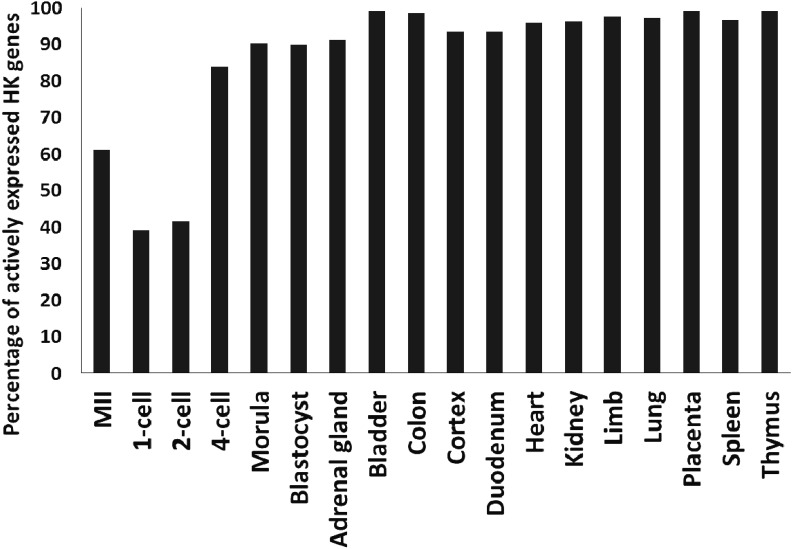
The unique gene expression pattern of 1-cell stage embryos may be the result of the active expression of genes that are either not expressed or expressed at low levels in the majority of tissues and embryos during other stages and/or the low expression levels of genes that are actively expressed in the majority of tissues and embryos. An analysis of the actively expressed genes in various adult tissues and preimplantation embryos indicated that both of these phenomena were associated with the unique pattern of gene expression at the 1-cell stage. An assessment of the actively expressed genes that were unique to a tissue and embryonic stages revealed that the unique genes comprised approximately 10% of the genes in all tissues (Fig. 2A) and less than 30% of the genes during the embryonic stages (Fig. 2B). In contrast, more than 50% of genes were unique to 1-cell stage embryos (Figs. 2A and B). Furthermore, a list of housekeeping (HK) genes that were actively expressed in more than 80% of the tissues and embryos was generated (Supplementary Table 2), and the percentages of these genes that were actively expressed in each tissue and embryo were determined. Although more than 80% of the commonly active HK genes were indeed actively expressed in all tissues and embryos at and after the 4-cell stage, only 40% of these genes were present in the list of genes actively expressed in 1-cell stage embryos (Fig. 3). Therefore, the percentages of commonly active HK genes in 1-cell stage embryos are different from those in all tissues and other stages of embryos except for the 2-cell stage. Taking together the fact that the percentages of unique genes in the actively expressed genes were distinctly different between the 1- and 2-cell stages (Fig. 2B), the gene expression pattern at the 1-cell stage differed significantly from the patterns at the other stages, which suggests that the regulatory mechanisms were specific to this stage.
Fig. 2.
Uniquely expressed genes in preimplantation embryos and tissues. Genes actively expressed only in 1-cell stage embryos or a specific tissue (A) and in MII stage oocytes or embryos at the preimplantation stage (B). The percentages of these uniquely expressed genes relative to the total number of actively expressed genes in each embryo and tissue are shown.
Fig. 3.
Commonly expressed housekeeping (HK) genes among MII stage oocytes, preimplantation embryos and tissues. Common HK genes (n = 219) were defined as those present in at least 80% of the lists of actively expressed genes (top 2,000) in MII stage oocytes, preimplantation embryos and 12 different tissues. The percentages of common HK genes actively expressed in oocytes, preimplantation embryos and tissues are shown.
Analysis to determine the regulatory regions of the genes transcribed at the 1-cell stage
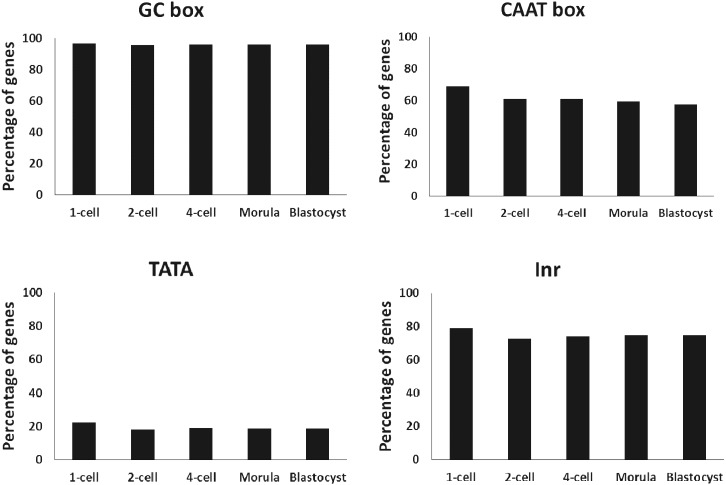
A promoter analysis of the genes actively transcribed at the 1-cell stage was performed to determine the mechanisms that regulate gene expression during this stage. The GC box, CAAT box, TATA box and Inr in the proximal and core promoter regions of the actively expressed genes (top 2,000) were analyzed. All elements were found in similar proportions among the embryos, including 1-cell stage embryos (Fig. 4).
Fig. 4.
Analysis of the cis-regulatory elements in the promoters of actively expressed genes in 1-cell stage embryos. The presence of cis-regulatory elements was examined in the proximal and core promoter regions of the actively expressed genes (top 2,000 RPKM) in the preimplantation embryos. The RPKM values in exons were used for embryos at all stages, excluding 1-cell stage embryos for which the RPKM values in introns were used. The percentages of the genes that possess each proximal promoter (GC box [–124 to +5] and CAAT box [–155 to –20]), core promoter (TATA box [–90 to +27] and Inr [–55 to +56]) are shown.
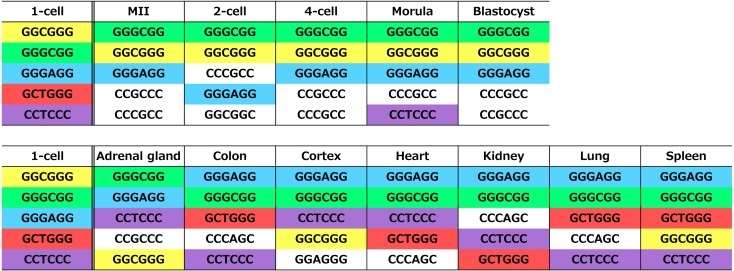
Next, to determine the element(s) that would be involved in the unique gene expression pattern observed at the 1-cell stage, a k-mer analysis (k = 6) was conducted for the 1,000 bp upstream and 200 bp downstream regions of the TSS of the actively expressed genes. To accomplish this, 6-mer sequences of all possible combinations (4,096 motifs) were created and aligned to those upstream and downstream regions of the actively expressed genes. Next, the numbers of genes that were aligned with each sequence at least once in their upstream and downstream regions were counted, and the sequences were ranked using the numbers of genes; the top five sequences in each stage of embryonic development and the oocytes and tissues are provided in Fig. 5. All of the sequences in the 1-cell stage embryos were G/C rich, but each of these sequences was also present in the top five sequences of the other stage embryos, oocytes and tissues. Thus, there were no sequences specific to the 1-cell stage embryos.
Fig. 5.
The 6-mer sequences found most frequently (top 5) in the upstream and downstream regions in actively expressed genes. All 6-mer sequences (n = 4,096) were searched for in the 1,000 bp upstream and 200 bp downstream regions of the TSS of actively expressed genes in preimplantation embryos, oocytes and tissues. Subsequently, the number of the genes that had each of the 6-mer sequences was determined. The sequences that were found most frequently (top 5) in each embryo, oocyte and tissue are listed. The sequences that were identical to those of the 1-cell stage embryos were marked with the same color as that of the 1-cell stage embryos.
Finally, the associations of the transcriptional regulation of actively expressed genes with a CpG density around the TSS (–500 to +2,000) were investigated. These regions were classified as high-, intermediate- and low-CpG density promoters (HCP, ICP and LCP, respectively) based on their CpG densities [12]. The percentage of genes with HCP promoters in 1-cell stage embryos was lower than the percentages in the other preimplantation embryos by 5%, whereas the percentage of genes with LCP promoters was the highest in 1-cell stage embryos (Table 1). These results suggest that the gene expression in 1-cell stage embryos was not regulated by a particular element in the proximal promoters and that it was positively associated with the CpG content around the TSS.
Table 1. Number (%) of the genes with LCP, ICP and HCP promoters.
| Promoter* | 1-cell | 2-cell | 4-cell | Morula | Blastocyst |
| LCP | 171 (8.6)# | 109 (6.0) | 104 (5.7) | 115 (6.4) | 113 (6.2) |
| ICP | 209 (10.5)# | 150 (8.3) | 141 (7.8) | 143 (7.9) | 152 (8.4) |
| HCP | 1610 (80.9) | 1556 (85.7) | 1564 (86.5) | 1549 (85.7) | 1552 (85.4) |
| Total number of genes** | 1990 | 1815 | 1809 | 1807 | 1817 |
* The actively expressed genes ranked in top 2,000 were classified by the CpG contents in their promoters [12]. ** The total numbers of genes was less than 2,000 in each stage and different among the stages because some of the genes were not included in the study of [12] or annotated with RefSeq. # The 1-cell stage is significantly different from all other stages (χ2-test, P < 0.05).
Discussion
We previously found that mRNAs transcribed in 1-cell stage embryos are not spliced and include introns. Based on these findings, the present study identified 11,470 genes that were transcribed at the 1-cell stage and demonstrated that the gene expression pattern of actively expressed genes in 1-cell stage embryos was unique. However, an analysis of the upstream and downstream regions of the genes determined that there were no promoter elements or nucleotide sequences that were specific for the genes that were actively expressed at the 1-cell stage.
In the present study, the actively expressed genes with RPKMs ranked in the top 2,000 were selected, and this list of actively expressed genes, but not their RPKM values, was used to analyze the characteristics of gene expression in preimplantation embryos and tissues. Generally, the RPKM value is used to analyze RNAseq data in order to characterize gene expression patterns, but use of this value is not appropriate for the analysis of preimplantation embryos because it represents the relative expression level and, therefore, is not usable when the total amount of mRNA expressed in a cell differs between samples. Indeed, the total amount of mRNA is greatly altered during preimplantation development. For instance, the amounts of mRNA have been estimated to be 0.26 and 1.42 pg/embryo at the 2-cell and blastocyst stages, respectively, which represents a sixfold difference [14]. Therefore, the present study utilized the list of actively expressed genes rather than the RPKM values in the analyses.
The list of active genes whose expression levels were ranked in the top 2,000 reflected the characteristics of various tissues. For example, genes that were actively expressed only in individual tissues were identified (Fig. 2A), and the most frequently observed phenotypes when these genes were disrupted were investigated. The three most frequently observed phenotypes in each tissue are listed in Table 2; almost all of the phenotypes were related to the characteristics of the tissues. For example, the three most frequently observed phenotypes in the adrenal gland were abnormal aldosterone levels, abnormal adrenal cortex morphology and abnormal thoracic cage morphology. Of these phenotypes, the first two were evidently related to the function and morphology of the adrenal gland, respectively, and thus the list of actively expressed genes reflected the characteristics of the tissues. This suggests that the list of actively expressed genes is useful for characterization of the gene expression patterns in oocytes, preimplantation embryos and various tissues.
Table 2. The phenotypes associated with the genes uniquely expressed in each tissue*.
| Tissue | Phenotype** | P-value*** | Associated phenotype**** |
| Adrenal gland | abnormal aldosterone level | 2.31E-05 | ○ |
| abnormal adrenal cortex morphology | 2.95E-05 | ○ | |
| abnormal thoracic cage morphology | 3.94E-05 | × | |
| Colon | abnormal intestinal epithelium morphology | 9.57E-07 | ○ |
| abnormal exocrine gland morphology | 1.19E-06 | ○ | |
| abnormal crypts of Lieberkuhn morphology | 3.86E-06 | ○ | |
| Cortex | abnormal synaptic transmission | 3.29E-35 | ○ |
| abnormal CNS synaptic transmission | 4.44E-34 | ○ | |
| abnormal nervous system physiology | 2.85E-30 | ○ | |
| Heart | abnormal muscle fiber morphology | 3.99E-18 | ○ |
| abnormal muscle physiology | 1.01E-13 | ○ | |
| abnormal cardiac muscle contractility | 4.13E-12 | ○ | |
| Kidney | abnormal urine homeostasis | 7.97E-22 | ○ |
| abnormal renal/urinary system physiology | 3.42E-21 | ○ | |
| renal/urinary system phenotype | 4.39E-18 | ○ | |
| Lung | abnormal blood vessel morphology | 1.03E-08 | × |
| abnormal developmental vascular remodeling | 6.16E-08 | ○ | |
| abnormal lung morphology | 1.01E-07 | ○ | |
| Placenta | prenatal lethality | 2.98E-08 | ○ |
| embryonic lethality | 7.27E-08 | ○ | |
| abnormal embryogenesis/ development | 1.43E-06 | ○ | |
| Spleen | abnormal blood cell physiology | 1.39E-46 | ○ |
| abnormal hematopoietic system physiology | 7.19E-46 | ○ | |
| abnormal immune cell physiology | 2.10E-43 | ○ | |
* The genes that are actively expressed only in a certain tissue were selected as described in the legend for Fig. 2A. ** The phenotype which is observed when a gene is disrupted. Listed are the most frequently observed phenotypes (ranked in top 3) with the disruption of the genes uniquely expressed in each tissue. *** The probability that the number of the genes associated with the phenotype are not different between the corresponding and all genes. **** The phenotype that is associated with the corresponding tissue is marked as ○, but not associated is ×.
We found that the gene expression pattern in 1-cell stage embryos is unique. Many genes were actively expressed in 1-cell stage embryos and were not actively expressed in embryos during any other stage or in any other tissue (Fig. 2), and a large part of the commonly expressed HK genes were not actively expressed in 1-cell stage embryos (Fig. 3). During the 1-cell stage, intergenic regions are actively expressed, retrotransposons (mainly LINE-1) are explosively transcribed [9, 15, 16], and intergenic regions are widely expressed [9]. Thus, the mechanisms by which particular genes are specifically expressed do not seem to function at the 1-cell stage, which appears to cause a genome-wide activation of transcription at this stage.
An analysis to determine the regulatory regions of actively expressed genes was unable to identify any promoter elements or nucleotide sequences that were specific to 1-cell stage embryos (Figs. 4 and 5), which seems to be consistent with the findings of a reporter gene assay from a previous study by our group [9]. In that study, an original reporter plasmid without a promoter element was evidently transcribed when it was microinjected into 1-cell stage embryos but not when it was microinjected into oocytes or 2-cell stage embryos. Subsequently, transcription started from several sites upstream of the reporter gene. In the present study, no specific promoter elements were identified in the plasmid sequence upstream of the TSS, but there were G/C rich regions. Thus, although no specific sequences were observed, some transcription factors may have been involved.
Our recent study indicated that the GC box is involved in the expression of Tktl1 in 1-cell stage embryos [17]. Moreover, it has been shown that the nuclear concentration of SP1, which is a transcription factor associated with the GC box, increases when transcription is initiated at the 1-cell stage [18, 19]. SP1 binding does not necessarily require a complete GC box consensus sequence because a single generalized hexamer (GGGCGG) substitution and multiple decamer substitutions (G[T]GGGCGGG(A)G[A]C[T]) are tolerated, even if binding affinity is decreased [20, 21]. Therefore, SP1 targets various G/C-rich regions in the genome. It was suggested that the chromatin structure is loosened in 1-cell stage embryos [22, 23], which would facilitate SP1 binding to these regions, albeit with low affinity. Although G/C-rich regions have been identified in 90% of actively expressed genes in all types of tissue and embryos, as well as 1-cell stage embryos (Fig. 4), enhancers and core promoter elements are required for stable transcription in the presence of a tight chromatin structure in tissues and embryos after the 1-cell stage.
Acknowledgments
This work was supported in part by Grants-in-Aid (to FA) from the Ministry of Education, Culture, Sports, Science and Thecnology, Japan (#26112507, #25252054).
References
- 1.Moore GP, Lintern-Moore S, Peters H, Faber M. RNA synthesis in the mouse oocyte. J Cell Biol 1974; 60: 416–422. [DOI] [PMC free article] [PubMed] [Google Scholar]
- 2.Schultz RM. Regulation of zygotic gene activation in the mouse. BioEssays 1993; 15: 531–538. [DOI] [PubMed] [Google Scholar]
- 3.Matsumoto K, Anzai M, Nakagata N, Takahashi A, Takahashi Y, Miyata K. Onset of paternal gene activation in early mouse embryos fertilized with transgenic mouse sperm. Mol Reprod Dev 1994; 39: 136–140. [DOI] [PubMed] [Google Scholar]
- 4.Aoki F, Worrad DM, Schultz RM. Regulation of transcriptional activity during the first and second cell cycles in the preimplantation mouse embryo. Dev Biol 1997; 181: 296–307. [DOI] [PubMed] [Google Scholar]
- 5.Hamatani T, Carter MG, Sharov AA, Ko MS. Dynamics of global gene expression changes during mouse preimplantation development. Dev Cell 2004; 6: 117–131. [DOI] [PubMed] [Google Scholar]
- 6.Wang QT, Piotrowska K, Ciemerych MA, Milenkovic L, Scott MP, Davis RW, Zernicka-Goetz M. A genome-wide study of gene activity reveals developmental signaling pathways in the preimplantation mouse embryo. Dev Cell 2004; 6: 133–144. [DOI] [PubMed] [Google Scholar]
- 7.Zeng F, Schultz RM. RNA transcript profiling during zygotic gene activation in the preimplantation mouse embryo. Dev Biol 2005; 283: 40–57. [DOI] [PubMed] [Google Scholar]
- 8.Park SJ, Komata M, Inoue F, Yamada K, Nakai K, Ohsugi M, Shirahige K. Inferring the choreography of parental genomes during fertilization from ultralarge-scale whole-transcriptome analysis. Genes Dev 2013; 27: 2736–2748. [DOI] [PMC free article] [PubMed] [Google Scholar]
- 9.Abe K, Yamamoto R, Franke V, Cao M, Suzuki Y, Suzuki MG, Vlahovicek K, Svoboda P, Schultz RM, Aoki F. The first murine zygotic transcription is promiscuous and uncoupled from splicing and 3′ processing. EMBO J 2015; 34: 1523–1537. [DOI] [PMC free article] [PubMed] [Google Scholar]
- 10.Suzuki R, Shimodaira H. Pvclust: an R package for assessing the uncertainty in hierarchical clustering. Bioinformatics 2006; 22: 1540–1542. [DOI] [PubMed] [Google Scholar]
- 11.Suzuki Y, Tsunoda T, Sese J, Taira H, Mizushima-Sugano J, Hata H, Ota T, Isogai T, Tanaka T, Nakamura Y, Suyama A, Sakaki Y, Morishita S, Okubo K, Sugano S. Identification and characterization of the potential promoter regions of 1031 kinds of human genes. Genome Res 2001; 11: 677–684. [DOI] [PMC free article] [PubMed] [Google Scholar]
- 12.Mikkelsen TS, Ku M, Jaffe DB, Issac B, Lieberman E, Giannoukos G, Alvarez P, Brockman W, Kim TK, Koche RP, Lee W, Mendenhall E, O’Donovan A, Presser A, Russ C, Xie X, Meissner A, Wernig M, Jaenisch R, Nusbaum C, Lander ES, Bernstein BE. Genome-wide maps of chromatin state in pluripotent and lineage-committed cells. Nature 2007; 448: 553–560. [DOI] [PMC free article] [PubMed] [Google Scholar]
- 13.Chen J, Bardes EE, Aronow BJ, Jegga AG. ToppGene Suite for gene list enrichment analysis and candidate gene prioritization. Nucleic Acids Res 2009; 37: W305–311. [DOI] [PMC free article] [PubMed] [Google Scholar]
- 14.Pikó L, Clegg KB. Quantitative changes in total RNA, total poly(A), and ribosomes in early mouse embryos. Dev Biol 1982; 89: 362–378. [DOI] [PubMed] [Google Scholar]
- 15.Vitullo P, Sciamanna I, Baiocchi M, Sinibaldi-Vallebona P, Spadafora C. LINE-1 retrotransposon copies are amplified during murine early embryo development. Mol Reprod Dev 2012; 79: 118–127. [DOI] [PubMed] [Google Scholar]
- 16.Fadloun A, Le Gras S, Jost B, Ziegler-Birling C, Takahashi H, Gorab E, Carninci P, Torres-Padilla ME. Chromatin signatures and retrotransposon profiling in mouse embryos reveal regulation of LINE-1 by RNA. Nat Struct Mol Biol 2013; 20: 332–338. [DOI] [PubMed] [Google Scholar]
- 17.Hamamoto G, Suzuki T, Suzuki MG, Aoki F. Regulation of transketolase like 1 gene expression in the murine one-cell stage embryos. PLoS ONE 2014; 9: e82087. [DOI] [PMC free article] [PubMed] [Google Scholar]
- 18.Worrad DM, Ram PT, Schultz RM. Regulation of gene expression in the mouse oocyte and early preimplantation embryo: developmental changes in Sp1 and TATA box-binding protein, TBP. Development 1994; 120: 2347–2357. [DOI] [PubMed] [Google Scholar]
- 19.Worrad DM, Schultz RM. Regulation of gene expression in the preimplantation mouse embryo: temporal and spatial patterns of expression of the transcription factor Sp1. Mol Reprod Dev 1997; 46: 268–277. [DOI] [PubMed] [Google Scholar]
- 20.Kadonaga JT, Tjian R. Affinity purification of sequence-specific DNA binding proteins. Proc Natl Acad Sci USA 1986; 83: 5889–5893. [DOI] [PMC free article] [PubMed] [Google Scholar]
- 21.Kriwacki RW, Schultz SC, Steitz TA, Caradonna JP. Sequence-specific recognition of DNA by zinc-finger peptides derived from the transcription factor Sp1. Proc Natl Acad Sci USA 1992; 89: 9759–9763. [DOI] [PMC free article] [PubMed] [Google Scholar]
- 22.Majumder S, Miranda M, DePamphilis ML. Analysis of gene expression in mouse preimplantation embryos demonstrates that the primary role of enhancers is to relieve repression of promoters. EMBO J 1993; 12: 1131–1140. [DOI] [PMC free article] [PubMed] [Google Scholar]
- 23.Cho T, Sakai S, Nagata M, Aoki F. Involvement of chromatin structure in the regulation of mouse zygotic gene activation. Anim Sci J 2002; 73: 113–122. [Google Scholar]


