Abstract
Flavodiiron proteins (FDPs) contain a unique active site consisting of a non-heme diiron carboxylate site proximal to a flavin mononucleotide (FMN). FDPs serve as the terminal components for reductive scavenging of dioxygen (to water) or nitric oxide (to nitrous oxide), which combats oxidative or nitrosative stress in many bacteria. Characterizations of FDPs from spirochetes or from any oral microbes have not been previously reported. Here, we report characterization of an FDP from the anaerobic spirochete, Treponema (T.) denticola, which is associated with chronic periodontitis. The isolated T. denticola FDP exhibited efficient four-electron dioxygen reductase activity and lower but significant anaerobic nitric oxide reductase activity. A mutant T. denticola strain containing the inactivated FDP-encoding gene was significantly more air-sensitive than the wild-type strain. Single turnover reactions of the four-electron-reduced FDP (FMNH2–FeIIFeII) (FDPred) with O2 monitored on the milliseconds to seconds time scale indicated initial rapid formation of a spectral feature consistent with a cis-μ-1,2-peroxo-diferric intermediate, which triggered two-electron oxidation of FMNH2. Reaction of FDPred with NO showed apparent cooperativity between binding of the first and second NO to the diferrous site. The resulting diferrous dinitrosyl complex triggered two-electron oxidation of the FMNH2. Our cumulative results on this and other FDPs indicate that smooth two-electron FMNH2 oxidation triggered by the FDPred/substrate complex and overall four-electron oxidation of FDPred to FDPox constitutes a mechanistic paradigm for both dioxygen and nitric oxide reductase activities of FDPs. Four-electron reductive O2 scavenging by FDPs could contribute to oxidative stress protection in many other oral bacteria.
Keywords: Flavodiiron protein, Nitric oxide reductase, Dioxygen reductase, Spirochete, Treponema denticola
Introduction
Treponema denticola (Td) is a Gram-negative, motile, anaerobic spirochete associated with dental biofilms and chronic periodontitis in humans [1–5]. Td is able to survive the redox stressful periodontal environment despite the absence of genes encoding classical superoxide dismutases or catalases in its genome [6, 7]. The Td genome does, however, encode homologs of peroxiredoxin and superoxide reductase [7, 8], and the transcripts for these two oxidative stress protection enzymes were shown to be upregulated upon exposure of Td to air [9]. Some of the authors recently showed that the superoxide reductase does indeed protect Td against intracellular superoxide generation [10]. Td may also be exposed to nitrosative stress from nitric oxide (NO) generated either by reduction of nitrite in the oral cavity [11] or from the inflammatory response [12, 13]. While the air sensitivity of Td has been well documented [14], we have found no previous reports of the effects of NO exposure on Td. The Td genome lacks a homolog of flavohemoglobin, which provides aerobic nitrosative stress protection in many bacteria by oxidatively scavenging nitric oxide (NO) [15, 16].
The Td genome encodes a putative flavodiiron protein (FDP), which has been implicated in protection against either oxidative stress or anaerobic nitrosative stress in many air-sensitive bacteria, archaea and a few protists [17–32]. This protection is due to FDP’s ability to reductively scavenge either O2 (to H2O) or NO (to N2O) using NADH as the electron donor, and redox-mediating proteins, usually an NADH rubredoxin:oxidoreductase (NROR) and rubredoxin (Rd). These FDP activities are referred to as O2 reductase (O2R) and NO reductase (NOR). In vivo functions of FDPs are usually ascribed to either O2R or NOR activities, but not to both.
The active sites of nearly all characterized FDPs contain a unique and characteristic combination of non-heme diiron carboxylate and flavin mononucleotide (FMN) cofactors, as shown in Scheme 1. Under aerobic conditions, FDPs typically contain a FMNox–FeIIIFeIII active site (FDPox). Both O2R and NOR turnover proceed via four-electron-reduced FDP, which contains an FMNH2–FeIIFeII active site (FDPred). This site can reduce up to four NO to two N2O or one O2 to 2H2O, thereby regenerating FDPox [21]. Here, we show that Td FDP exhibits both O2R and NOR activities in vitro and provide evidence supporting an O2-scavenging function in vivo. Single turnover reactions of FDPred with O2 and NO were used to chronologically resolve reactions at the diiron site from those at the FMN. Our results represent the first characterization of an FDP from any spirochete or from any member of the large consortia of oral bacteria. They also support a paradigm for the cofactor/substrate reaction chronologies in FDPs.
Scheme 1.
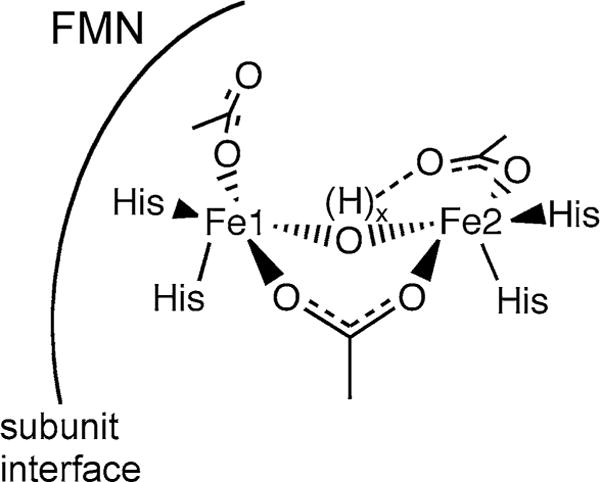
Diagram of FDP active site
Materials and methods
Reagents and general procedures
Reagents and buffers were of the highest quality commercially available. All solutions were prepared in water that had been passed through a Milli-Q® ultrapurification system (Merck Millipore, Inc.) to achieve a resistivity of 18 MΩ. T. denticola (ATCC 35405) was grown in new oral spirochete medium (NOS) with 10 % heat-inactivated rabbit serum, 10 mg of cocarboxylase per mL, at 36 °C in an anaerobic chamber (Coy Laboratory Products) containing an atmosphere of 85 % N2/5 % CO2/10 % H2 [10]. For growth on semi-solid media, 0.5 % agarose was included (NOS agarose). Unless otherwise noted, the buffer for all reactions of the isolated Td FDP was 50 mM 3-(N-morpholino)-propanesulfonic acid (MOPS) pH 7.3, hereafter referred to as buffer. NROR [24] and Rd [33] were prepared as previously described. Nucleotide sequencing was performed at the Wadsworth Center Molecular Genetics Core Facility.
Insertional inactivation of the Td FDP gene
The FDP-encoding gene, TDE1078, in T. denticola 35405 was inactivated by insertion of an erythromycin resistance (erm) cassette using a procedure completely analogous to that previously described by us for production of a mutant strain containing erm-disrupted TDE1754 [1, 10]. The strategy for insertion of the erm cassette into the genomic TDE1078 is described in the Supplementary Material and results confirming this insertion are shown in Figs. S1–S4. The mutant Td strain containing the erm-disrupted TDE1078 is hereafter referred to as 1078 M. Other than erythromycin resistance, the anaerobic growth and propagation of the 1078 M strain in NOS medium were qualitatively indistinguishable from those of the wild-type strain.
Oxidative and nitrosative stress phenotypes
All culture manipulations were conducted in the Coy anaerobic chamber containing the atmosphere listed above. Oxidative stress phenotypes upon exposure of the wild-type and 1078 M strains to air were determined using the liquid culture “single-dose” method, as previously described [10]. Anaerobic NOS cultures were grown to an OD500 ~0.2, then diluted tenfold with air-saturated NOS minus cysteine and thioglycollate, and layered with mineral oil in the anaerobic chamber and incubated at 36 °C. Samples of these treated cultures were removed at various exposure times, serially diluted, and plated on NOS agarose to determine survivals as colony-forming units per milliliter of culture (CFU/mL) after 9 days of anaerobic incubation. For nitric oxide exposure, 10 μL of log-phase culture (OD600 ~0.3) was diluted in 5 mL of NOS and incubated for 1–4 h, after which small volumes of a freshly prepared concentrated stock solution of the nitric oxide donor, diethylammonium (Z)-1-(N,N-diethylamino)diazen-1-ium-1,2-diolate (DEA-NONOate), in 0.01 M NaOH were added to achieve initial concentrations in the range of 0.2–200 μM. Growth curves were obtained (OD600) for up to 5 days at 36 °C. Control experiments showed no effect on growth of the same added volumes of 0.01 M NaOH.
Recombinant FDP expression and purification
The plasmid used to express Td FDP for the in vitro spectroscopic and kinetic studies contained a synthetic FDP gene, the nucleotide sequence of which had been codon-optimized for E. coli expression. This codon-optimized gene was synthesized and subcloned into pAG8H [34] by GenScript (Piscataway, NJ, USA). The plasmid encodes an 8×His-tag at the N-terminal end of the protein. E. coli BL21 (DE3) competent cells (Invitrogen) were transformed with this plasmid. The transformed cells were grown at 37 °C in Luria–Bertani broth supplemented with 100 mg/L ampicillin. Overexpression of the FDP was induced in shaking 1-L cultures when the OD600 reached ~0.8 by the addition of isopropyl β-D-1-thiogalactopyranoside to a concentration of 0.8 mM. 100 mg of ferrous ammonium sulfate was then immediately added to each liter of culture. After 4 h at 37 °C, the cells were harvested by centrifugation. The cell pastes were frozen at −80 °C overnight and then suspended in 50 mM MOPS, 20 mM imidazole, 500 mM NaCl, pH 7.3 (buffer A). The cells were lysed by pulsed sonication, and cell debris was removed by centrifugation. The supernatants were applied to a column containing 10 mL of Ni Sepharose® Fast Flow affinity resin (GE Healthcare) equilibrated with buffer A, and the protein was eluted with buffer A containing 500 mM imidazole. The eluted FDP was washed with 50 mM MOPS, 100 mM NaCl pH 7.3 (buffer B) by several concentration/redilution cycles in 30-kilodalton molecular weight cutoff Amicon centrifugal filters (Millipore). The purified protein, referred to as as-isolated Td FDP, was concentrated to 1–2 mM (active site basis) and stored at −80 °C.
Protein, FMN, and iron analysis
Protein concentrations were determined by the bicinchoninic acid assay (Pierce). Protein iron and FMN contents were determined using a standard ferrozine assay [35], and ε461 nm = 12,000 M−1 cm−1, respectively, the latter of which was also used to determine protein active site concentrations in the FMN-enriched FDP.
FMN enrichment
The as-isolated Td FDP contained 70–80 % of the expected FMN content of 1 per protein monomer. A procedure similar to that previously described for another FDP [36] was used to achieve full FMN occupancy. One milliliter of ~1 mM Td FDP (monomer basis) in buffer B was incubated with ~2 mol FMN:mol FDP monomer at 4 °C overnight. Excess FMN was removed by repetitive concentration/dilution cycles in buffer B until the filtrate was colorless. The FMN:iron mol ratio using this method was reproducibly ~1:2, and protein containing this ratio was used for all in vitro experiments.
Steady-state O2R and NOR activities
Assays were conducted at room temperature (~22 °C) in rubber septum-sealed cuvettes made anaerobic via successive vacuum/N2 exchanges. The one-milliliter assay solutions contained 0.3 μM NROR, 4 μM Rd and 30-nM (active sites) Td FDP in buffer. For O2R assays, various initial concentrations of O2 were achieved by syringe injections of small volumes of air-saturated buffer. Reactions were initiated by the addition of small volumes of NADH from a concentrated stock solution to achieve an initial concentration of 130–200 μM NADH. Rates of NADH consumption were measured spectrophotometrically as ΔA340 nm (ε340 nm = 6220 M−1 cm−1) from linear regression fits to the initial linear portion of the time course. NADH consumption rates were converted to O2 consumption rates assuming a molar consumption ratio of 2NADH:O2. This stoichiometry was determined by repeated injections of small volumes of air-saturated buffer into a septum-sealed-cuvette containing 1 mL of anaerobic assay solutions plus excess NADH and measuring the magnitude of NADH consumption upon each O2 injection. The parameters kcat and Km were determined from unweighted non-linear least squares regression fits of the Michaelis–Menten equation to the set of initial rates versus initial O2 concentrations. NOR activities and kinetics parameters were determined analogously using 1 μM FDP in the assay mixtures. NO was injected into the assay mixture from an anaerobic buffered aqueous solution of saturated NO (~1.8 mM NO). Rates of NO consumption assumed a 1NADH:2NO stoichiometry [30].
Preparation of FDPred
Td FDPred was prepared from the FMN-enriched FDP in 50 mM MOPS pH 7.3 as described for another FDP [37]. An anaerobic solution containing 180–300 μM of Td FDP in buffer containing 2.2 molar equivalents of NADH, Rd (1–5 μM) and NROR (0.5–1 μM) was incubated overnight at room temperature in an anaerobic glove box under an N2 atmosphere. The NADH:FDP mol ratio amounts to a small stoichiometric excess of NADH-reducing equivalents over [FMN + diiron sites].
Stopped-flow spectrophotometry
Stopped-flow UV–Vis absorption spectrophotometry for reactions of Td FDPred with either NO or O2 was performed using an SX20 stopped-flow spectrometer (Applied Photophysics, Ltd.), essentially as described previously for another FDP [36, 37]. All stopped-flow reactions were carried out at 2 °C in buffer. Anaerobic Td FDPred solutions were mixed in the stopped-flow apparatus 1:1 (v/v) with air-saturated buffer, anaerobic NO-saturated buffer or NO delivered from the decay of a buffered solution of disodium 1-[(2-carboxylato)pyrrolidin-1-yl]diazen-1-ium-1,2-diolate (PROLI-NONOate) at 2 °C. Preparation of the PROLI-NONOate solutions and quantification of their NO-delivery equivalents have been described previously [37]. Protein, O2 and NO concentrations immediately after mixing are listed in the figure legends. Spectral time courses were obtained using a photodiode array detector and 1-cm sample cell pathlength. Rate constants were obtained by fitting single-wavelength absorbance time courses to exponential functions using the KaleidaGraph program (Synergy Software). More details are provided in the figure legends.
EPR of FDPred reaction with sub-stoichiometric NO
In the N2-filled glove box, 3.8 μL of a 20-mM PROLI-NONOate solution pre-calibrated for NO delivery was added to a buffered anaerobic solution of 300 μM Td FDPred at room temperature to deliver ~0.5 eq NO per diiron site. The sample was incubated in the glove box at room temperature for ~5 min. ~300 μL of this sample was transferred to a 4-mm O.D. quartz EPR tube and sealed with a septum. The sample was then removed from the glove box and immediately frozen by immersion of the EPR tube in liquid N2. The EPR tube was stored in liquid N2 until spectral collection. EPR spectra were collected on a Bruker ESP 300E X-band spectrometer equipped with a helium continuous flow cryostat model ESR 900 (Oxford Instruments, Inc.).
Results and discussion
Oxidative stress phenotype
The Td genome contains only one gene, TDE1078, encoding a FDP. Western blotting (Fig. S3) of Td cell extracts showed that the Td FDP was expressed in the wild-type strain under standard anaerobic growth conditions, whereas the corresponding mutant strain (1078 M) containing the in-frame erm-disrupted TDE1078 gene did not detectably express the FDP. Using our previously described method [10], we compared the effect of exposure to air-saturated media on the Td wild-type strain with that on the 1078 M strain. The results are shown in Fig. 1. Based on this comparison, the 1078 M strain is clearly more air-sensitive than the wild-type strain. This result is consistent with a reductive scavenging O2R role for Td FDP in vivo.
Fig. 1.
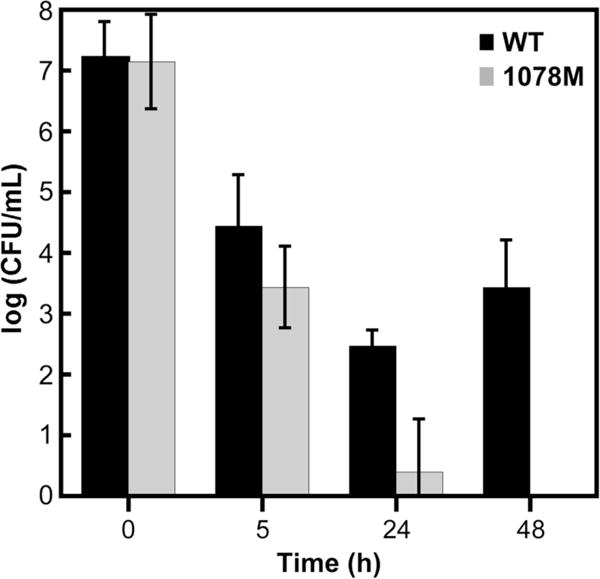
Air sensitivities measured as survivals (CFU/mL) of Td wild-type (WT) and 1078 M strains in liquid cultures after dilution with air-saturated media followed by incubation for the indicated times, serial dilutions and plating. Error bars represent the standard deviations for three trials
O2R steady-state activity
O2 reductase activity of the isolated Td FDP was measured by monitoring NADH consumption upon addition of O2 to anaerobic assay mixtures containing a non-native NROR and Rd as electron transfer mediators. Rds and Rd-like proteins can serve as efficient proximal electron donor to FDPs [24, 30, 37]. The Td genome encodes a single Rd gene, and its transcription was shown to be upregulated upon exposure of Td to dioxygen [9]. Although a Td NROR has not been characterized, a gene (TDE0096) encoding a homologous putative NADH oxidoreductase has been identified [7]. Rd or Rd-like protein domains are known to be fairly promiscuous electron acceptors [22, 30, 31]. We found empirically that, under steady-state conditions, the concentration of Rd rather than that of the NROR limits the rate of electron transfer from NADH to the FDP, and saturating Rd was used for the assays. Little or no O2R activity was observed when Rd was omitted from the activity assay mixtures. A Michaelis–Menten plot of the O2R activity is shown in Fig. 2. Both O2 delivery and initial rates became insufficiently precise below ~10 μM O2. The lowest initial O2 concentration used for the activity data in Fig. 2 was ~12 μM, which gave an initial rate well above half-maximal velocity and, therefore, represents an experimental upper limit on Km,O2. The fitted Km,O2 value, 7 μM, is consistent with this observation. The fitted kcat/Km value, ~4 × 10⁶ M−1 s−1, is within the range reported for FDPs in other organisms where transcriptional and phenotypic evidence indicates an O2 scavenging function (see Table S1) [22, 24, 38–40].
Fig. 2.
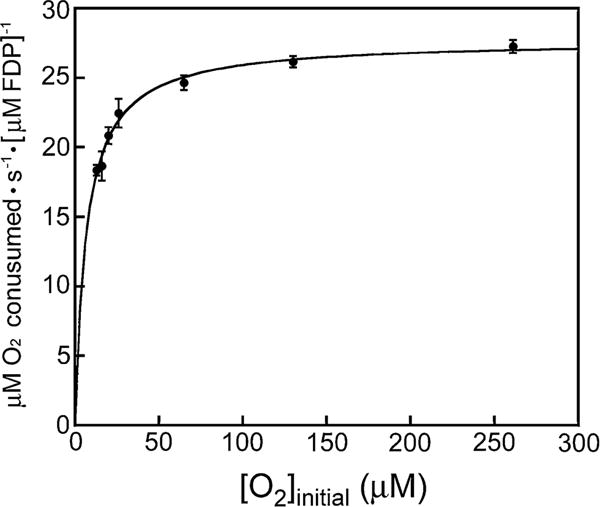
Plot of initial rates vs initial O2 concentrations for O2R activity of Td FDP. Each data point (circles) represents the average of at least three determinations with standard deviations indicated by the vertical bars. The curve through the data points represents the best fit of the Michaelis–Menten equation, which yielded Km,O2 = 7 μM and kcat,O2 = 28 s−1
Single turnover reactions with O2
The in vivo oxidative stress protection and the substantial steady-state O2R activity led us to examine the reaction pathway of Td FDPred with O2 under single turnover conditions. The results are analyzed according to the four-electron O2 reduction pathway shown in Scheme 2. An O2 reduction pathway consisting of two-electron reductions of 2 O2 to 2 H2O2 is ruled out by the stoichiometry of 2 mol NADH consumed per mol O2 added. We determined this stoichiometry from a titration of anaerobic Td FDPred with sub-stoichiometric O2 in the presence of excess NADH and the catalytic electron-transfer enzymes. This stoichiometry and the four-electron reduction of O2 to 2H2O are commonly observed for FDPs [21, 22].1
Scheme 2.

Proposed FDPred + O2 reaction pathway
A UV–Vis absorption stopped-flow spectral time course for the reaction of Td FDPred with O2 is shown in the top panel of Fig. 3. An absorption feature centered at ~650 nm forms within the mixing dead time (<2 ms), then decreases in intensity concomitantly with an increase in an absorption feature with λmax at 462 nm. The developing 462-nm chromophore is due to the two-electron oxidation of FMNH2 to FMNox (ε462 nm = 12,000 M−1 cm−1), which occurs quantitatively in the presence of excess O2.2 Features attributable to the distinctive absorptions of the one-electron-oxidized FMN semiquinone (FMNsq), either neutral or anionic [41], were not apparent at any point in the time course. (features attributable to a peroxy adduct of FMN were also not evident [42]). The bottom panel in Fig. 3 shows that the vast majority of this two-electron FMNH2 oxidation occurred within ~120 ms, which we refer to as Phase I. A very minor portion of the FMNH2 oxidized over the course of ~1 s (Phase II). The fitted kobs for Phase I of the FMNH2 oxidation (462 nm in Table 1) is essentially identical to that for the decrease in absorption of the 650-nm chromophore. This observation together with the tight isosbestic point at ~565 nm implies that the decay of the 650-nm chromophore is directly connected to the smooth conversion of the FMNH2 to FMNox. Difference absorption spectra (O2-reacted minus FDPred, not shown) did not distinctly resolve the 650-nm feature and suggested that some FMNox absorption is present even in the initial mixing dead-time spectrum. We know of no FMN species exhibiting a 650-nm absorption feature resembling that in Fig. 3. We, therefore, assign the 650-nm chromophore to a rapidly formed product of the reaction of O2 with the diferrous site. This product is formulated as a peroxo-diferric species [FeIII–(O22−)–FeIII in Scheme 2]. The 650-nm chromophore is characteristic of cis-μ-1,2 (μ-η1:η1) peroxo-diferric complexes with weak ligand field O-/N-atom coordination spheres [43]. Other coordination modes, such as non-bridging end-on hydroperoxo [44] or a recently proposed μ-η1:η2 peroxo [45], show absorptions centered near 500 nm and are clearly distinct from that observed in Fig. 3. Bridging carboxylate or solvent ligands could also be present. The peroxo-diferric could then be two-electron reduced by the proximal FMNH2, perhaps facilitated by protonation, thereby generating 2H2O and FDPox.3 While the two-electron transfer would presumably occur in two one-electron steps, the second must be relatively rapid, since we observed no accumulation of FMNsq. Rate-determining rearrangement of the initial peroxo-diferric to a more oxidizing species is also conceivable [46, 47].
Fig. 3.
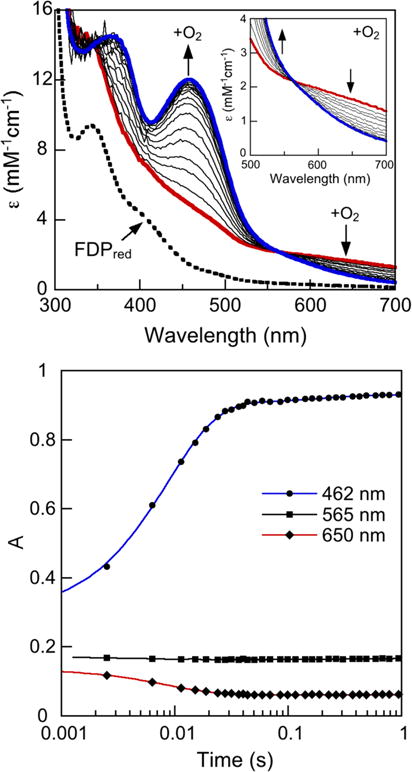
Top panel stopped-flow UV–Vis absorption spectral time course for reaction of Td FDPred (80 μM active sites) with air-saturated buffer [initially ~112 μM O2 after 1:1 (v/v) mixing] at 2 °C. The red trace was recorded at 1.3 ms and the blue trace at 1 s after the mixing dead time (~2 ms). The black traces were recorded in between these limiting times. The inset shows an expanded view of the 500–700 nm region and the isosbestic at 565 nm. Vertical arrows indicate directions of absorbance changes with time. Bottom panel absorbance vs time at 462 nm (filled circle), 565 nm (filled square) (isosbestic), and 650 nm (filled diamond) from the spectral time course shown in the top panel. The traces through the A462 nm and A650 nm time courses represent the best-fit exponentials yielding the observed rate constants listed in Table 1
Table 1.
Observed rate constants (kobs) for the formation of the 462-nm chromophore and decay of the 650-nm chromophore during oxidation of Td FDPred by O2
Obtained from exponential fits to the absorbance time courses shown in the bottom panel of Fig. 3
The average from three time courses with standard deviations in parentheses
NOR steady-state activity
Td FDP showed lower NOR steady-state activity (Fig. 4) compared to its O2R activity [NOR (kcat/Km = 4 × 10³ M−1 s−1)]. Unlike that for the O2R activity, the Michaelis–Menten plot for the NOR activity showed sigmoidal character. Since two NOs are required for production of one N2O, we have previously attributed sigmoidal behavior for steady-state NOR activities of other FDPs to positively cooperative binding of two NOs to the diiron site (presumably one to each iron) [24, 30, 31]. These successive interactions can be described by apparent dissociation constants, Kd(1) and Kd(2), according to Eq. 1 (where ν is initial NO ([NO]init) consumption velocity).
| (1) |
Fig. 4.
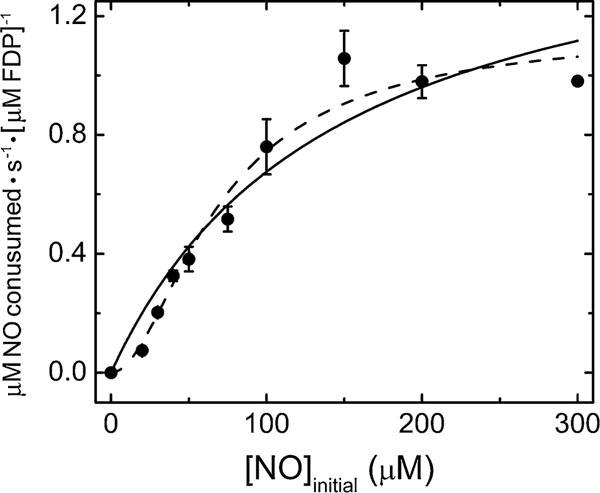
Initial rates versus initial NO concentration plot for NOR activity of Td FDP. Each data point (circles) represents the average of at least three determinations with standard deviations indicated by the vertical bars. The curves represent unweighted non-linear least squares regression fits of either the Michaelis–Menten equation (solid) or the “cooperativity” model described by Eq. 1 (dashed) [31]. The Michaelis–Menten fit yielded Km NO = 280 μM and kcat NO = 1 s−1. The “cooperativity” equation fit yielded apparent dissociation constants, Kd(1) = 290 μM, Kd(2) = 20 μM, and kcat = 1.3 s−1
As shown in Fig. 4, this apparent cooperativity model provided an improved fit to the NO concentration dependence of the NO consumption rates and indicated an approximately 15 times higher apparent affinity for the second NO than the first.
The NO reaction pathway of Td FDPred
The apparently higher affinity of the second NO for Td FDPred is opposite to that reported for T. maritima FDPred, for which the NOR reaction mechanism has recently been characterized in some detail [37, 48]. We, therefore, investigated whether these reversed NO relative affinities indicated a different NO reaction pathway for Td FDP. The previously proposed reaction pathway for T. maritima FDP [37] is shown in Scheme 3 (with H+ and H2O omitted to avoid crowding).
Scheme 3.

FDPred + NO reaction pathway
Stopped-flow UV–Vis absorption spectral time courses for the reaction of Td FDPred with ~0.5 eq NO per diiron site monitored over either 100 ms or 100 s are shown in Fig. 5. Comparison of these time courses shows that the spectral changes are essentially complete within ~100 ms after mixing. At this sub-stoichiometric NO-to-diiron site mol ratio, little or no FMNH2 oxidation is observed even over 100 s. The slight increases in absorbance at ~390 and 490 nm in the 100 s time course (bottom panel of Fig. 5) indicate very minor formation of anionic FMNsq. The lack of significant FMNH2 oxidation justifies subtraction of the FDPred spectrum from those of the NO-treated enzyme, presuming NO reacts only with the diferrous site (which has negligible visible absorption). The 1.3- and 100-ms difference absorption spectra (Fig. 5 top panel, inset) are nearly superimposable with features at ~420, 450 and 630 nm. These difference spectra and their extinction coefficients (based on NO delivered) are characteristic of an S = 3/2 {FeNO}7 chromophore with an O,N coordination sphere (where {FeNO}7 is the Enemark–Feltham notation for ferrous nitrosyl [49]) and closely resemble those for the diferrous mononitrosyl complex (FeII{FeNO}7 in Scheme 3) previously reported for Thermotoga (T.) maritima FDP [37, 50]. These difference spectra are thus consistent with essentially quantitative formation of one {FeNO}7 per NO delivered within the mixing dead time and with the stability of the FMNH2–diferrous mononitrosyl over at least 100 s with 0.5 eq added NO. Analogous stopped-flow spectral time courses (not shown) using higher stoichiometries, but still <1 eq NO per diiron site, indicated some two-electron FMNH2 oxidation. This behavior would be expected if the FMNH2 oxidation required binding of a second NO, and if the affinity of this second NO for the diiron site were significantly higher than that of the first. This expectation is consistent with the cooperativity model used to analyze the steady-state activity data in Fig. 4.
Fig. 5.
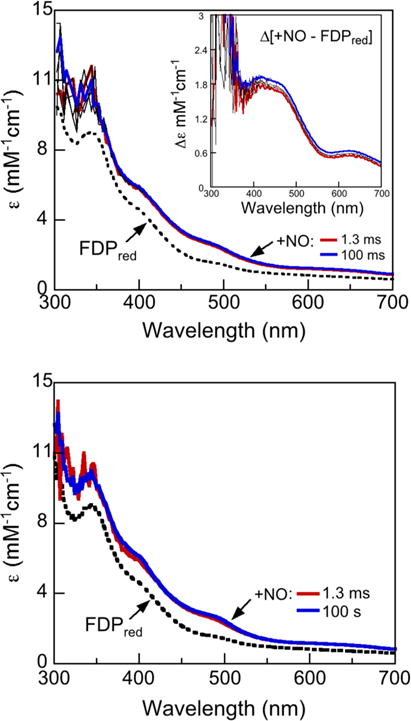
Stopped-flow absorption spectral time courses obtained over either 100 ms (top panel) or 100 s (bottom panel) for reaction of 230 μM Td FDPred with 130 μM NO (concentrations immediately after mixing) anaerobically in buffer at 2 °C. The spectrum labeled FDPred was obtained from the same FDPred solution stopped-flow mixed with deoxygenated buffer in place of the NO solution. Inset in the top panel shows the difference absorption spectra obtained by subtracting the FDPred spectrum from either the 1.3 ms (red trace) or the 100 ms spectrum (blue trace) in the main panel. Indicated times are after the mixing dead time (~2 ms). The extinction coefficient axis in the inset is based on the delivered NO concentration
The identification and stability of the diferrous mononitrosyl complex were verified by the EPR spectrum of a manually mixed sample of Td FDPred with ~0.5 eq NO as shown in Fig. 6. Antiferromagnetic coupling of the high spin FeII with S = 3/2 {FeNO}7 within the diiron site leads to a S = 1/2 ground state with a characteristic EPR signal [37, 50]. The g values of 2.29 and ~2.08 are close to those in the corresponding T. maritima FDP complex. The sharp g = 2.0 signal is assigned to a very minor amount of FMNsq.
Fig. 6.
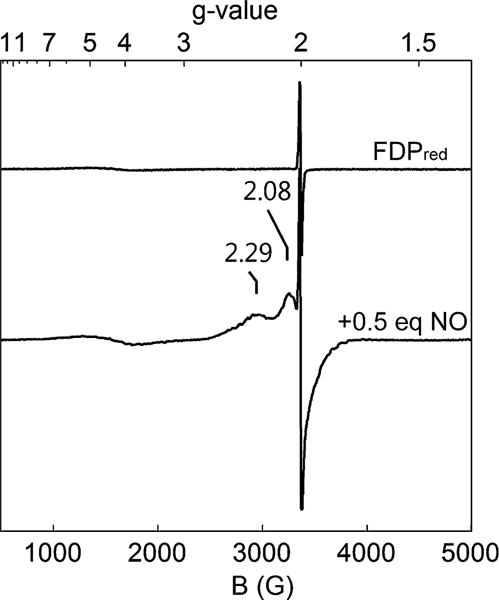
X-band EPR spectra of an anaerobic solution of 300 μM Td FDPred in buffer (black trace) and of the same sample after the addition of 0.5 eq NO, incubation of the mixture for ~5 min at room temperature, and then freezing in liquid N2 (red trace). Spectral collection parameters were: temperature 4 K, modulation frequency 100 kHz, microwave power 21 mW, modulation amplitude 10.5 G, conversion time 81.9 ms, time constant 5.1 ms
Stopped-flow UV–Vis absorption spectral time courses for reaction of Td FDPred with excess NO over either 130 ms or 10 s are shown in Fig. 7. The bottom panel of Fig. 7 shows that, unlike the case with 0.5 eq NO, reaction with a tenfold molar excess NO resulted in smooth and essentially quantitative two-electron oxidation of FMNH2 to FMNox over the course of a few seconds. However, a comparison of the time courses in the top and bottom panels of Fig. 7 indicated that at most, only a very minor portion of the FMNH2 oxidation occurred over the initial 130 ms of reaction, which once again justifies subtraction of the FDPred spectrum from those of the NO-treated enzyme obtained during this initial reaction time period. The difference absorption spectral time course (Fig. 7, top panel, inset) revealed that an {FeNO}7 chromophore accumulated within the mixing dead time (red trace). This dead-time difference absorption closely resembles the spectrum assigned to the diferrous mononitrosyl in Fig. 5. The subsequent difference spectra show development of a more intensely absorbing {FeNO}7 chromophore, which accumulates maximally at ~100 ms. This intensification is assigned to essentially quantitative accumulation of a diferrous dinitrosyl ([{FeNO}7]2 in Scheme 3), which is consistent with its estimated extinction coefficient of ~3000 M−1 cm−1 (diiron site basis) at 130 ms [37, 38]. The subsequent FMNH2 oxidation (Fig. 7, bottom panel) is chronologically separable from formation of the diferrous dinitrosyl complex. This two-electron FMNH2 oxidation occurs on the same time scale as the steady state kcat ~1 s−1. This correlation is consistent with NOR turnover being rate-limited by a process that triggers two-electron FMNH2 oxidation. Our detailed investigations of the NO reaction with T. maritima FDPred [37, 48] indicated that the rate-limiting process for NOR turnover is the “spontaneous” conversion of the diferrous dinitrosyl to diferric with release of N2O generating a transient FMNH2/FeIIIFeIII species (Scheme 3). The proximal FMNH2 then rapidly re-reduces the diferric site, resulting in FMNox/FeIIFeII. With excess NO, the diferrous site then undergoes a second analogous reaction sequence resulting in a second N2O and FDPox. The UV–Vis absorption spectral features of ferrous nitrosyl intermediates accumulating during this second turnover are obscured by the much more intense FMNox absorption.
Fig. 7.
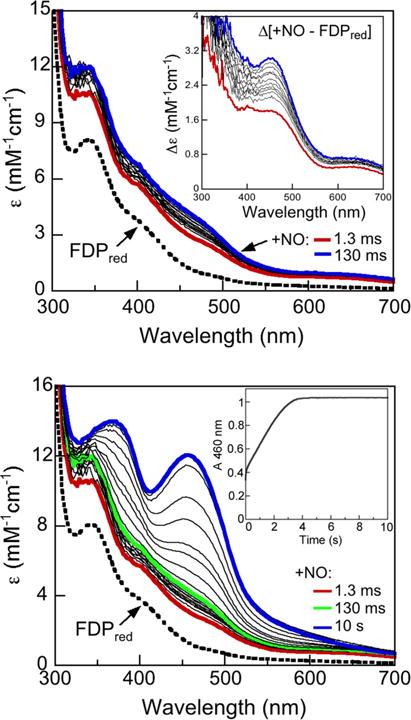
Stopped-flow absorption spectral time courses obtained over either 130 ms (top panel) or 1 s (bottom panel) for reaction of 90 μM Td FDPred with 900 μM NO (concentrations immediately after mixing) anaerobically in buffer at 2 °C. Indicated times are after the mixing dead time (~2 ms). The spectrum labeled FDPred was obtained upon stopped-flow mixing the same FDPred solution with deoxygenated buffer in place of the NO solution. The inset in the top panel shows the difference absorption spectra obtained by subtracting the FDPred (dashed) spectrum from either the 1.3 ms (red trace) or the 100 ms spectrum (blue trace) in the main panel. Extinction coefficient axes are on an active site basis
In vitro/in vivo correlations
To our knowledge, these results constitute the first reported characterization of an FDP from any spirochete or from any of the numerous oral bacterial phyla [4, 5]. The increased sensitivity of the Td 1078 M strain to air-saturated medium relative to the wild-type strain together with the efficient steady-state O2R activity for the isolated enzyme supports an O2-scavenging function for Td FDP in the likely sub-aerobic but fluctuating O2 levels of the periodontal environment [5, 9]. A previous study did not observe upregulation of the FDP gene (TDE1078) transcription upon exposure of Td to air [9]. Our Western blotting (Fig. S3) and a previous proteomics study [51] instead showed constitutive expression of the FDP in T. denticola under anaerobic growth conditions. This constitutive expression could function as a pre-emptive defense in contrast to other oxidative stress protection enzymes, which are upregulated upon exposure of T. denticola to air [9]. FDPs could provide oxidative stress protection in many other oral bacteria. Our search of the National Center for Biotechnology Information database found FDP homologs encoded in the genomes of at least five other oral treponemal species as well as in genomes of other bacterial phyla associated with periodontitis [3, 4, 52]. Td is a member of the so-called “red complex”, a consortium of three bacterial species associated with severe and chronic periodontitis [2, 3, 53]. The genomes of all three members encode FDP homologs.
The steady-state kinetics of Td FDP showed significant NOR activity albeit less efficient than the O2R activity. We did not observe a reproducible differential sensitivity between the wild-type and 1078 M strains to a commonly used NO-delivery agent at levels spanning the purported range of NO concentrations encountered in the periodontal pocket [54]. Under an anaerobic atmosphere, growths of both strains were typically unaffected at up to 2 μM added DEA-NONOate, significantly inhibited between 20 and 100 μM DEA-NONOate, and completely suppressed at 200 μM DEA-NONOate (data not shown). However, manifestation of an NO-scavenging role for Td FDP may depend on growth conditions or the source and rate of NO production in the complex environment of the periodontal pocket [23, 55–61].
Relative O2R vs NOR activities of FDPs
Most characterized FDPs exhibit both O2R and NOR activities to varying levels in vitro [22, 24, 30, 31, 37, 62]. Evidence for bifunctional O2 and NO scavenging of individual FDPs in vivo is less common [20, 63]. Up to now, the relatively higher O2R vs NOR activity found for Td FDP in this work has been more commonly observed for FDPs than has the reverse (see Table S1). However, some FDPs have relatively similar NOR and O2R activities. In the case of NO, our results establish that Td and T. maritima FDPs have similar kcat values (Table S1) and the same single turnover reaction sequence despite their reversed relative affinities for the first and second NO. The structural factors that modulate the relative O2R vs NOR activities and NO affinities have not been elucidated. Modeling of NO occupancy indicates that two NO molecules can be accommodated in the active site pockets of FDPs without significant rearrangment of amino acid residues lining the pockets [21, 64]. The crystal structure of Desulfovibrio gigas FDP showed that a conserved His residue, which serves as an iron ligand in all other structurally characterized FDPs, was replaced by solvent [65]. The reported O2R and NOR kcat values for this FDP, however, are both near the high end of the range for FDPs and differ by a factor of only ~3 (see Table S1) [20]. Furthermore, substitutions of the analogous His ligand residue in T. maritima FDP with either asparagine or alanine resulted in only very minor effects on both the diiron site structure and activities [36]. Modulation of the relative O2R vs NOR activities by substitutions of more distant residues in another FDP has been claimed [62].
A mechanistic paradigm for flavodiiron proteins
Our kinetics results support the generality of both the O2 and NO reaction pathways of FDPs, which are diagrammed in Schemes 2 and 3, respectively. With excess NO, the stopped-flow single turnover time courses for both Td FDPred (Fig. 7) and T. maritima FDPred [37] showed that the diferrous mononitrosyl to dinitrosyl conversion occurs prior to the rate-determining step for turnover. Quantitative formation of the diferrous dinitrosyl species occurred more than 10 times faster than FMNH2 oxidation in Td FDP, and a similar chronological separation of these two processes was observed for T. maritima FDP [37]. The rate-determining step for NOR turnover at saturating NO must, therefore, occur after diferrous dinitrosyl formation in both Td and T. maritima FDPs. We previously formulated the rate-determining step in the T. maritima FDPred reaction with excess NO as “spontaneous” decay of the diferrous dinitrosyl to diferric + N2O (r.d.s. in Scheme 3) [37]. This rate-determining “spontaneous” decay is supported by the observation that deflavinated T. maritima diferrous FDP reacted with NO to form the same diferrous dinitrosyl species, which decayed to diferric with formation of N2O on the same time scale as the FMNH2 oxidation in the flavinated FDP [38, 48]. In our proposed mechanism, the r.d.s. is followed by rapid reduction of the diferric back to the diferrous oxidation level by the proximal FMNH2 (Scheme 3). A much less resolvable lag between formation of the diiron substrate complex and two-electron FMNH2 oxidation appears to occur for the O2R single turnover reactions of both Td (Fig. 3) and T. maritima FDPred [36]. In this case, rapid reduction of the initially formed peroxo-diferric by the proximal FMNH2 could minimize formation or side reactions of subsequent, more oxidizing diiron–O2 intermediates [46, 47, 66]. Our cumulative results on Td and T. maritima FDPs thus provide a paradigm for FDP catalysis. Reaction with FDPred leads to a catalytically committed diiron/substrate complex (containing either one O2 or two NO) and an oxidizing diiron site, either peroxo-diferric (for O2R) or diferric (the decay product of a diferrous dinitrosyl for NOR). The oxidizing diiron site triggers two-electron oxidation of the proximal FMNH2 [22, 36, 37]. Turnover of FDPred via either one O2 or four NO results in a four-electron-oxidized active site (FDPox) according to Schemes 2 or 3, respectively.
Supplementary Material
Acknowledgments
This work was supported by the National Institutes of Health (GM040388 to D. M. K., Jr., and MBRS/RISE GM060655 to J.D.C.). We thank A.-N. Albetel and Dr. D. A. Wampler for initial isolation and some characterization of Td FDP and Dr. N. Giri for determination of the NADH:H2O2 oxidoreductase activity.
Footnotes
Electronic supplementary material The online version of this article (doi:10.1007/s00775-015-1248-4) contains supplementary material, which is available to authorized users.
Td FDP showed a modest level of NADH:H2O2 oxidoreductase activity [~3 μM H2O2 consumed·s−1·(μM FDP)−1, assuming a 1NADH:1H2O2 stoichiometry] in anaerobic assay solutions containing 200 μM added H2O2.
For the four-electron process, the initial concentrations of O2 and FDPred used for the time course in Fig. 3 is sufficient to completely oxidize the FDPred to FDPox.
We found no significant differences in kobs at pH 9 from those at pH 7 listed in Table 1.
Contributor Information
Rosanne E. Frederick, Department of Chemistry, University of Texas at San Antonio, San Antonio, TX 78249, USA
Jonathan D. Caranto, Department of Chemistry, University of Texas at San Antonio, San Antonio, TX 78249, USA
Cesar A. Masitas, Department of Chemistry, University of Texas at San Antonio, San Antonio, TX 78249, USA
Linda L. Gebhardt, Wadsworth Center, New York State Department of Health, Albany, NY 12201, USA
Charles E. MacGowan, Wadsworth Center, New York State Department of Health, Albany, NY 12201, USA
Ronald J. Limberger, Wadsworth Center, New York State Department of Health, Albany, NY 12201, USA
Donald M. Kurtz, Jr., Email: donald.kurtz@utsa.edu, Department of Chemistry, University of Texas at San Antonio, San Antonio, TX 78249, USA.
References
- 1.Limberger RJ, Slivienski LL, Izard J, Samsonoff WA. J Bacteriol. 1999;181:3743–3750. doi: 10.1128/jb.181.12.3743-3750.1999. [DOI] [PMC free article] [PubMed] [Google Scholar]
- 2.Holt SC, Ebersole JL. Periodontol. 2005;2000(38):72–122. doi: 10.1111/j.1600-0757.2005.00113.x. [DOI] [PubMed] [Google Scholar]
- 3.Dashper SG, Seers CA, Tan KH, Reynolds EC. J Dent Res. 2011;90:691–703. doi: 10.1177/0022034510385242. [DOI] [PMC free article] [PubMed] [Google Scholar]
- 4.Paster BJ, Boches SK, Galvin JL, Ericson RE, Lau CN, Levanos VA, Sahasrabudhe A, Dewhirst FE. J Bacteriol. 2001;183:3770–3783. doi: 10.1128/JB.183.12.3770-3783.2001. [DOI] [PMC free article] [PubMed] [Google Scholar]
- 5.Frederick JR, Sarkar J, McDowell JV, Marconi RT. J Dent Res. 2011;90:1155–1163. doi: 10.1177/0022034511402994. [DOI] [PMC free article] [PubMed] [Google Scholar]
- 6.Seshadri R, Myers GS, Tettelin H, Eisen JA, Heidelberg JF, Dodson RJ, Davidsen TM, DeBoy RT, Fouts DE, Haft DH, Selengut J, Ren Q, Brinkac LM, Madupu R, Kolonay J, Durkin SA, Daugherty SC, Shetty J, Shvartsbeyn A, Gebregeorgis E, Geer K, Tsegaye G, Malek J, Ayodeji B, Shatsman S, McLeod MP, Smajs D, Howell JK, Pal S, Amin A, Vashisth P, McNeill TZ, Xiang Q, Sodergren E, Baca E, Weinstock GM, Norris SJ, Fraser CM, Paulsen IT. Proc Natl Acad Sci. 2004;101:5646–5651. doi: 10.1073/pnas.0307639101. [DOI] [PMC free article] [PubMed] [Google Scholar]
- 7.Parsonage D, Desrosiers DC, Hazlett KRO, Sun YC, Nelson KJ, Cox DL, Radolf JD, Poole LB. Proc Natl Acad Sci. 2010;107:6240–6245. doi: 10.1073/pnas.0910057107. [DOI] [PMC free article] [PubMed] [Google Scholar]
- 8.Veith PD, Dashper SG, O’Brien-Simpson NM, Paolini RA, Orth R, Walsh KA, Reynolds EC. Biochim Biophys Acta. 2009;1794:1421–1432. doi: 10.1016/j.bbapap.2009.06.001. [DOI] [PubMed] [Google Scholar]
- 9.McHardy I, Keegan C, Sim JH, Shi WY, Lux R. PLoS One. 2010;5:e13655. doi: 10.1371/journal.pone.0013655. [DOI] [PMC free article] [PubMed] [Google Scholar]
- 10.Caranto JD, Gebhardt LL, MacGowan CE, Limberger RJ, Kurtz DM., Jr Biochemistry. 2012;51:5601–5610. doi: 10.1021/bi300667s. [DOI] [PMC free article] [PubMed] [Google Scholar]
- 11.Lewis JP, Yanamandra SS, Anaya-Bergman C. Infect Immun. 2012;80:3319–3331. doi: 10.1128/IAI.00561-12. [DOI] [PMC free article] [PubMed] [Google Scholar]
- 12.Tanabe SI, Bodet C, Grenier D. J Cell Physiol. 2008;216:727–731. doi: 10.1002/jcp.21447. [DOI] [PubMed] [Google Scholar]
- 13.Rosen G, Sela MN, Naor R, Halabi A, Barak V, Shapira L. Infect Immun. 1999;67:1180–1186. doi: 10.1128/iai.67.3.1180-1186.1999. [DOI] [PMC free article] [PubMed] [Google Scholar]
- 14.Lai YL, Chu LR. Appl Environ Microbiol. 2008;74:73–79. doi: 10.1128/AEM.01972-07. [DOI] [PMC free article] [PubMed] [Google Scholar]
- 15.Rodionov DA, Dubchak IL, Arkin AP, Alm EJ, Gelfand MS. PLoS Comput Biol. 2005;1:415–431. doi: 10.1371/journal.pcbi.0010055. [DOI] [PMC free article] [PubMed] [Google Scholar]
- 16.Gardner PR. J Inorg Biochem. 2005;99:247–266. doi: 10.1016/j.jinorgbio.2004.10.003. [DOI] [PubMed] [Google Scholar]
- 17.Gardner AM, Helmick RA, Gardner PR. J Biol Chem. 2002;277:8172–8177. doi: 10.1074/jbc.M110471200. [DOI] [PubMed] [Google Scholar]
- 18.Saraiva LM, Vicente JB, Teixeira M. Adv Microb Physiol. 2004;49:77–129. doi: 10.1016/S0065-2911(04)49002-X. [DOI] [PubMed] [Google Scholar]
- 19.Sarti P, Fiori PL, Forte E, Rappelli P, Teixeira M, Mastronicola D, Sanciu G, Giuffrâe A, Brunori M. Cell Mol Life Sci. 2004;61:618–623. doi: 10.1007/s00018-003-3413-8. [DOI] [PMC free article] [PubMed] [Google Scholar]
- 20.Rodrigues R, Vicente JB, Felix R, Oliveira S, Teixeira M, Rodrigues-Pousada C. J Bacteriol. 2006;188:2745–2751. doi: 10.1128/JB.188.8.2745-2751.2006. [DOI] [PMC free article] [PubMed] [Google Scholar]
- 21.Kurtz DM., Jr Dalton Trans. 2007;37:4115–4121. [Google Scholar]
- 22.Di Matteo A, Scandurra FM, Testa F, Forte E, Sarti P, Brunori M, Giuffre A. J Biol Chem. 2008;283:4061–4068. doi: 10.1074/jbc.M705605200. [DOI] [PubMed] [Google Scholar]
- 23.Mills PC, Rowley G, Spiro S, Hinton JCD, Richardson DJ. Microbiol. 2008;154:1218–1228. doi: 10.1099/mic.0.2007/014290-0. [DOI] [PubMed] [Google Scholar]
- 24.Hillmann F, Riebe O, Fischer RJ, Mot A, Caranto JD, Kurtz DM, Jr, Bahl H. FEBS Lett. 2009;583:241–245. doi: 10.1016/j.febslet.2008.12.004. [DOI] [PMC free article] [PubMed] [Google Scholar]
- 25.Vine CE, Cole JA. FEMS Microbiol Lett. 2011;325:99–107. doi: 10.1111/j.1574-6968.2011.02425.x. [DOI] [PubMed] [Google Scholar]
- 26.Le Fourn C, Brasseur G, Brochier-Armanet C, Pieulle L, Brioukhanov A, Ollivier B, Dolla A. Environ Microbiol. 2011;13:2132–2145. doi: 10.1111/j.1462-2920.2011.02439.x. [DOI] [PubMed] [Google Scholar]
- 27.Vicente JB, Tran V, Pinto L, Teixeira M, Singh U. Eukaryot Cell. 2012;11:1112–1118. doi: 10.1128/EC.00149-12. [DOI] [PMC free article] [PubMed] [Google Scholar]
- 28.Kern M, Volz J, Simon J. Environ Microbiol. 2011;13:2478–2494. doi: 10.1111/j.1462-2920.2011.02520.x. [DOI] [PubMed] [Google Scholar]
- 29.Thorgersen MP, Stirrett K, Scott RA, Adams MWW. Proc Natl Acad Sci. 2012;109:18547–18552. doi: 10.1073/pnas.1208605109. [DOI] [PMC free article] [PubMed] [Google Scholar]
- 30.Silaghi-Dumitrescu R, Coulter ED, Das A, Ljungdahl LG, Jameson GN, Huynh BH, Kurtz DM., Jr Biochemistry. 2003;42:2806–2815. doi: 10.1021/bi027253k. [DOI] [PubMed] [Google Scholar]
- 31.Silaghi-Dumitrescu R, Ng KY, Viswanathan R, Kurtz DM., Jr Biochemistry. 2005;44:3572–3579. doi: 10.1021/bi0477337. [DOI] [PubMed] [Google Scholar]
- 32.Allahverdiyeva Y, Mustila H, Ermakova M, Bersanini L, Richaud P, Ajlani G, Battchikova N, Cournac L, Aro EM. Proc Natl Acad Sci. 2013;110:4111–4116. doi: 10.1073/pnas.1221194110. [DOI] [PMC free article] [PubMed] [Google Scholar]
- 33.Coulter ED, Kurtz DM., Jr Arch Biochem Biophys. 2001;394:76–86. doi: 10.1006/abbi.2001.2531. [DOI] [PubMed] [Google Scholar]
- 34.Schaller RA, Ali SK, Klose KE, Kurtz DM., Jr Biochemistry. 2012;51:8563–8570. doi: 10.1021/bi3011797. [DOI] [PMC free article] [PubMed] [Google Scholar]
- 35.Stookey LL. Anal Chem. 1970;42:779–781. [Google Scholar]
- 36.Fang H, Caranto JD, Mendoza R, Taylor AB, Hart PJ, Kurtz DM., Jr J Biol Inorg Chem. 2012;17:1231–1239. doi: 10.1007/s00775-012-0938-4. [DOI] [PMC free article] [PubMed] [Google Scholar]
- 37.Caranto JD, Weitz A, Hendrich MP, Kurtz DM., Jr J Am Chem Soc. 2014;136:7981–7992. doi: 10.1021/ja5022443. [DOI] [PMC free article] [PubMed] [Google Scholar]
- 38.Hayashi T, Caranto JD, Wampler DA, Kurtz DM, Jr, Moënne-Loccoz P. Biochemistry. 2010;49:7040–7049. doi: 10.1021/bi100788y. [DOI] [PMC free article] [PubMed] [Google Scholar]
- 39.Le Fourn C, Fardeau ML, Ollivier B, Lojou E, Dolla A. Environ Microbiol. 2008;10:1877–1887. doi: 10.1111/j.1462-2920.2008.01610.x. [DOI] [PubMed] [Google Scholar]
- 40.Seedorf H, Dreisbach A, Hedderich R, Shima S, Thauer RK. Arch Microbiol. 2004;182:126–137. doi: 10.1007/s00203-004-0675-3. [DOI] [PubMed] [Google Scholar]
- 41.Vicente JB, Testa F, Mastronicola D, Forte E, Sarti P, Teixeira M, Giuffre A. Arch Biochem Biophys. 2009;488:9–13. doi: 10.1016/j.abb.2009.06.011. [DOI] [PubMed] [Google Scholar]
- 42.Collins HF, Biedendieck R, Leech HK, Gray M, Escalante-Semerena JC, McLean KJ, Munro AW, Rigby SEJ, Warren MJ, Lawrence AD. PLoS One. 2013;8:e55708. doi: 10.1371/journal.pone.0055708. [DOI] [PMC free article] [PubMed] [Google Scholar]
- 43.Vu VV, Emerson JP, Martinho M, Kim YS, Munck E, Park MH, Que L. Proc Natl Acad Sci. 2009;106:14814–14819. doi: 10.1073/pnas.0904553106. [DOI] [PMC free article] [PubMed] [Google Scholar]
- 44.Solomon EI, Brunold TC, Davis MI, Kemsley JN, Lee S-K, Lehnert N, Neese F, Skulan AJ, Yang Y-S, Zhou J. Chem Rev. 2000;100:235–349. doi: 10.1021/cr9900275. [DOI] [PubMed] [Google Scholar]
- 45.Makris TM, Vu VV, Meier KK, Komor AJ, Rivard BS, Munck E, Que L, Lipscomb JD. J Am Chem Soc. 2015;137:1608–1617. doi: 10.1021/ja511649n. [DOI] [PMC free article] [PubMed] [Google Scholar]
- 46.Krebs C, Bollinger JM, Booker SJ. Curr Opin Chem Biol. 2011;15:291–303. doi: 10.1016/j.cbpa.2011.02.019. [DOI] [PMC free article] [PubMed] [Google Scholar]
- 47.Banerjee R, Proshlyakov Y, Lipscomb JD, Proshlyakov DA. Nature. 2015 doi: 10.1038/nature14160. [DOI] [PMC free article] [PubMed] [Google Scholar]
- 48.Caranto JD, Weitz A, Giri N, Hendrich MP, Kurtz DM., Jr Biochemistry. 2014;53:5631–5637. doi: 10.1021/bi500836z. [DOI] [PMC free article] [PubMed] [Google Scholar]
- 49.Enemark JH, Feltham RD. Coord Chem Rev. 1974;13:339–406. [Google Scholar]
- 50.Hayashi T, Caranto JD, Matsumura H, Kurtz DM, Jr, Moënne-Loccoz PJ. J Am Chem Soc. 2012;134:6878–6884. doi: 10.1021/ja301812p. [DOI] [PMC free article] [PubMed] [Google Scholar]
- 51.Veith P, Paolini R, Dashper S, Reynolds E. J Dent Res. 2003;82:96. [Google Scholar]
- 52.Jiao Y, Hasegawa M, Inohara N. Trends Microbiol. 2014;22:157–163. doi: 10.1016/j.tim.2013.12.005. [DOI] [PMC free article] [PubMed] [Google Scholar]
- 53.Suzuki N, Yoneda M, Hirofuji T. Int J Dent. 2013;2013:587279. doi: 10.1155/2013/587279. [DOI] [PMC free article] [PubMed] [Google Scholar]
- 54.Boutrin MC, Wang C, Aruni W, Li X, Fletcher HM. J Bacteriol. 2012;194:1582–1592. doi: 10.1128/JB.06457-11. [DOI] [PMC free article] [PubMed] [Google Scholar]
- 55.Figueiredo MCO, Lobo SAL, Sousa SH, Pereira FP, Wall JD, Nobre LS, Saraiva LM. J Bacteriol. 2013;195:2684–2690. doi: 10.1128/JB.00074-13. [DOI] [PMC free article] [PubMed] [Google Scholar]
- 56.Flatley J, Barrett J, Pullan ST, Hughes MN, Green J, Poole RK. J Biol Chem. 2005;280:10065–10072. doi: 10.1074/jbc.M410393200. [DOI] [PubMed] [Google Scholar]
- 57.Pullan ST, Gidley MD, Jones RA, Barrett J, Stevanin TA, Read RC, Green J, Poole RK. J Bacteriol. 2007;189:1845–1855. doi: 10.1128/JB.01354-06. [DOI] [PMC free article] [PubMed] [Google Scholar]
- 58.Baptista JM, Justino MC, Melo AM, Teixeira M, Saraiva LM. J Bacteriol. 2012;194:3611–3617. doi: 10.1128/JB.00140-12. [DOI] [PMC free article] [PubMed] [Google Scholar]
- 59.Kolenbrander PE, Palmer RJ, Rickard AH, Jakubovics NS, Chalmers NI, Diaz PI. Periodontol. 2006;2000(42):47–79. doi: 10.1111/j.1600-0757.2006.00187.x. [DOI] [PubMed] [Google Scholar]
- 60.Kuramitsu HK, He X, Lux R, Anderson MH, Shi W. Microbiol Mol Biol Rev. 2007;71:653–670. doi: 10.1128/MMBR.00024-07. [DOI] [PMC free article] [PubMed] [Google Scholar]
- 61.Tan KH, Seers CA, Dashper SG, Mitchell HL, Pyke JS, Meuric V, Slakeski N, Cleal SM, Chambers JL, McConville MJ, Reynolds EC. PLoS Pathog. 2014;10:e1003955. doi: 10.1371/journal.ppat.1003955. [DOI] [PMC free article] [PubMed] [Google Scholar]
- 62.Goncalves VL, Vicente JB, Pinto L, Romao CV, Frazao C, Sarti P, Giuffre A, Teixeira M. J Biol Chem. 2014;289:28260–28270. doi: 10.1074/jbc.M114.579086. [DOI] [PMC free article] [PubMed] [Google Scholar]
- 63.Wildschut JD, Lang RM, Voordouw JK, Voordouw G. J Bacteriol. 2006;188:6253–6260. doi: 10.1128/JB.00425-06. [DOI] [PMC free article] [PubMed] [Google Scholar]
- 64.Silaghi-Dumitrescu R, Kurtz DM, Jr, Ljungdahl LG, Lanzilotta WN. Biochemistry. 2005;44:6492–6501. doi: 10.1021/bi0473049. [DOI] [PubMed] [Google Scholar]
- 65.Frazão C, Silva G, Gomes CM, Matias P, Coelho R, Sieker L, Macedo S, Liu MY, Oliveira S, Teixeira M, Xavier AV, Rodrigues-Pousada C, Carrondo MA, Le Gall J. Nature Struct Biol. 2000;7:1041–1045. doi: 10.1038/80961. [DOI] [PubMed] [Google Scholar]
- 66.Kurtz DM, Jr, Boice E, Caranto JD, Frederick RE, Masitas CA, Miner KD. In: Encyclopedia of inorganic and bioinorganic chemistry. Scott RA, editor. Wiley; Chichester: 2013. pp. 1–18. [Google Scholar]
Associated Data
This section collects any data citations, data availability statements, or supplementary materials included in this article.


