eLife logoLink to eLife
. 2016 Feb 17;5:e11324. doi: 10.7554/eLife.11324

MiRNA-128 regulates the proliferation and neurogenesis of neural precursors by targeting PCM1 in the developing cortex

Wei Zhang 1,, Paul Jong Kim 2,, Zhongcan Chen 1, Hidayat Lokman 2, Lifeng Qiu 1, Ke Zhang 1, Steven George Rozen 3, Eng King Tan 4,5, Hyunsoo Shawn Je 2,5,6,*, Li Zeng 1,5,*
Editor: Eunjoon Kim7
PMCID: PMC4769165  PMID: 26883496

Abstract

During the development, tight regulation of the expansion of neural progenitor cells (NPCs) and their differentiation into neurons is crucial for normal cortical formation and function. In this study, we demonstrate that microRNA (miR)-128 regulates the proliferation and differentiation of NPCs by repressing pericentriolar material 1 (PCM1). Specifically, overexpression of miR-128 reduced NPC proliferation but promoted NPC differentiation into neurons both in vivo and in vitro. In contrast, the reduction of endogenous miR-128 elicited the opposite effects. Overexpression of miR-128 suppressed the translation of PCM1, and knockdown of endogenous PCM1 phenocopied the observed effects of miR-128 overexpression. Furthermore, concomitant overexpression of PCM1 and miR-128 in NPCs rescued the phenotype associated with miR-128 overexpression, enhancing neurogenesis but inhibiting proliferation, both in vitro and in utero. Taken together, these results demonstrate a novel mechanism by which miR-128 regulates the proliferation and differentiation of NPCs in the developing neocortex.

DOI: http://dx.doi.org/10.7554/eLife.11324.001

Research Organism: Mouse

eLife digest

The neurons that transmit information around the brain develop from cells called neural progenitor cells. These cells can either divide to form more progenitor cells or to become specific types of neurons. If these carefully regulated processes go wrong – for example, if progenitors fail to stop dividing in order to mature – a range of neurodevelopmental conditions may develop, including autism spectrum disorders.

Small RNA molecules called microRNAs control gene activity and protein formation by targeting certain other RNA molecules for destruction. One such microRNA, called miR-128, helps newly formed neurons to move to the correct region of the cortex – the outer layer of the brain, which is essential for many cognitive processes including thought and language. However, it was not clear whether miR-128 plays any other roles in the development of neurons.

Zhang, Kim et al. have now analysed the role of miR-128 in the developing cortex of mice. The findings suggest that miR-128 prevents cortical neural progenitor cells from dividing and supports their development into more specialized cells. Causing miR-128 to be over-produced in the progenitor cells caused the cells to divide less often and encouraged them to mature into neurons. Conversely, removing miR-128 from the progenitor cells caused them to divide more and resulted in fewer neurons forming.

Further investigation revealed that miR-128 works by causing less of a protein called PCM1 to be produced. Without this protein, cells cannot divide properly. Future studies could now investigate in more detail how miR-128 and PCM1 affect how the neurons in the cortex develop and work.

DOI: http://dx.doi.org/10.7554/eLife.11324.002

Introduction

Neurogenesis, the process by which functionally integrated neurons are generated from neural progenitor cells (NPCs), involves the proliferation and neuronal fate specification of NPCs and the subsequent maturation and functional integration of the neuronal progeny into neuronal circuits (Gupta et al., 2002). Given its importance in the development of the nervous system, neurogenesis is tightly regulated at many levels by both extrinsic and intrinsic factors (Heng et al., 2010), and its disruption has been associated with various pathologies, including autism spectrum disorders (ASDs), Treacher Collins syndrome, and various neural tube defects (Sun and Hevner, 2014). Therefore, uncovering the molecular mechanisms that underlie neurogenesis is crucial to understand the functions and plasticity of brain development and to prevent such pathologies (Sun and Hevner, 2014).

MicroRNAs (miRNAs) are small noncoding RNA molecules that function in the transcriptional and post-transcriptional regulation of gene expression in a variety of organisms (Kawahara et al., 2012). Encoded by eukaryotic nuclear DNA, miRNAs function through imperfect base-pairing with complementary sequences in target mRNA molecules, typically triggering their targeted degradation or translational repression by the RNA-induced silencing complex RISC (Bartel, 2009; Shi et al., 2010). The role of miRNAs in neuronal development and function has recently received increased attention, and the specific spatiotemporal expression of these molecules may be essential for brain morphogenesis and neurogenesis (Volvert et al., 2012; Zhang et al., 2014). However, the specific miRNAs that regulate the proliferation and differentiation of NPCs during early cortical development are not well established.

In this study, we demonstrate that miR-128, which has previously been shown to play a crucial role in cortical migration (Franzoni et al., 2015), inhibits self-renewal and promotes neuronal differentiation in mouse NPCs by targeting pericentriolar material 1 (PCM1), a critical protein for cell division, during early cortical development (Ge et al., 2010). Specifically, ectopic overexpression of miR-128 reduces the proliferation of NPCs but promotes the differentiation of NPCs into neurons both in vivo and in vitro. Conversely, knockdown of miR-128 enhances proliferation but inhibits neuronal differentiation. Knockdown of endogenous PCM1 mimics the cellular phenotype of miR-128-overexpressing NPCs. Furthermore, the concomitant overexpression of both PCM1 and miR-128 in NPCs rescues the cellular phenotype associated with the overexpression of miR-128 in NPCs, indicating that PCM1 lies downstream of miR-128 and regulates the proliferation and neural fate specification of NPCs in vitro and in utero.

Taken together, our data indicate that miR-128 is an important regulator of neurogenesis in the embryonic cortex and suggest that aberrant miR-128 expression may account for the abnormal cortical development that underlies the pathophysiology of certain neuropsychiatric disorders, including autism.

Results

miR-128 is expressed in NPCs in the developing murine cortex

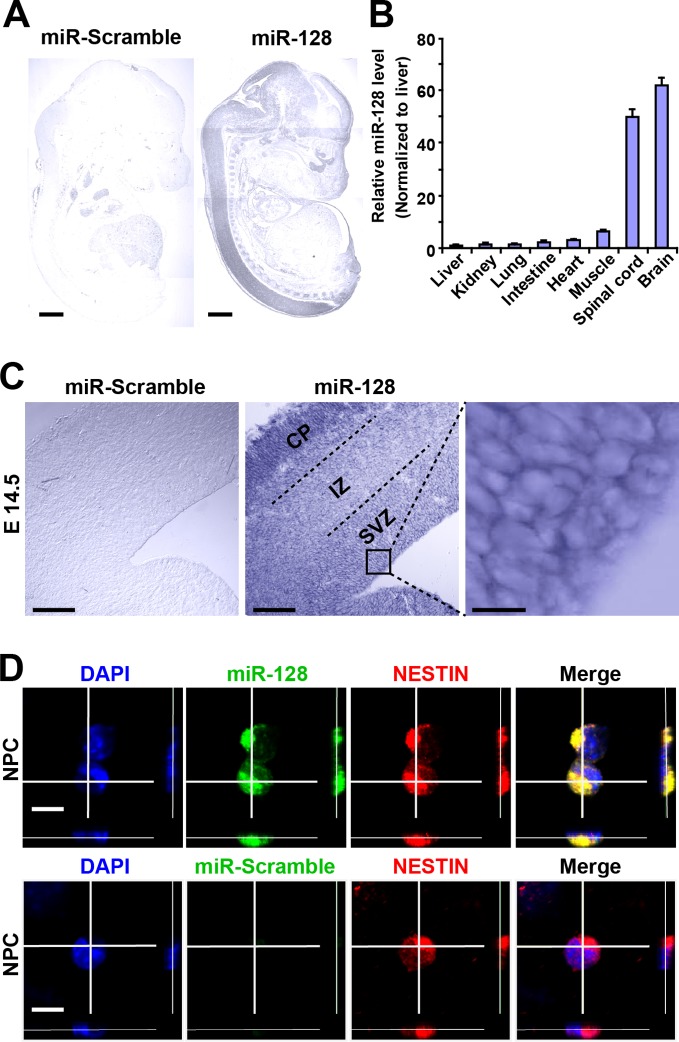
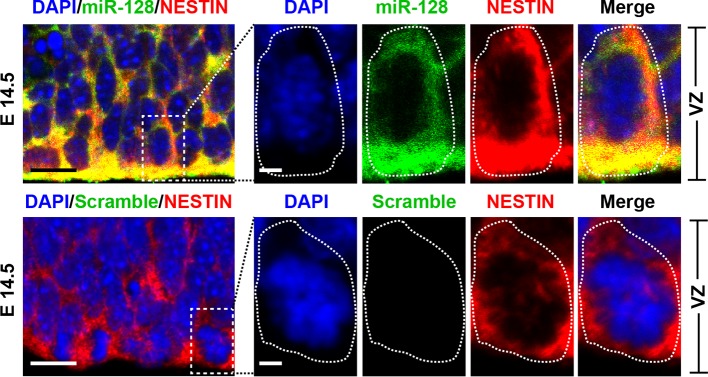
To determine the spatial distribution of miR-128 in the developing embryonic cortex, we performed in situ hybridization (ISH) using digoxigenin (DIG)-labeled locked nucleic acid (LNA) detection probes targeted to the mature form of miR-128 (Figure 1A). As previously reported (Tan et al., 2013), miR-128 was found to be predominantly expressed in the brains and spinal cords of E14.5 mice, and no signal was detected with a scrambled miRNA probe (Figure 1A). As an alternative method, we performed quantitative real-time PCR (qPCR) and found spatial expression patterns of miR-128 that were similar to those observed using ISH (Figure 1B). Within the E14.5 forebrain, miR-128 was clearly detectable in the cortical layers, and high-magnification images of cortical slices at E14.5 revealed the expression of miR-128 in cells within the ventricular/subventricular zone (VZ/SVZ) (Figure 1C). To further confirm this, we performed fluorescence ISH in combination with immunostaining using the NPC marker NESTIN in cortical slices at E14.5 and found that NPCs within the VZ/SVZ expressed miR-128 (Figure 1—figure supplement 1). Furthermore, NPCs isolated from the E14.5 forebrain co-expressed miR-128 and NESTIN (Figure 1D), indicating the potential functional role of miR-128 in regulating the proliferation and/or differentiation of NPCs.

Figure 1. miR-128 expression in the developing cerebral cortex.

(A) ISH was performed in an E17.5 mouse embryo with a miR-128 LNA detection probe. A sagittal section shows that miR-128 is expressed in the CNS. The left-side section was probed with a miR scramble control. Scale bars, 1 mm. (B) Real-time qPCR analyses of miR-128 from various tissues at E17.5, showing that miR-128 is highly expressed in the brain and spinal cord. miR-128 expression was measured and normalized to that of U6 and is shown relative to the liver expression level. The values represent the mean ± s.d. (n = 3). (C) miR-128 expression in the cortex. ISH was performed in an E14.5 mouse embryo brain coronal section with a miR-128 LNA detection probe. The left-side section was probed with a miR scramble control. Scale bars, 50 µm, and 5 µm in the higher magnification image (right-most panel). (D) miR-128 expression in NPCs in vitro. miR-128 LNA in situ hybridization followed by immunofluorescence analysis of the neural stem cell marker NESTIN in NPCs. DAPI staining indicates the location of cell nuclei. Scale bars, 10 µm.

DOI: http://dx.doi.org/10.7554/eLife.11324.003

Figure 1.

Figure 1—figure supplement 1. miR-128 expression in the developing CNS.

Figure 1—figure supplement 1.

miR-128 expression in the NPCs of the VZ at E14.5. miR-128 LNA in situ hybridization followed by immunofluorescence analysis of the neural stem cell marker NESTIN on E14.5 mouse embryo brain coronal sections. The micrographs in the bottom panels show slices probed with a miR scramble control. White dotted line outlines a single cell within the VZ. DAPI staining indicates the location of cell nuclei. Scale bars, 5 µm in left-most panel, 2 µm in all other panels.

miR-128 regulates the proliferation and differentiation of NPCs in vitro

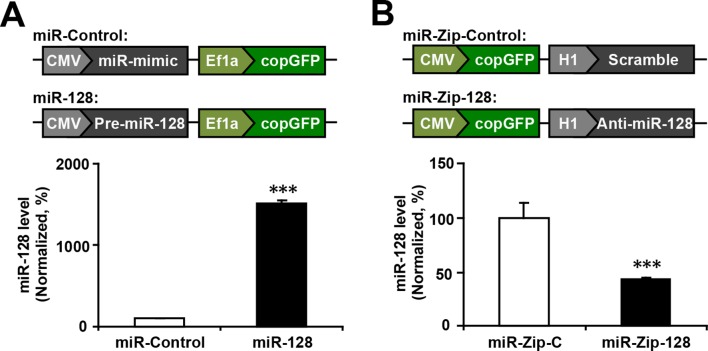
To examine whether miR-128 regulates the proliferation and/or differentiation of embryonic NPCs, we designed constructs for gain-of-function and loss-of-function studies. A dual-promoter expression construct carrying CMV-driven mouse miR-128-1 precursor and EF1α-driven copGFP (Hollis et al., 2009) (miR-128) was used to overexpress miR-128, while a dual-promoter expression construct containing H1-driven anti-sense miR-128 short-hairpin RNA and CMV-driven copGFP (miR-Zip-128) (Guibinga et al., 2012) was used to knock down endogenous miR-128 (Figure 2—figure supplement 1A and B). When we transfected primary embryonic NPCs that were isolated from E14.5 mouse forebrains with these constructs, the miR-128-1 precursor was efficiently processed to generate the mature miRNA, as shown by a 15-fold upregulation of miR-128 in transfected cells (Figure 2—figure supplement 1A). In addition, miR-Zip-128 transfection resulted in efficient knockdown of endogenous miR-128 (Figure 2—figure supplement 1B).

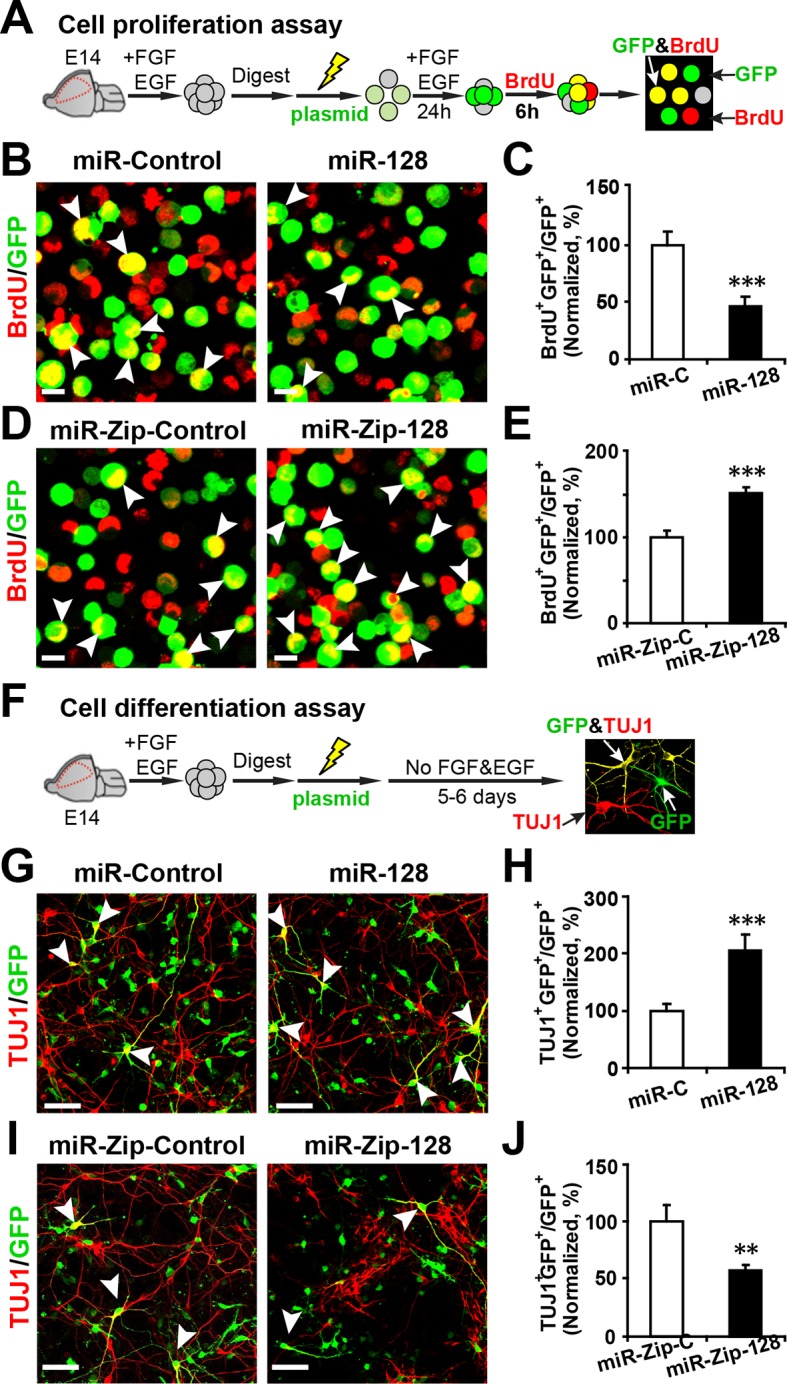
NPCs that were isolated from E14.5 mouse forebrains were electroporated with the aforementioned constructs and were pulse-labeled with 5-bromo-2’-deoxyuridine (BrdU) for 6 hr to label dividing cells of a heterogeneous group of NPCs from all phases of the cell cycle (Bez et al., 2003; Zhang et al., 2014) (Figure 2A). Overexpression of miR-128 inhibited NPC proliferation, as indicated by a 56% reduction in BrdU incorporation in transfected cells (arrowheads) compared with the incorporation in those transfected with the miRNA mimic control (Figure 2B and C). Conversely, miR-128 knockdown led to a 50% increase in the number of GFP-BrdU double-positive cells compared to the scramble control (Figure 2D and E).

Figure 2. miR-128 modulates the proliferation and differentiation of NPCs in vitro.

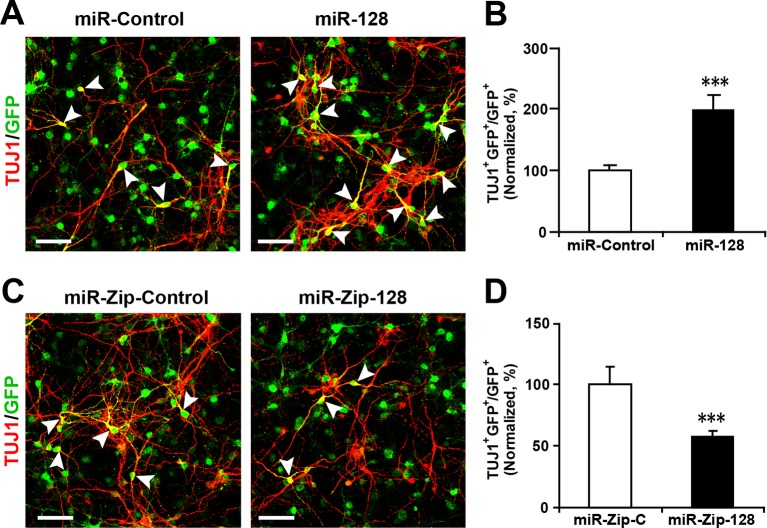
(A) Schematic representation of the cell proliferation assay procedures. (B-E) Ectopic expression of miR-128 decreases proliferation, while that of miR-Zip-128 increases NPC proliferation. NPCs were electroporated with the indicated plasmids and pulse-labeled with BrdU for 6 hr. NPCs were immunostained with an antibody against BrdU. The arrowheads indicate BrdU and GFP double-positive cells. Scale bars, 10 µm. Quantification of the number of GFP-BrdU double-positive cells relative to the total number of GFP-positive cells (C, E). (F) Schematic representation of the cell differentiation assay procedures. (G-J) Ectopic expression of miR-128 increases neurogenesis, while that of miR-Zip-128 decreases the neurogenesis of NPCs. NPCs were electroporated with the indicated plasmids and immunostained with antibodies against TUJ1. The arrowheads indicate TUJ1+GFP+ cells. Scale bars, 50 µm. Quantification of the number of the GFP-TUJ1 double-positive cells relative to the number of GFP-positive cells (H, J). More than 1500 GFP-positive cells were counted for each condition. At least three sets of independent experiments were performed. The values represent the mean ± s.d. (n = 3). Student’s t-test, differences were considered significant at ***p<0.001 and **p<0.01.
DOI: http://dx.doi.org/10.7554/eLife.11324.005

Figure 2.

Figure 2—figure supplement 1. miR-128 overexpression and miR-128 knockdown constructs and their expression efficiency.

Figure 2—figure supplement 1.

(A) Premature miR-128-1 (pre-miR-128) was cloned into a dual expression construct. The corresponding control construct contained a random miR mimic sequence. (B) qPCR quantification of miR-128 levels in NPCs following transfection with the miR-128 constructs. (C) A shRNA sequence targeting mature miR-128 (anti-miR-128) was cloned into a dual expression construct. The corresponding control construct contained a scrambled shRNA sequence. (D) qPCR quantification of miR-128 levels in NPCs following transfection with the miR-Zip-128 constructs. The values represent the mean ± s.d. (n = 3). Student’s t-test, differences were considered significant at ***p<0.001.
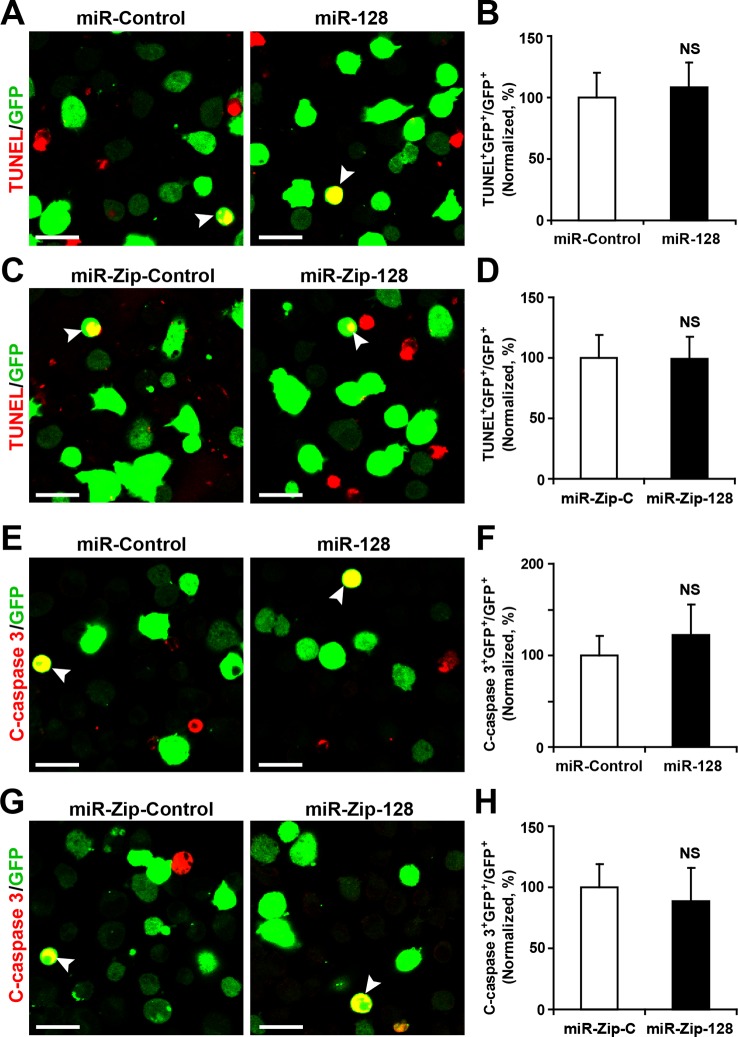
Figure 2—figure supplement 2. miR-128 overexpression and knockdown does not affect NPC apoptosis.

Figure 2—figure supplement 2.

(A-D) Ectopic expression of miR-128 and miR-Zip-128 does not affect TUNEL staining. Quantification of the number of GFP-TUNEL double-positive cells relative to the total number of GFP-positive cells (B, D). (E-H) Ectopic expression of miR-128 and miR-Zip-128 does not affect cleaved caspase-3 (C-caspase 3) staining. Scale bars, 20 μm. Quantification of the number of GFP-C-caspase 3 double-positive cells relative to the total number of GFP-positive cells (B, D). More than 1500 GFP-positive cells were counted for each condition. At least three sets of independent experiments were performed. The values represent the mean ± s.d. (n = 3). Student’s t-test, differences were considered significant at *p<0.05.
Figure 2—figure supplement 3. Ectopic expression of miR-128 increases neurogenesis, while that of miR-Zip-128 decreases neurogenesis.

Figure 2—figure supplement 3.

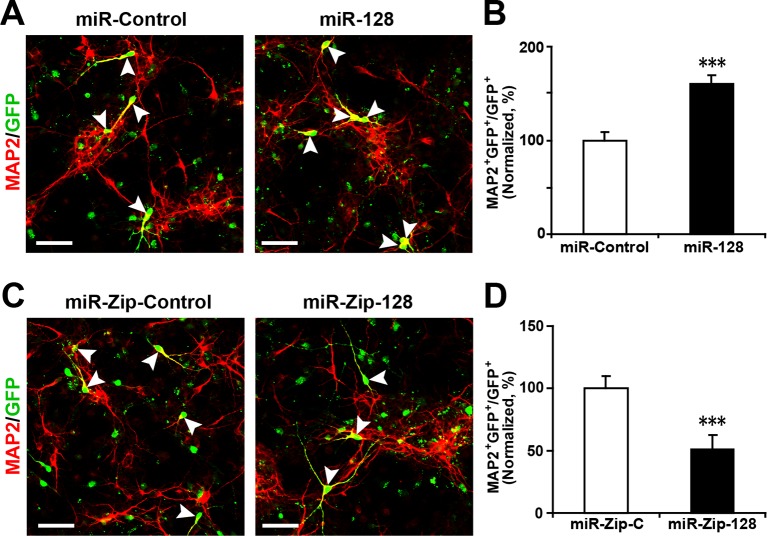
(A-D) NPCs were electroporated with the indicated plasmids and immunostained with antibodies against MAP2. The arrowheads indicate MAP2+GFP+ cells. Scale bars, 50 µm. Quantification of the number of GFP-MAP2 double-positive cells relative to the number of GFP-positive cells (B, D). More than 1500 GFP-positive cells were counted for each condition. At least three sets of independent experiments were performed. The values represent the mean ± s.d. (n = 3). Student’s t-test, differences were considered significant at ***p<0.001.
Figure 2—figure supplement 4. Lentivirus-mediated transduction of miR-128 and miR-Zip-128 increases and decreases neurogenesis, respectively.

Figure 2—figure supplement 4.

(A-D) NPCs were transduced with lentiviruses carrying the indicated plasmids and immunostained with antibodies against TUJ1. The arrowheads indicate TUJ1+GFP+ cells. Scale bars, 50 µm. Quantification of the number of GFP-TUJ1 double-positive cells relative to the number of GFP-positive cells (B, D). More than 1500 GFP-positive cells were counted for each condition. At least three sets of independent experiments were performed. The values represent the mean ± s.d. (n = 3). Student’s t-test, differences were considered significant at ***p<0.001.
Figure 2—figure supplement 5. Ectopic expression of miR-128 decreases gliogenesis, while that of miR-Zip-128 increases gliogenesis.

Figure 2—figure supplement 5.

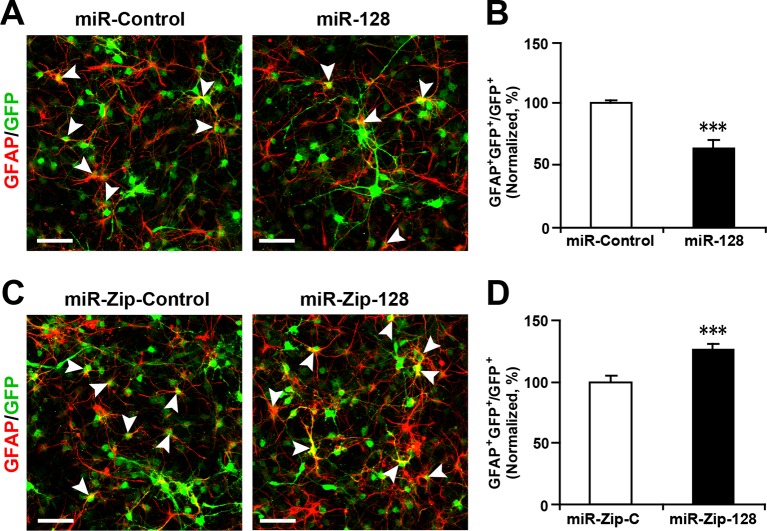
(A-D) NPCs were transduced with lentiviruses carrying the indicated plasmids and immunostained with antibodies against GFAP. The arrowheads indicate GFAP+GFP+ cells. Scale bars, 50 µm. Quantification of the number of GFP-GFAP double-positive cells relative to the number of GFP-positive cells (B, D). More than 1500 GFP-positive cells were counted for each condition. At least three sets of independent experiments were performed. The values represent the mean ± s.d. (n = 3). Student’s t-test, differences were considered significant at ***p<0.001.
Figure 2—figure supplement 6. Optimizing the duration of BrdU pulse labeling for in vitro NPC proliferation assay.

Figure 2—figure supplement 6.

(A) NPCs were pulsed with BrdU for the indicated duration before fixation. Quantification of BrdU-positive cells over total DAPI-positive cells. (B) Following electroporation with either miR-128-ZIP or the control constructs NPCs were pulsed with BrdU for the indicated duration. Quantification of BrdU- GFP-double-positive cells over GFP-positive cells shows that after 4 hr of BrdU exposure, NPCs electroporated with miR-128-ZIP show significantly increased BrdU incorporation compared to control. At least 1500 cells were counted for each condition. The values represent the means ± s.d. (n = 3). Student’s t-test, differences were considered significant at ***p<0.001, **p<0.01.

To determine whether modulating the levels of miR-128 affected cell death, we performed a TUNEL assay (Cai et al., 2000) (Figure 2—figure supplement 2A–D) and antibody staining against cleaved caspase-3 (Chen and Dong, 2009) (Figure 2—figure supplement 2E–H). These results showed that upregulation or downregulation of the miR-128 level specifically affected cell proliferation without affecting apoptosis.

Next, to determine the fate of the NPCs following cell-cycle exit, NPCs were transfected with the aforementioned constructs and were subsequently induced to differentiate in vitro by withdrawing growth factors from the culture medium for 5–6 days (Ma et al., 2008; Zhang et al., 2014) (Figure 2F). Neuronal differentiation was assayed by immunostaining with TUJ1, a specific antibody against beta-III-tubulin (Ferreira and Caceres, 1992). An increase in the number of GFP and TUJ1 double-positive cells upon treatment would indicate increased neuronal differentiation, whereas a decrease would indicate the inhibition of neurogenesis. Intriguingly, miR-128 overexpression increased the neuronal differentiation of NPCs, as shown by a significant increase (of approximately 100%) in the number of GFP and TUJ1 double-positive cells (Figure 2G and H). In contrast, miR-128 knockdown resulted in a 40% decrease of GFP-TUJ1 double-positive cells compared with treatment with the scrambled control miRNA (Figure 2I and J). When we assayed neuronal differentiation using immunostaining with the marker of mature neurons MAP2, we observed a similar effect on neuronal differentiation (Figure 2—figure supplement 3A–D). Moreover, lentiviral transduction of miR-128 or miR-Zip-128, as an alternative gene delivery approach, resulted in similar effects on neurogenesis (Figure 2—figure supplement 4A–D). Taken together, these results indicate that miR-128 overexpression enhances neuronal differentiation of NPCs following cell-cycle exit, while miR-128 knockdown shows the opposite effect on neuronal differentiation.

To further test whether the enhanced differentiation was restricted to a neuronal fate, we immunostained NPCs with a specific antibody against GFAP, a marker for glial cells, and observed that miR-128 overexpression significantly decreased the number of GFP and GFAP double-positive cells, indicating that NPCs that had exited the cell cycle following miR-128 overexpression may have over-committed to neuronal differentiation, preventing NPCs from becoming glial cells. The opposite effect was observed upon miR-128 knockdown in NPCs (Figure 2—figure supplement 5A–D).

To rule out the potential bias in the in vitro cell proliferation assay we monitored the time-course of BrdU incorporation using control NPCs (Figure 2—figure supplement 6A) as well NPCs electroporated with miR-ZIP-128. We found that the effects of miR-128 knockdown in NPCs (increased cell proliferation compared to control) remained unchanged at most of the time points (Figure 2—figure supplement 6B).

miR-128 promotes neuronal differentiation in the developing cortex in vivo

During development, NPCs in the VZ maintain proliferative capacity and the ability to self-renew (apical progenitors, APs). These APs give rise to intermediate progenitors (basal progenitors, BPs) within the SVZ and IZ that can proliferate and become neurons (Martinez-Cerdeno et al., 2006; Pontious et al., 2008). To examine the role of miR-128 during neocortical development in vivo, we introduced miR-128 and miR-Zip-128 into the lateral ventricular wall of E13.5 mouse brains by in utero electroporation and analyzed the electroporated brains at E14.5.

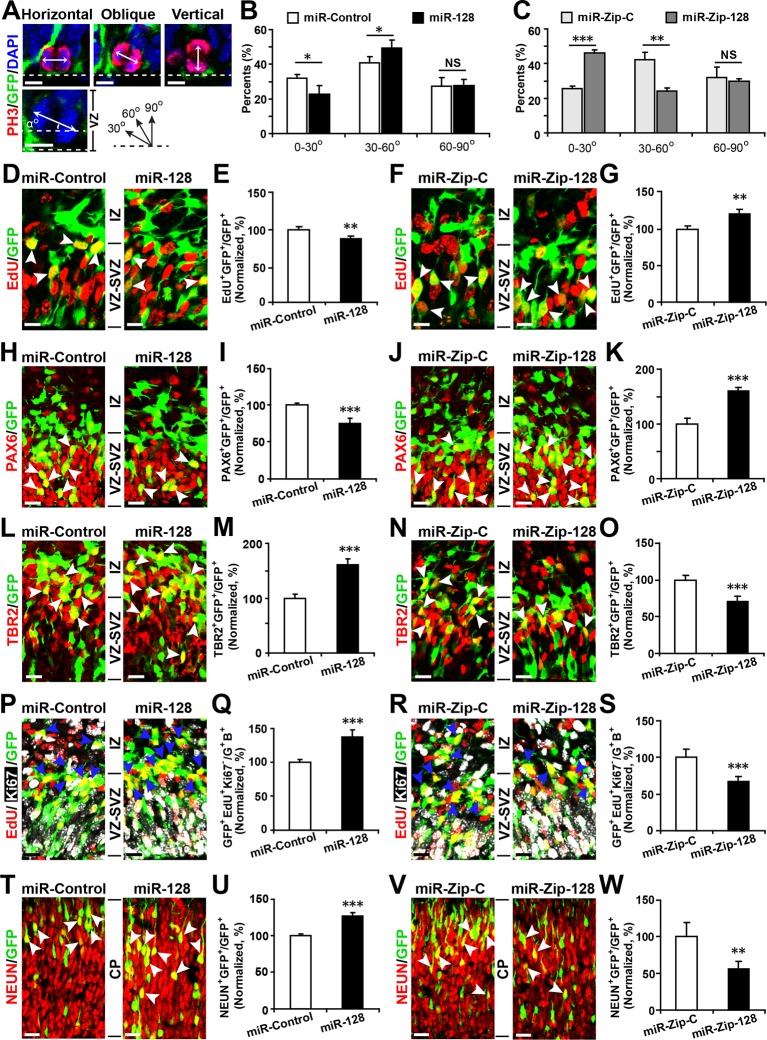
First, to detect changes in NPC proliferation, we monitored the mitotic spindle orientation (Huttner and Kosodo, 2005; Wang et al., 2011) of APs within the VZ that were undergoing mitosis using an antibody against phosphorylated histone H3 (PH3) (Postiglione et al., 2011), which labels dividing nuclei (Figure 3A). We found a significant decrease in the percentage of horizontal divisions upon miR-128 overexpression (Figure 3A and B, 10% ± SD), while miR-128 knockdown led to a significant increase in this percentage (Figure 3A and C, 20% ± SD). Based on these observations, we performed further experiments to identify the fate of AP progeny following miR-128 overexpression and miR-128 knockdown.

Figure 3. miR-128 regulates the proliferation and differentiation of NPCs in vivo.

(A-C) miR-128 regulates the symmetric division of apical progenitors in the VZ/SVZ. Mouse embryos were electroporated at E13.5 with the indicated plasmids and sacrificed at E14.5. The nuclei of mitotic cells were labeled using antibodies against PH3. The orientation of the mitotic spindle relative to the ventricular surface was determined and categorized into horizontal (0–30°), oblique (30–60°), or vertical (60–90°) as pictured. Scale bars, 5 µm. (A). Percentage of GFP and PH3 double-positive cells with the indicated mitotic spindle orientation following miR-128 overexpression (B) and miR-128 knockdown (C). (D-G) miR-128 regulates the proliferation of apical progenitors in the VZ/SVZ. Mouse embryos were electroporated at E13.5 with the indicated constructs. Twenty-four hours post-electroporation, dividing cells were marked by EdU pulse-labeling for 2 hr and sacrificed. The arrowheads indicate EdU+GFP+ cells. Scale bars, 10 µm. Quantification of the number of GFP-EdU double-positive cells relative to the number of GFP-positive cells (E, G). (H–K) Ectopic expression of miR-128 decreases apical progenitors, while that of miR-Zip-128 increases apical progenitors. Mouse embryos were electroporated at E13.5 with the indicated constructs and sacrificed at E14.5. Brain sections were immunostained with antibodies against PAX6. The arrowheads indicate PAX6+GFP+ cells. Scale bars, 10 µm. Quantification of the number of GFP-PAX6 double-positive cells relative to the number of GFP-positive cells (I, K). (L–O) Ectopic expression of miR-128 increases basal progenitors, while that of miR-Zip-128 decreases basal progenitors. Mouse embryos were electroporated at E13.5 with the indicated constructs and sacrificed at E14.5. Brain sections were immunostained with antibodies against TBR2. The arrowheads indicate TBR2+GFP+ cells. Scale bars, 10 µm. Quantification of the number of GFP-TBR2 double-positive cells relative to the number of GFP-positive cells (M, O). (P-S) miR-128 promotes cell cycle exit, and miR-Zip-128 inhibits cell cycle exit. Mouse embryos were electroporated at E13.5 with the indicated constructs. Twenty-four hours post-electroporation, dividing cells were marked by EdU pulse-labeling for 24 hr and sacrificed. The brain sections were immunostained with antibodies against Ki67. The blue arrowheads indicate GFP+EdU+Ki67- cells that had exited the cell cycle. Scale bars, 10 µm. Quantification of the number of GFP-EdU double-positive, Ki67-negative cells relative to the number of GFP-BrdU double-positive cells (Q, S). (T-W) miR-128 promotes the differentiation of NPCs in vivo. Mouse embryos were electroporated at E13.5 with the indicated constructs and sacrificed at E17.5. Brain slices were immunostained for NEUN. Arrowheads indicate NEUN+GFP+ cells. Scale bars, 10 µm. Quantification of the number of GFP-NEUN double-positive cells relative to the number of GFP-positive cells (U, W). More than 1500 GFP-positive cells were counted for each condition. At least three sets of independent experiments were performed. The values represent the mean ± s.d. (n = 3). Student’s t-test, differences were considered significant at ***p<0.001, **p<0.01, and *p<0.05.

DOI: http://dx.doi.org/10.7554/eLife.11324.012

Figure 3.

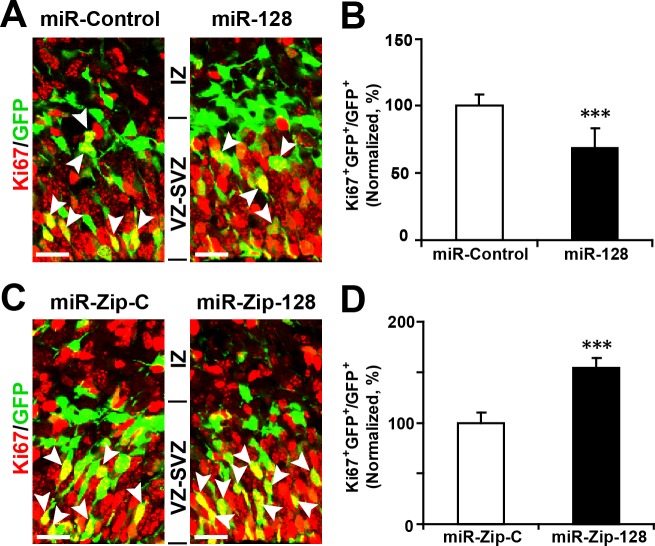
Figure 3—figure supplement 1. Ectopic expression of miR-128 decreases proliferation, while that of miR-Zip-128 increases proliferation in vivo.

Figure 3—figure supplement 1.

(A-D) Mouse embryos were electroporated at E13.5 with the indicated constructs and sacrificed at E14.5. Brain sections were immunostained with antibodies against Ki67. The arrowheads indicate Ki67+GFP+ cells. Scale bars, 10 µm. Quantification of the number of GFP-Ki67 double-positive cells relative to the number of GFP-positive cells (B, D). More than 1500 GFP-positive cells were counted for each condition. At least three sets of independent experiments were performed. The values represent the mean ± s.d. (n = 3). Student’s t-test, differences were considered significant at ***p<0.001.
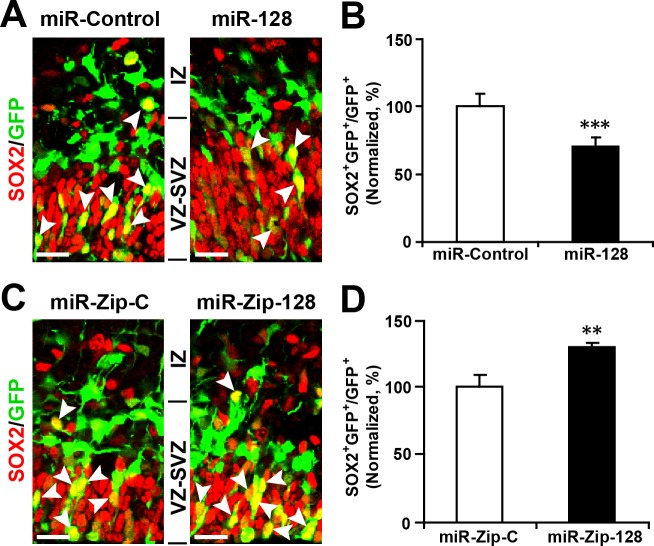
Figure 3—figure supplement 2. Ectopic expression of miR-128 decreases apical progenitors, while that of miR-Zip-128 increases apical progenitors.

Figure 3—figure supplement 2.

(A-D) Mouse embryos were electroporated at E13.5 with the indicated constructs and sacrificed at E14.5. Brain sections were immunostained with antibodies against SOX2. The arrowheads indicate SOX2+GFP+ cells. Scale bars, 10 µm. Quantification of the number of GFP-SOX2 double-positive cells relative to the number of GFP-positive cells (B, D). More than 1500 GFP-positive cells were counted for each condition. At least three sets of independent experiments were performed. The values represent the mean ± s.d. (n = 3). Student’s t-test, differences were considered significant at ***p<0.001 and **p<0.01.
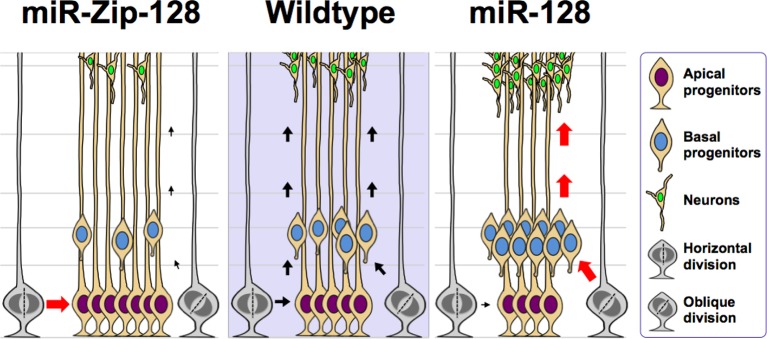
Figure 3—figure supplement 3. Model of the miR-128 in vivo phenotype.

Figure 3—figure supplement 3.

miR-128 overexpression in embryonic neural stem cells leads to two phenotypes that when combined together, ultimately results in amplified neurogenesis. First, an increase in the asymmetric cell division of apical progenitors occurs, which results in a relatively higher number of basal progenitors and a lower number of apical progenitors. Second, an increase in cell cycle exit occurs in the expanded basal progenitor pool, which leads to a greater number of neurons. miR-128 knockdown results in the opposite phenotypes, namely an increase in the symmetric cell division of apical progenitors, resulting in a relatively higher number of apical progenitors and a lower number of basal progenitors. In addition, the basal progenitors do not exit the cell cycle as readily, ultimately leading to a smaller number of neurons.

Furthermore, miR-128 overexpression led to a marked decrease in the percentage of cells that were positively labeled for the incorporation of 5-ethynyl-2'-deoxyuridine (EdU) (Ishino et al., 2014) (~12%) (Figure 3D and E), reduced cell division, as indicated by immunostaining with Ki67 (Figure 3—figure supplement 1A and B), and a marked decrease in the number of cells that were positive for the AP marker PAX6 (28% reduction in the number of VZ/SVZ cells that were positive for both GFP and PAX6) (Figure 3H and I) and SOX2 (Figure 3—figure supplement 2A and B). These data indicate that miR-128 overexpression decreased the number of proliferating APs within the VZ/SVZ. In contrast, miR-128 knockdown had the opposite effects on EdU incorporation and on Ki67, PAX6 and SOX2 immunostaining in APs (Figure 3F,G,J and K) (Figure 3—figure supplement 1C and D, 2C and D).

Next, given that we observed increased numbers of obliquely dividing cells upon miR-128 overexpression (Figure 3A and B), indicating potential expansion of BPs (Huttner and Kosodo, 2005; Wang et al., 2011), we monitored TBR2 expression upon miR-128 overexpression. MiR-128 overexpression led to an increase in the number of TBR2-positive cells (60% increase in GFP-TBR2 double-positive cells) (Figure 3L and M), while miR-128 knockdown resulted in a decrease in the number of TBR2-positive cells (30% decrease in GFP-TBR2 double-positive cells) (Figure 3N and O). Taken together, these data indicate that miR-128 regulates NPC proliferation by promoting intermediate basal progenitors at the expense of apical progenitors within the VZ/SVZ.

Because BPs will generate the bulk of cortical neurons (Tan and Shi, 2013), we tested whether miR-128 regulates the neuronal differentiation of NPCs in vivo. First, we analyzed the number of BPs that exited the cell cycle (Ge et al., 2010; Yang et al., 2012) upon miR-128 manipulation. Following in utero electroporation, dividing cells were labeled with EdU for 24 hr and subsequently immunostained for Ki67. Compared to the control treatment, miR-128 overexpression increased the number of cells that were positive for both GFP and EdU but negative for Ki67 cells (by ~40%), indicating an increase the number of BPs that had exited the cell cycle (Figure 3P and Q). Conversely, miR-128 knockdown had the opposite effect (Figure 3R and S). To further examine whether the observed changes in cell cycle exit ultimately led to a difference in neurogenesis, we analyzed brains at E17.5, four days after electroporation, and assayed neuronal differentiation by immunostaining with a specific antibody against the neuronal marker NEUN (Zhang et al., 2014). miR-128 overexpression significantly increased (by ~25%) the number of NEUN-positive neurons in the CP zone compared with the number in the control condition (Figure 3T and U). Moreover, miR-128 knockdown had the opposite effect on neurogenesis (Figure 3V and W). Taken together, these results indicate that miR-128 may act on two different stages of NPC development: first, by regulating symmetric/asymmetric division of APs, miR-128 promotes BP production; and second, by enhancing the exit of BPs from the cell cycle, miR-128 promotes overall neurogenesis (Figure 3—figure supplement 3). In contrast, downregulation of miR-128 in early neuronal precursors impeded their developmental progression by causing them to be retained in a more primitive, proliferative stage, resulting in the expansion of a pool of the NPC pool. Intriguingly, this early expansion of NPC pools upon miR-128 knockdown did not result in a net increase in neuronal numbers at E17.5, suggesting that further investigation is necessary to delineate whether the observed phenomena is due to compromised neurogenic capability of NPCs or simply due to a delay in neurogenesis which could eventually be overcome at a later postnatal stage (Figure 3—figure supplement 3).

PCM1 is a direct target of miR-128 in NPCs

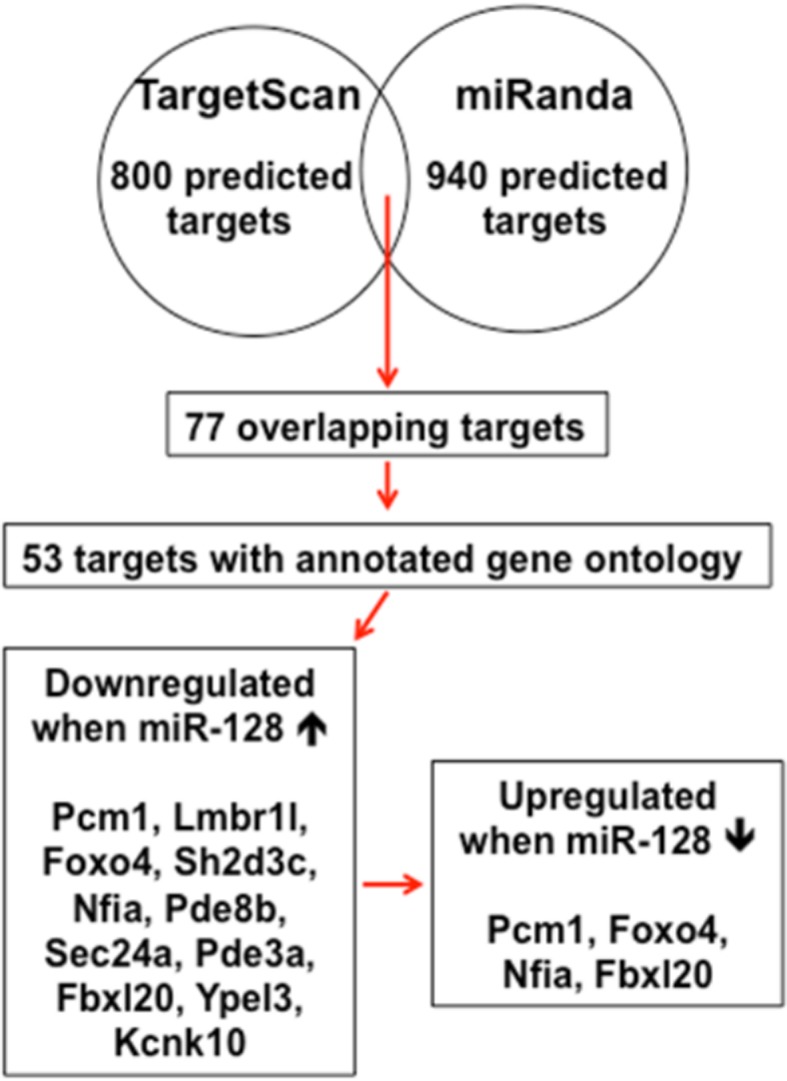
miRNAs normally regulate the translation and/or degradation of multiple target mRNAs (Bartel, 2009). To further characterize the molecular mechanisms that underlie the changes in NPC competence, we utilized two widely used in silico microRNA target prediction algorithms (TargetScan and miRanda) (Mi et al., 2013; Witkos et al., 2011), which identified 800 and 940 potential targets of miR-128, respectively (Figure 4—source data 1). Among the 77 overlapping targets identified using two algorithms, only 53 genes were annotated to have known biological processes and thus selected for further testing (Figure 4—source data 1). qPCR analysis of cultured NPCs that overexpressed miR-128 revealed 21 genes that were downregulated (Figure 4—source data 2). Eleven out of the 53 genes tested exhibited consistent reduction in mRNA levels upon miR-128 overexpression in cultured mouse NPCs (Pcm1, Lmbr1l, Foxo4, Sh2d3c, Nfia, Pde8b, Sec24a, Pde3a, Fbxl20, Ypel3 and Kcnk10, Figure 4—source data 2, highlighted in yellow). The 11 genes were further tested for reciprocal upregulation when miR-128 was inhibited. qPCR analysis following miR-128 inhibition showed that only Pcm1, Nfia, Foxo4, and Fbxl20 were consistently upregulated among which Pcm1 displayed the greatest change (Figure 4—source data 3).

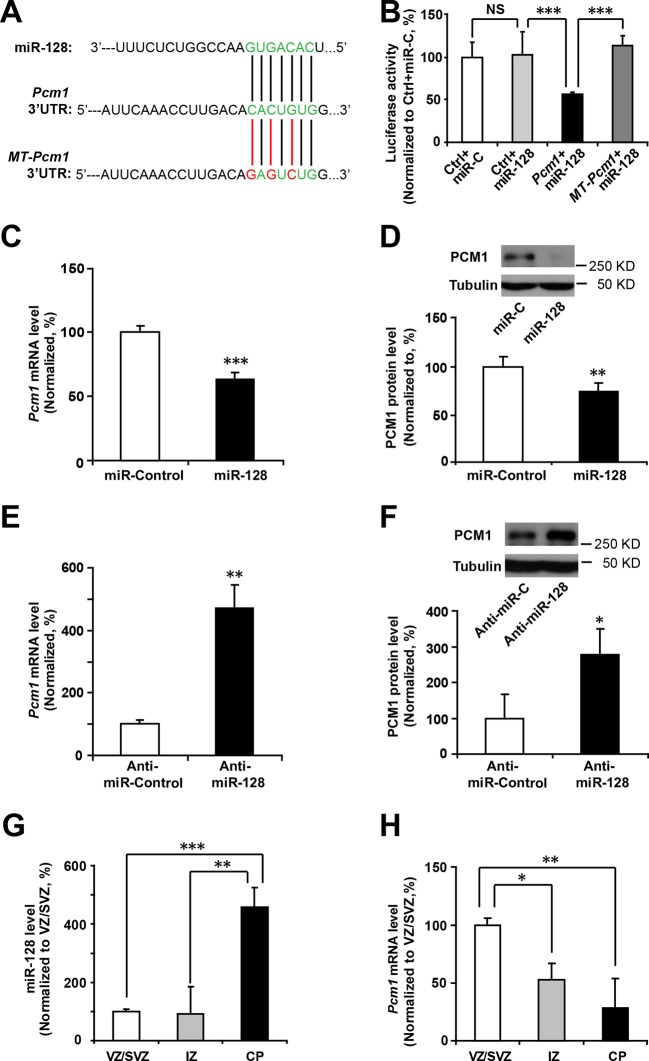
We further validated Pcm1 as a target of miR-128 using a luciferase assay. First, we cloned the 3’-UTR of Pcm1 (WT-Pcm1) into a dual-luciferase reporter construct, pmirGLO, to assess translation of the target protein based on the luciferase activity (Krishnan et al., 2013) (Figure 4A). In this assay, co-transfection of miR-128 with the WT-Pcm1 reporter construct markedly suppressed the luciferase activity (by 58%, Figure 4B). However, co-transfection of miR-128 with random 3’-UTR sequences (Control, Figure 4B) did not affect the luciferase activity. To further determine whether the targeting of PCM1 by miR-128 was specific, we introduced three mismatched nucleotides to the predicted seed region of the miR-128 binding site (MT-Pcm1) (Figure 4A, red underlines). Mutating these seed sequences abolished the miR-128-mediated suppression of PCM1 luciferase activity and restored the luciferase activity to the control level (Figure 4B), indicating the specificity of miR-128 targeting of the 3’-UTR of Pcm1.

Figure 4. miR-128 regulates PCM1 expression in NPCs.

(A) TargetScan analysis identified a miR-128 target site in the mouse Pcm1 3’-UTR region (highlighted in green). The mutant PCM1 is shown, with the seed binding sites highlighted in red. (B) PCM1 luciferase activity is suppressed by miR-128. HEK293T cells were co-transfected with miR-128 and the 3’-UTR of Pcm1 containing either the miRNA binding site (WT) or mutant (MT) versions of the Pcm1 seed binding sites for 2 days. The cells were harvested and lysed, and a luciferase activity assay was then performed. miR-128-mediated suppression of PCM1 luciferase activity was relieved upon mutation of the Pcm1 seed binding sites. (C,D) miR-128 overexpression in NPCs led to reduced endogenous Pcm1 mRNA levels, as determined by qPCR (C), and PCM1 protein expression, as demonstrated via densitometry analysis of western blots (D). (E,F) anti-miR-128 leads to increased endogenous Pcm1 mRNA levels, as demonstrated by qPCR (E), and protein expression of PCM1 (F). (G,H) LCM was used to isolate RNA from three specific cortical layers of E14.5 embryonic brains: the VZ/SVZ, IZ, and CP. qPCR quantification of miR-128 levels (G) and Pcm1 mRNA levels (H). At least three sets of independent experiments were performed. The values represent the mean ± s.d. (n = 3). Student’s t-test, differences were considered significant at ***p<0.001, **p<0.01, and *p<0.05 for all panels in the figure. ANOVA, differences were considered significant at ***p<0.001 and **p<0.01.

DOI: http://dx.doi.org/10.7554/eLife.11324.016

Figure 4—source data 1. Gene Ontology (GO) of the miR-128 target gene list.
53 genes with annotated GO terms which were predicted as targets of miR-128 by both TargetScan and miRanda algorithms, were listed. The genes were sorted in alphabetical order. GO information was obtained from the PANTHER website (http://www.pantherdb.org).
DOI: 10.7554/eLife.11324.017
Figure 4—source data 2. Relative expression of 53 predicted miR-128 targets upon overexpression of miR-128 in NPCs.
Cultured NPCs were transfected with either miR-128 or miR-mimic control for 48 hr and were harvested for qPCR analysis. 11 genes (Pcm1, Lmbr1l, Foxo4, Sh2d3c, Nfia, Pde8b, Sec24a, Pde3a, Fbxl20, Ypel3 and Kcnk10) showed consistent and significant reduction in mRNA levels upon miR-128 expression in NPCs (highlighted in yellow). At least three sets of independent experiments were performed. The values represent the mean ± s.d. (n = 3).
DOI: 10.7554/eLife.11324.018
Figure 4—source data 3. Relative expression of miR-128 targets upon downregulation of miR-128 in NPCs using miR-Zip-128.
NPC primary cultures were transfected with either miR-Zip-128 or miR-Zip scramble control, and mRNAs of 11 target genes were measured via qPCR analysis. Only PCM1 was significantly upregulated upon anti-miR-128 expression in NPCs. At least three sets of independent experiments were performed. The values represent the mean ± s.d. (n = 3).
DOI: 10.7554/eLife.11324.019
Figure 4—source data 4. List of qPCR primers.
DOI: 10.7554/eLife.11324.020

Figure 4.

Figure 4—figure supplement 1. Schematic diagram outlines rationale of gene selection process.
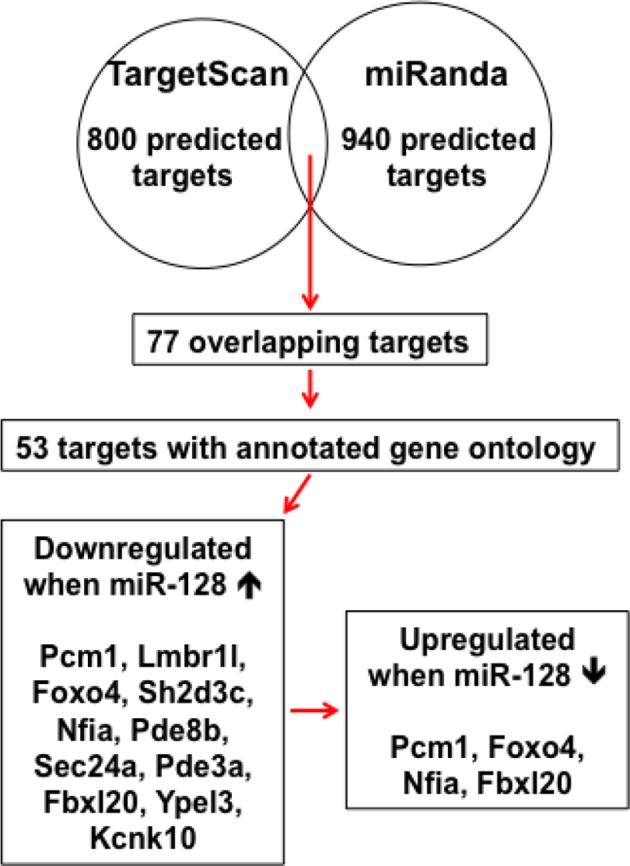
Figure 4—figure supplement 1.

Two widely used in silico microRNA target prediction databases (TargetScan and miRanda) predicted 800 and 940 potential targets of miR-128 respectively. Among the 77 overlapping targets only 53 were annotated to have known biological function and only 11 out of the 53 genes exhibited consistent reduction in mRNA levels upon miR-128 overexpression in cultured mouse NPCs and were further tested for reciprocal upregulation when miR-128 was inhibited. Lastly, upon miR-128 inhibition in NPCs, only Pcm1, Nfia, Foxo4, and Fbxl20 were consistently upregulated.
Figure 4—figure supplement 2. miR-128 inhibitor knockdown efficiency.
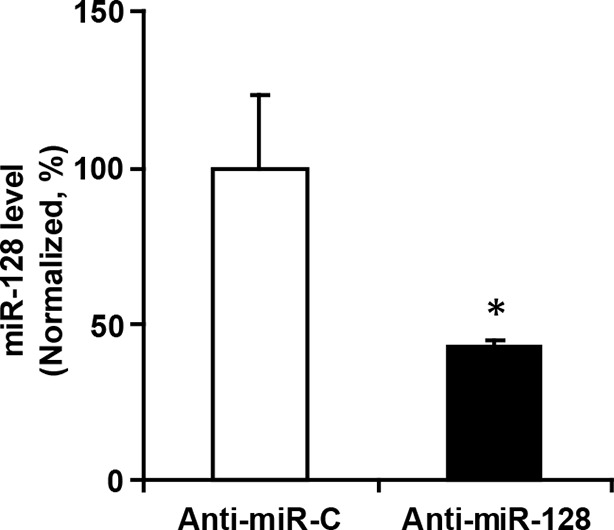
Figure 4—figure supplement 2.

qPCR quantification of miR-128 levels in NPCs following transfection with 2 µg miR-128 inhibitor (anti-miR-128) compared to the scramble control (anti-miR-control). The values represent the mean ± s.d. (n = 3). Student’s t-test, differences were considered significant at *p<0.05.
Figure 4—figure supplement 3. Inverse relationship between the temporal expression patterns of miR-128 and PCM1.
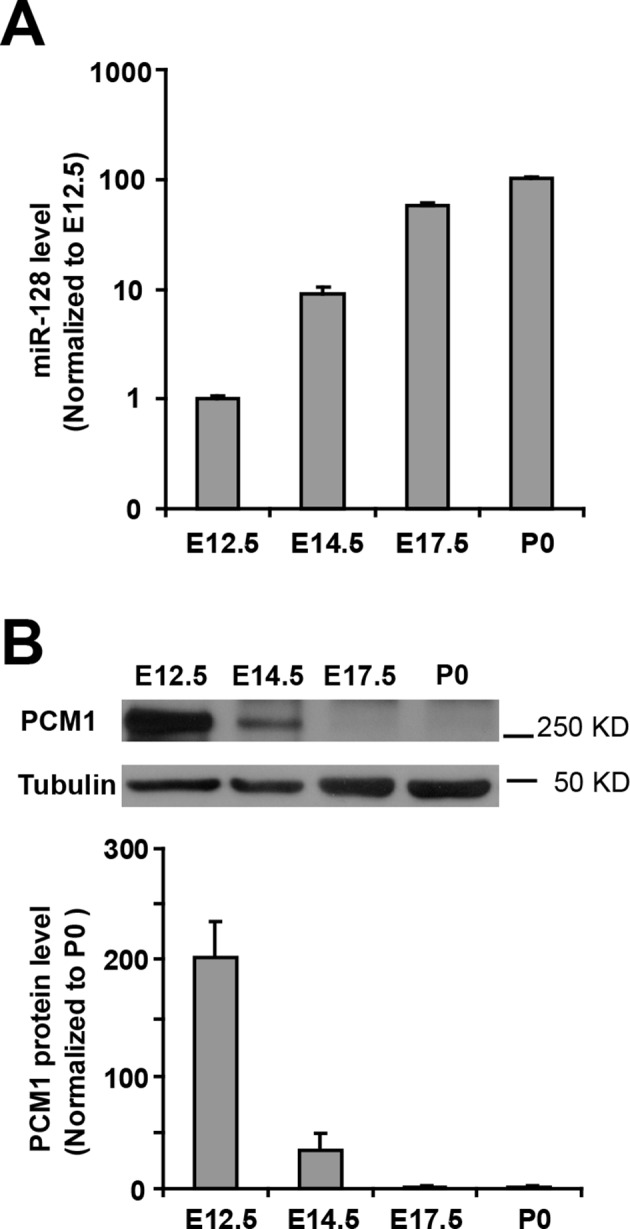
Figure 4—figure supplement 3.

(A) Real-time PCR analyses of miR-128 from brain tissues at various developmental stages. miR-128 expression was measured and normalized to that of U6 and is shown relative to the E12.5 expression level. The values represent the mean ± s.d. (n = 3). (B) Western blot of PCM1 expression in brain lysates prepared at various developmental stages with densitometry analysis. The values represent the mean ± s.d. (n = 3). Student’s t-test, differences were considered significant at *p<0.05.

Next, we examined whether miR-128 downregulated the endogenous expression of PCM1 at the mRNA and protein levels by overexpressing either miR-128 or a scrambled control in NPCs and then performing qPCR and western blot analyses using a specific antibody against PCM1. We observed that miR-128 overexpression significantly reduced PCM1 mRNA (Figure 4C) and protein levels (Figure 4D). Conversely, miR-128 knockdown using a specific inhibitor of miR-128 (anti-miR-128) (Smrt et al., 2010), in comparison to using a scrambled anti-miR (anti-miR-control) (Figure 4—figure supplement 2) in NPCs produced the opposite effect on the expression of PCM1 mRNA (Figure 4E) and protein (Figure 4F). Taken together, these data suggest that miR-128 targets PCM1 expression in NPCs, which in turn controls NPC proliferation and differentiation in vitro. In addition, qPCR analyses of tissue samples that were isolated from the VZ/SVZ, IZ, and CP using laser capture microdissection (LCM) (Wang et al., 2009) revealed an inverse relationship between miR-128 and PCM1 mRNA (Figure 4G and H). An inverse relationship between miR-128 and PCM1 mRNA levels was also evident temporally, given that the expression of miR-128 gradually increased starting from E12.5 through P0, whereas PCM1 protein expression was found to gradually decrease over this time period (Figure 4—figure supplement 3A–B), suggesting that miR-128 might regulate PCM1 levels to control NPC proliferation and differentiation in the developing cortex.

PCM1 regulates the proliferation and differentiation of NPCs

If the effect of miR-128 on the proliferation and differentiation of NPCs is mediated through the suppression of endogenous PCM1, then PCM1 downregulation should mimic the cellular effects of miR-128 overexpression. To test this hypothesis, we generated two small hairpin RNA (shRNA) vectors that expressed shRNAs that targeted mouse PCM1 and validated the efficiency of these shRNAs in knocking down PCM1 in mouse neuroblastoma (N2A) cells (Figure 5—figure supplement 1A). The expression of the shRNA vectors #1 and #2 led to a reduction in endogenous PCM1 of approximately 60 and 70%, respectively. Based on these data, we used shRNA #2 to examine the role of PCM1 in early neurogenesis.

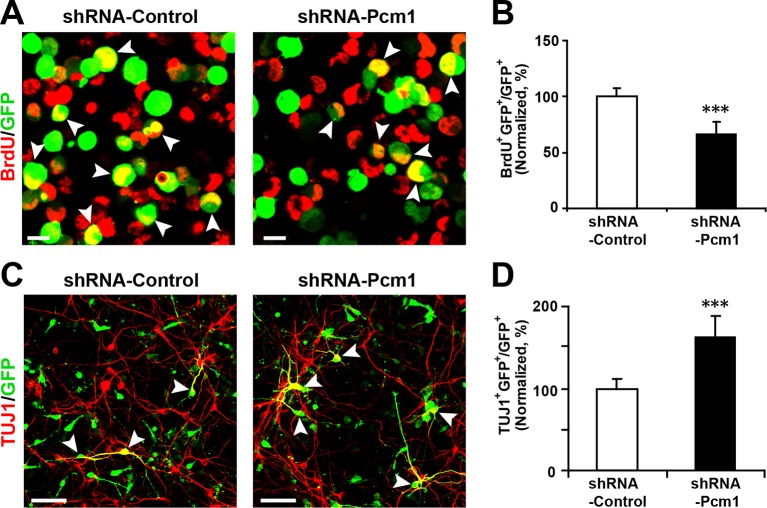
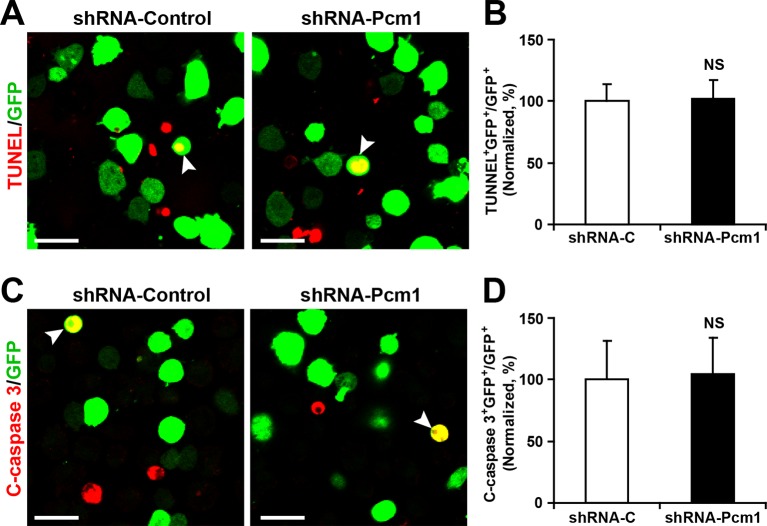
PCM1 has been shown to affect the proliferation and neurogenesis of NPCs; knockdown of PCM1 inhibits NPC proliferation but promotes NPC differentiation in the developing cortex (Ge et al., 2010). To further confirm the loss of PCM1 function in NPCs, we electroporated NPCs with PCM1 shRNA and assessed the proliferation of NPCs using BrdU pulse-labeling for 6 hr. The reduction of endogenous PCM1 via shRNA led to significant inhibition of NPC proliferation, as indicated by a 35% reduction in BrdU incorporation by transfected cells compared with the BrdU incorporation by NPCs that were transfected with a control scrambled shRNA (Figure 5A and 5B); this reduction was comparable to that caused by the overexpression of miR-128 in NPCs (Figure 2B and C). PCM1 knockdown did not affect cell survival, as indicated by TUNEL assay and antibody staining against activated caspase-3 (Figure 5—figure supplement 2A–D).

Figure 5. PCM1 knockdown decreases NPC neurogenesis.

(A,B) PCM1 knockdown in NPCs decreases neural proliferation. NPCs were electroporated with a plasmid expressing PCM1 shRNA or with a control vector and pulse-labeled with BrdU for 6 hr. NPCs were immunostained with an antibody against BrdU. The arrowheads indicate BrdU and GFP double-positive cells. Scale bars, 10 µm. Quantification of the number of GFP-BrdU double-positive cells relative to the total number of GFP-positive cells (B). (C,D) PCM1 knockdown in NPCs increases neurogenesis. NPCs were electroporated with a plasmid expressing PCM1 shRNA or with a control vector and then immunostained with antibodies against TUJ1. The arrowheads indicate TUJ1+GFP+ cells. Scale bars, 50 µm. Quantification of the number of GFP-TUJ1 double-positive cells relative to the number of GFP-positive cells (D). More than 1500 GFP-positive cells were counted for each condition. At least three sets of independent experiments were performed. The values represent the mean ± s.d. (n = 3). Student’s t-test, differences were considered significant at ***p<0.001.

DOI: http://dx.doi.org/10.7554/eLife.11324.024

Figure 5.

Figure 5—figure supplement 1. Efficient knockdown of PCM1.
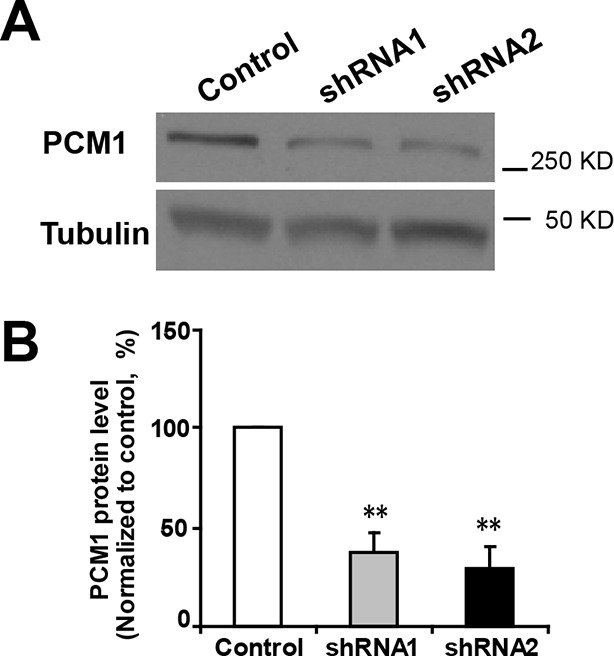
Figure 5—figure supplement 1.

(A) PCM1 knockdown in N2A cells demonstrated by western blots. (B) Densitometry analysis of western blots presented in (A). PCM1 shRNA2 was used for further proliferation and neurogenesis analysis in NPCs. At least three sets of independent experiments were performed. The values represent the mean ± s.d. (n = 3). Student’s t-test, differences were considered significant at **p<0.01.
Figure 5—figure supplement 2. PCM1 knockdown in NPCs did not trigger apoptotic cell death.

Figure 5—figure supplement 2.

(A,B) Ectopic expression of PCM1 shRNA does not affect TUNEL staining. Quantification of the number of GFP-TUNEL double-positive cells relative to the total number of GFP-positive cells (B). (C,D) Ectopic expression of PCM1 shRNA does not affect cleaved caspase-3 (C-caspase 3) staining. Scale bars, 20 μm. Quantification of the number of GFP-C-caspase 3 double-positive cells relative to the total number of GFP-positive cells (D). More than 1500 GFP-positive cells were counted for each condition. At least three sets of independent experiments were performed. The values represent the mean ± s.d. (n = 3). Student’s t-test, differences were considered significant at *p<0.05.
Figure 5—figure supplement 3. PCM1 knockdown in NPCs increases neurogenesis.

Figure 5—figure supplement 3.

(A-,B) NPCs were electroporated with a plasmid expressing PCM1 shRNA or with a control vector and then immunostained with antibodies against MAP2. The arrowheads indicate MAP2+GFP+ cells. Scale bars, 50 µm. Quantification of the number of GFP-MAP2 double-positive cells relative to the number of GFP-positive cells (B). More than 1500 GFP-positive cells were counted for each condition. At least three sets of independent experiments were performed. The values represent the mean ± s.d. (n = 3). Student’s t-test, differences were considered significant at ***p<0.001.
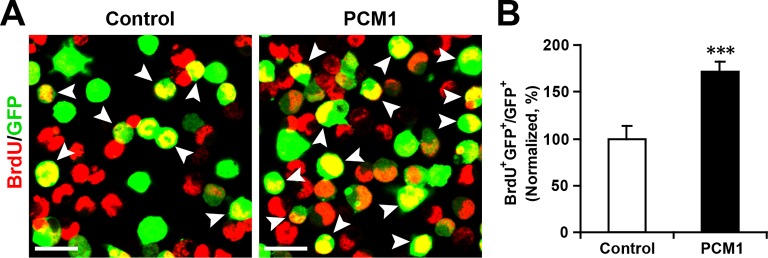
Figure 5—figure supplement 4. Overexpression of PCM1 increases NPC proliferation.

Figure 5—figure supplement 4.

(A,B) Overexpression of PCM1 increases NPC proliferation. NPCs were electroporated with a PCM1 overexpression construct or a control vector and pulse-labeled with BrdU for 6 hr. NPCs were immunostained with an antibody against BrdU. The arrowheads indicate BrdU and GFP double-positive cells. Scale bars, 10 µm. Quantification of the number of GFP-BrdU double-positive cells relative to the total number of GFP-positive cells (B). More than 1500 GFP-positive cells were counted for each condition. At least three sets of independent experiments were performed. The values represent the mean ± s.d. (n = 3). Student’s t-test, differences were considered significant at ***p<0.001.
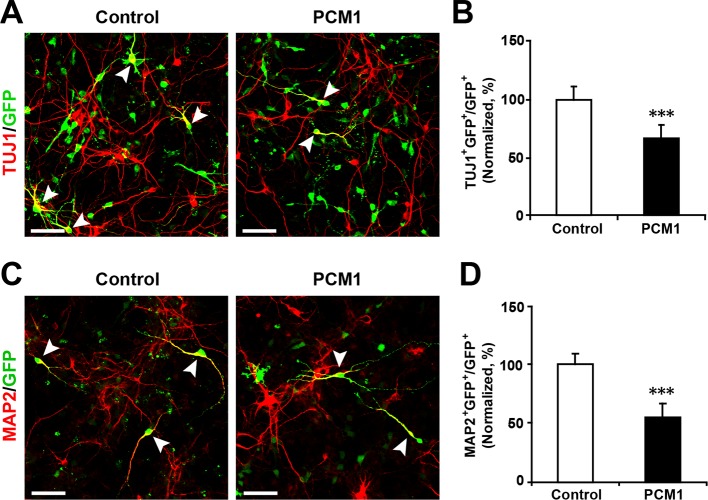
Figure 5—figure supplement 5. Overexpression of PCM1 decreases NPC neuronal differentiation.

Figure 5—figure supplement 5.

(A,B) Ectopic expression of PCM1 decreases TUJ1 staining. NPCs were electroporated with a PCM1 overexpression construct or a control vector and immunostained with antibodies against TUJ1. The arrowheads indicate TUJ1+GFP+ cells. Scale bars, 50 µm. Quantification of the number of GFP-TUJ1 double-positive cells relative to the number of GFP-positive cells (B). (C,D) Ectopic expression of PCM1 decreases MAP2 staining. NPCs were electroporated with the indicated plasmids and immunostained with antibodies against MAP2. The arrowheads indicate MAP2+GFP+ cells. Scale bars, 50 µm. Quantification of the number of GFP-MAP2 double-positive cells relative to the number of GFP-positive cells (D). More than 1500 GFP-positive cells were counted for each condition. At least three sets of independent experiments were performed. The values represent the mean ± s.d. (n = 3). Student’s t-test, differences were considered significant at ***p<0.001.
Figure 5—figure supplement 6. Overexpression of PCM1 in NPCs did not trigger apoptotic cell death.

Figure 5—figure supplement 6.

(A,B) Ectopic overexpression of PCM1 does not affect TUNEL staining. Quantification of the number of GFP-TUNEL double-positive cells relative to the total number of GFP-positive cells (B). (C,D) Ectopic overexpression of PCM1 does not affect cleaved caspase-3 (C-caspase 3) staining. Scale bars, 20 μm. Quantification of the number of GFP-C-caspase 3 double-positive cells relative to the total number of GFP-positive cells (D). More than 1500 GFP-positive cells were counted for each condition. At least three sets of independent experiments were performed. The values represent the mean ± s.d. (n = 3). Student’s t-test, differences were considered significant at *p<0.05.
Figure 5—figure supplement 7. PCM1 regulates NPC proliferation and differentiation in vivo.

Figure 5—figure supplement 7.

(A,B) PCM1 regulates the symmetric division of apical progenitors in the VZ/SVZ. Mouse embryos were electroporated at E13.5 with the indicated plasmids and sacrificed at E14.5. The nuclei of mitotic cells were labeled using antibodies against PH3. The orientation of the mitotic spindle relative to the ventricular surface was determined and categorized into horizontal (0–30°), oblique (30–60°), or vertical (60–90°) as pictured. Scale bars, 5 µm (A). Percentage of GFP and PH3 double-positive cells with the indicated mitotic spindle orientation following PCM1 overexpression (B). (C,D) Overexpression of PCM1 increases NPC proliferation in vivo compared to vector-only control treatment. Mouse embryos were electroporated at E13.5 with the indicated constructs. Twenty-four hours post-electroporation, dividing cells were marked by EdU pulse-labeling for 2 hr and sacrificed. The arrowheads indicate EdU+GFP+ cells. Scale bars, 10 µm. Quantification of the number of GFP-EdU double-positive cells relative to the number of GFP-positive cells (D). (E,F) Overexpression of PCM1 increases apical progenitors compared to vector-only control treatment. Mouse embryos were electroporated at E13.5 with the indicated constructs and sacrificed at E14.5. Brain sections were immunostained with antibodies against PAX6. The arrowheads indicate PAX6+GFP+ cells. Scale bars, 10 µm. Quantification of the number of GFP-PAX6 double-positive cells relative to the number of GFP-positive cells (F). (G,H) Overexpression of PCM1 decreases the number of basal progenitors compared to vector-only control treatment. Mouse embryos were electroporated at E13.5 with the indicated constructs and sacrificed at E14.5. Brain sections were immunostained with antibodies against TBR2. The arrowheads indicate TBR2+GFP+ cells. Scale bars, 10 µm. Quantification of the number of GFP-TBR2 double-positive cells relative to the number of GFP-positive cells (H). (I,J) Overexpression of PCM1 decreases neurogenesis compared to vector-only control treatment. Mouse embryos were electroporated at E13.5 with the indicated constructs and sacrificed at E17.5. Brain slices were immunostained for NEUN. Arrowheads indicate NEUN+GFP+ cells. Scale bars, 10 µm. Quantification of the number of GFP-NEUN double-positive cells relative to the number of GFP-positive cells (J). More than 1500 GFP-positive cells were counted for each condition. At least three sets of independent experiments were performed. The values represent the mean ± s.d. (n = 3). Student’s t-test, differences were considered significant at ***p<0.001.

Next, to determine whether knocking down endogenous PCM1 could trigger the neuronal differentiation of NPCs, NPCs were transfected with PCM1 shRNA or a scrambled control shRNA, induced to differentiate, and immunostained for TUJ1 (Figure 5C and D). Similar to miR-128 overexpression, PCM1 shRNA expression significantly increased the neuronal differentiation of NPCs (by approximately 60% compared with that of scrambled shRNA-transfected NPCs, Figure 5C and D). Consistent with this finding, MAP2 immunostaining revealed a similar increase in the neuronal differentiation of PCM1 shRNA-expressing NPCs (Figure 5—figure supplement 3A and B). Taken together, these results indicate that inhibiting PCM1, which is a target of miR-128, mimics the cellular effect of miR-128 on NPC proliferation and differentiation.

To examine whether PCM1 overexpression would exert the opposite effect of PCM1 knockdown in NPCs, we co-expressed PCM1 (without its 3’-UTR) in NPCs using a GFP expression construct and found that PCM1 overexpression increased the proliferation of NPCs compared to the vector-only control treatment (70% increase in BrdU and GFP double-positive cells) (Figure 5—figure supplement 4A and B). However, PCM1 overexpression decreased neurogenesis, as determined by immunostaining for TUJ1 (35% decrease in the number of TUJ1 and GFP double-positive cells) (Figure 5—figure supplement 5A and B) and MAP2 (45% decrease in the number of MAP2 and GFP double-positive cells) (Figure 5—figure supplement 5C and D). TUNEL and activated caspase-3 staining demonstrated that PCM1 overexpression had no effect on apoptosis (Figure 5—figure supplement 6). We confirmed these in vitro findings in vivo by electroporating PCM1 into NPCs in the VZ of E13.5 mouse brains. First, we monitored the mitotic spindle orientation of APs within the VZ that were undergoing mitosis by labeling the dividing nuclei with PH3 (Figure 5—figure supplement 7A). We observed a significant increase in the percentage of horizontally dividing cells upon PCM1 overexpression (Figure 5—figure supplement 7B, 20% ± SD). In addition, the expression of exogenous PCM1 in vivo led to a marked increase in the number of cells that incorporated EdU (40% increase in EdU and GFP double-positive cells) (Figure 5—figure supplement 7C and D). Furthermore, we observed a marked increase in the number of PAX6-positive apical progenitor cells (60% increase in PAX6 and GFP double-positive cells) (Figure 5—figure supplement 7E and F) and a decrease in the number of TBR2-positive intermediate progenitor cells in brains in which NPCs had been electroporated with PCM1 (40% decrease in TBR2 and GFP double-positive cells) (Figure 5—figure supplement 7G and H). We monitored the neuronal differentiation of PCM1-expressing NPCs in vivo using NEUN staining and observed a 25% decrease in the neuronal differentiation of the NPCs (Figure 5—figure supplement 7I and J).

PCM1 overexpression rescues the observed effects of miR-128 overexpression on NPC proliferation and differentiation

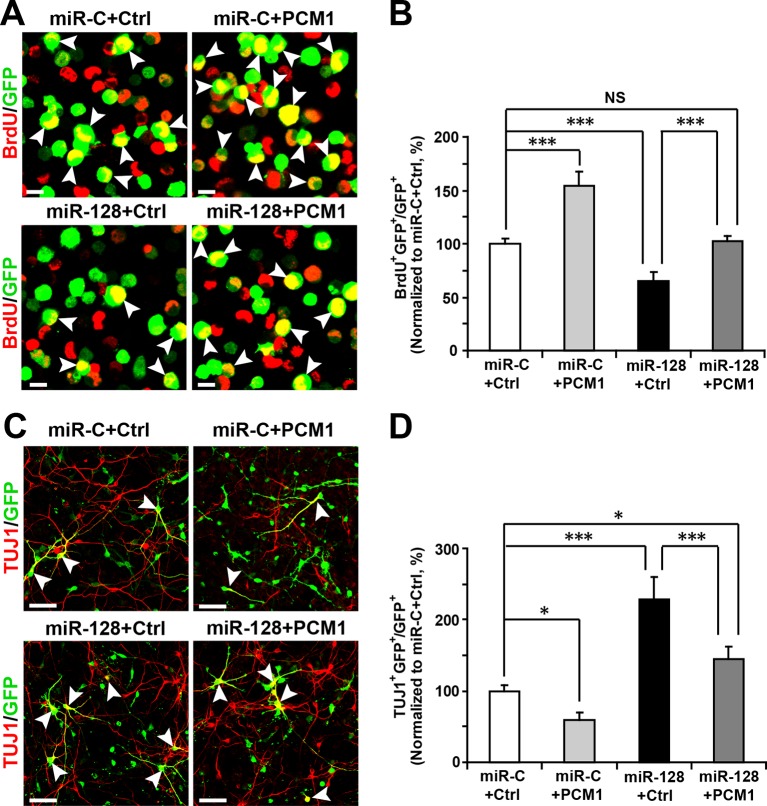
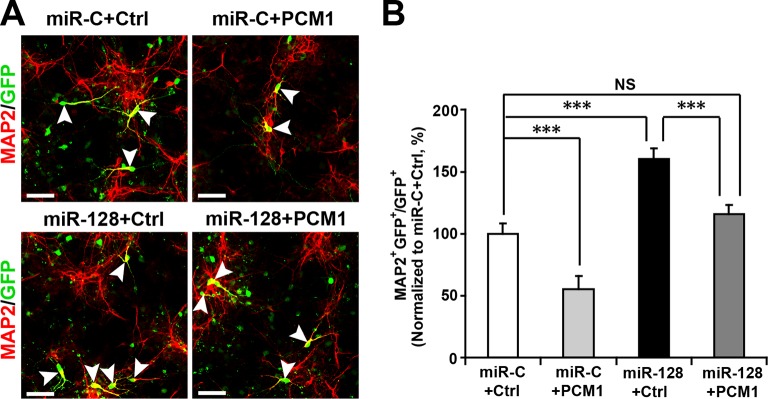
To determine whether the effect of miR-128 on neuronal differentiation is mediated through PCM1, we co-electroporated cells with miR-128 and a PCM1 expression vector lacking the 3’-UTR. A vector-only construct was used as the corresponding control construct for PCM1 overexpression. We found that PCM1 overexpression rescued the decrease in NPC proliferation (103% versus 62% for BrdU and GFP double-positive cells, Figure 6A and B), and reversed the observed increase in neuronal differentiation induced by miR-128 overexpression (150% versus 225% for TUJ1 and GFP double-positive cells, Figure 6C and D; 115% versus 160% for MAP2 and GFP double-positive cells; Figure 6—figure supplement 1A and B) in vitro.

Figure 6. PCM1 is a functional target of miR-128 in vitro.

(A,B) PCM1 antagonizes the effects of miR-128 on NPC proliferation in vitro. NPCs were electroporated with a miRNA control vector or with miR-128. Either a PCM1 expression construct or vector only control was co-electroporated in miR-128-expressing NPCs to examine the rescue effect of PCM1 in these cells. The cells were pulse-labeled with BrdU for 6 hr, and a proliferation assay was performed by immunostaining for BrdU (A). Scale bars, 10 µm. (B) Quantification of BrdU and GFP double-positive cells, demonstrating that PCM1 overexpression in the miR-128 cells rescued the reduced proliferation in the miR-128-expressing cells. (C,D) miR-128 antagonizes the function of PCM1 in neurogenesis in vitro. A neuronal differentiation assay was performed by immunostaining for TUJ1. The arrowheads indicate cells that are double-positive for TUJ1 and GFP (C). Scale bars, 50 µm. (D) Quantification of TUJ1 and GFP double-positive cells, demonstrating that PCM1 overexpression in the miR-128-expressing cells reverses the increased neurogenesis phenotype of the miR-128-expressing cells. More than 2000 GFP-positive cells were counted for each condition. At least three sets of independent experiments were performed. The values represent the mean ± s.d. (n = 3). ANOVA, differences were considered significant at ***p<0.001, **p<0.01 and *p<0.05.

DOI: http://dx.doi.org/10.7554/eLife.11324.032

Figure 6.

Figure 6—figure supplement 1. PCM1 is a functional target of miR-128 in vitro.

Figure 6—figure supplement 1.

NPCs were electroporated with a miRNA control vector or with miR-128. Either a PCM1 expression construct or vector only control was co-electroporated in miR-128-expressing NPCs to examine the rescue effect of PCM1 in these cells. A neuronal differentiation assay was performed by immunostaining for MAP2. The arrowheads indicate cells that are double-positive for MAP2 and GFP (A). Scale bars, 50 µm. (B) Quantification of MAP2 and GFP double-positive cells, demonstrating that PCM1 overexpression in the miR-128-expressing cells rescues the enhanced neurogenesis phenotype of the miR-128-expressing cells. More than 2000 GFP-positive cells were counted for each condition. At least three sets of independent experiments were performed. The values represent the mean ± s.d. (n = 3). ANOVA, differences were considered significant at ***p<0.001 and **p<0.01.

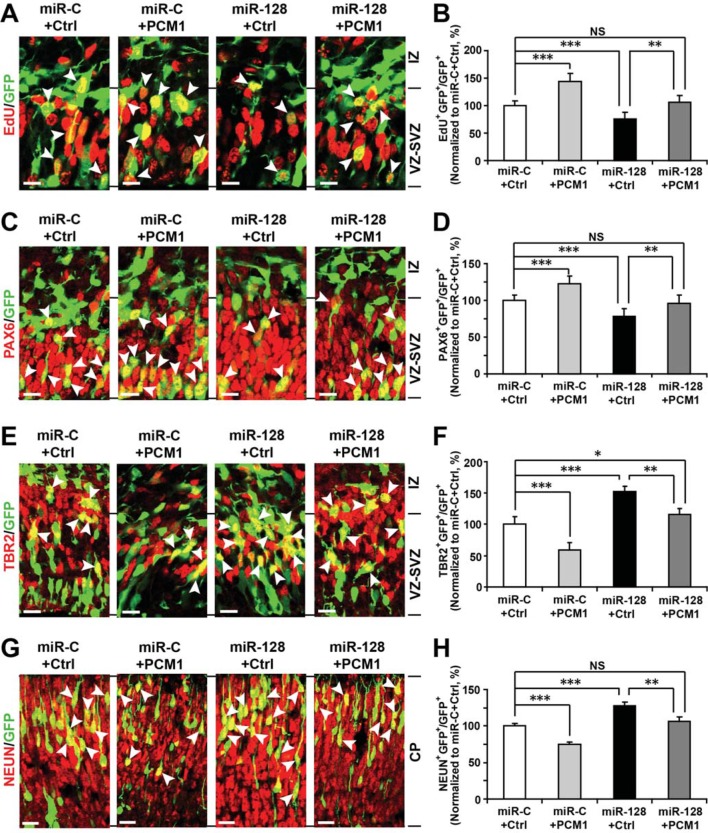
To further verify these results in vivo, we co-electroporated the PCM1 expression vector with miR-128 in utero. Similarly, we found that co-expression of PCM1 with miR-128 successfully reversed the effects of miR-128 on neural stem cell proliferation (100% versus 75% for EdU and GFP double-positive cells, Figure 7A and B), PAX6 (78% versus 60% for PAX6 and GFP double-positive cells, Figure 7C and D), and TBR2 expression (120% versus 160% for TBR2 and GFP double-positive cells, Figure 7E and F) as well as on neuronal differentiation (100% versus 123% for NEUN-positive cells, Figure 7G and H). Taken together, these results strongly suggest that miR-128 regulates the proliferation and differentiation of NPCs in the murine embryonic cortex by targeting PCM1 expression though a direct interaction with its 3’UTR.

Figure 7. PCM1 is a downstream target of miR-128 during NPC proliferation and differentiation in vivo.

Figure 7.

(A,B) PCM1 antagonizes the effects of miR-128 on NPC proliferation in vivo. Mouse embryos were electroporated at E13.5 with a miRNA control vector or with miR-128. Either a PCM1 expression construct or vector only control was co-electroporated in miR-128-expressing NPCs to examine the rescue effect of PCM1 in these cells. Twenty-four hours post-electroporation, dividing cells were marked by EdU pulse-labeling for 2 hr and sacrificed. The arrowheads indicate EdU+GFP+ cells. Scale bars, 10 µm. Quantification of the number of GFP-EdU double-positive cells relative to the number of GFP-positive cells (B). (C,D) PCM1 overexpression rescues the miR-128-mediated decrease in the number of apical progenitors. Mouse embryos were electroporated at E13.5 with the indicated constructs and sacrificed at E14.5. Brain sections were immunostained with antibodies against PAX6. The arrowheads indicate PAX6+GFP+ cells. Scale bars, 10 µm. Quantification of the number of GFP-PAX6 double-positive cells relative to the number of GFP-positive cells (D). (E,F) PCM1 overexpression rescues the miR-128-mediated increase in the number of basal progenitors. Mouse embryos were electroporated at E13.5 with the indicated constructs and sacrificed at E14.5. Brain sections were immunostained with antibodies against TBR2. The arrowheads indicate TBR2+GFP+ cells. Scale bars, 10 µm. Quantification of the number of GFP-TBR2 double-positive cells relative to the number of GFP-positive cells (F). (G,H) PCM1 overexpression rescues the miR-128-mediated increase in neurogenesis. Mouse embryos were electroporated at E13.5 with the indicated constructs and sacrificed at E17.5. Brain slices were immunostained for NEUN. Arrowheads indicate NEUN+GFP+ cells. Scale bars, 10 µm. Quantification of the number of GFP-NEUN double-positive cells relative to the number of GFP-positive cells (H). More than 1500 GFP-positive cells were counted for each condition. At least three sets of independent experiments were performed. The values represent the mean ± s.d. (n = 3). ANOVA, differences were considered significant at ***p<0.001 and **p<0.01.

DOI: http://dx.doi.org/10.7554/eLife.11324.034

Discussion

The cerebral cortex, which is the most complex structure of the brain, is responsible for cognitive, motor and perceptual behaviors (Volvert et al., 2012). The generation of cortical neurons depends on NPCs exiting the cell cycle, migrating, and subsequently partially maturing into neurons. These processes are orchestrated by multiple gene products that ultimately converge on the cytoskeleton to support morphological remodeling (Sun and Hevner, 2014). Therefore, for all of these processes to be correctly executed, the timing and abundance of specific gene products must be precisely regulated, and a lack of regulation may result in the cortical malformations that are associated with certain neuropsychiatric disorders (Zhang et al., 2014).

miRNAs are abundant, short-lived double-stranded RNAs of ~20-25 nucleotides that are derived from endogenous short-hairpin transcripts (Bartel, 2009). miRNAs contribute to various developmental processes by acting as post-transcriptional regulators; thus, they introduce an additional level of intricacy to gene regulation in neurogenesis. Recent data obtained by several groups support a primary role of miRNAs in fine-tuning signaling pathways that control the synchronized steps of cortical development (Kawahara et al., 2012; Shi et al., 2010).

Abu-Elneel et al. investigated the expression of 466 human miRNAs from postmortem cerebellar cortical tissue from individuals with ASDs and identified twenty-eight miRNAs that were expressed at significantly different levels in the ASD brains compared with the non-autism control brains (Abu-Elneel et al., 2008). Interestingly, of these dysegulated miRNAs, only three of them (miR-7, miR-128, and miR-132) were exclusively expressed in the brain (Li and Jin, 2010).

miR-128 is transcribed from two distinct loci, miR-128-1 and miR-128-2, as two primary transcripts that are processed into identical mature miRNA sequences (Adlakha and Saini, 2014). miR-128-1 and miR-128-2 reside in the intronic regions of genes on two different chromosomes (Tan et al., 2013). Previously, downregulation of miR-128 has been reported in several brain cancers, including glioblastoma and medulloblastoma (Adlakha and Saini, 2013; Peruzzi et al., 2013). Consistent with these findings, allelic loss of chromosome 3p, where miRNA-128-2 is encoded, has also been associated with the most aggressive forms of neuroblastoma, indicating that miR-128 may play an important role in the cell cycle as well as growth and differentiation (Adlakha and Saini, 2014).

In identifying the targets of miR-128, we eventually narrowed our search of potential miR-128 targets in NPCs to Pcm1, Nfia, Foxo4, and Fbxl20 (Figure 4—source data 1). Among them, Foxo4, which encodes for an insulin/IGF-1 responsive transcription factor that regulates cell cycles (Furukawa-Hibi et al., 2005; Schmidt et al., 2002), was ruled out as a probable functional target of miR-128 based on a recent study that reported the loss of FOXO4 reduces the potential of human embryonic stem cells (hESCs) to differentiate into neural lineages (Vilchez et al., 2013), which is opposite from miR-128 overexpression effects that we observed. Nfia (Nuclear Factor I/A) encodes for a protein that functions as a transcription and replication factor for adenovirus DNA replication (Qian et al., 1995), while Fbx120, encodes for a F-box protein which is involved in synaptic plasticity of neuronal networks (Takagi et al., 2012). As such, both genes were ruled out since their known biological functions were not relevant to the neurogenesis phenotype observed in miR-128 manipulation. Based on these rationales, we sought to focus on PCM1 as our primary gene of interest and investigate the functional relationship between PCM1 and miR-128 in early neurogenesis. Furthermore, based on our expression analysis, miR-128 expression is specific to neural stem cells and gradually increases during cortical development (Figure 1). In contrast, the expression level of its target protein PCM1 is higher during early developmental stages and lower during late developmental stages (Figure 4—figure supplement 3). The inverse expression patterns of PCM1 and miR-128 indicate that miR-128 may function by turning off PCM1 expression, indicating that PCM1 may be the primary regulator by which miR-128 governs NPC proliferation and differentiation.

In this study, we sought to recapitulate the miR-128 upregulation observed in some ASD brains by overexpressing miR-128 specifically in NPCs. Importantly, we observed a dramatic change in the proliferation and differentiation of NPCs. The observed effects of miR-128 are consistent with a previous study by Ge et al. that demonstrated that the loss of PCM1 triggered NPCs to exit the cell cycle early and promoted the premature differentiation of NPCs to neurons (Ge et al., 2010). In this study, knockdown of PCM1 resulted in impaired interkinetic nuclear migration of NPCs, which leads to the overproduction of neurons and to premature depletion of the NPC pool in the developing neocortex. Consistent with this description, our results showed that miR-128 overexpression produced a phenotype similar to that previously reported for PCM1 knockdown (Figures 2 and 3). More importantly, we found that this phenotype could be rescued by the co-expression of a miR-128-resistant PCM1 variant (Figures 6 and 7). In contrast, knockdown of miR-128 resulted in increased levels of PCM1 in NPCs (Figures 4) and showed the opposite phenotype of miR-128 overexpression in terms of NPC proliferation and differentiation (Figures 2 and 3). Our results suggest that miR-128 regulates NPC proliferation and differentiation by fine-tuning endogenous PCM1 levels, which serve as a primary regulator that is required for proper neurogenesis to occur.

Intriguingly, we recently identified 9 novel (i.e., previously unreported) missense mutations in the Pcm1 gene in ASD patients (H.S.J. and S.G.R., unpublished observations), indicating that PCM1 misregulation might be a core mechanism in some ASD patients with disrupted cortical development. Other recent studies using miR-128-2 knockout mice indicate that miR-128 levels regulate the excitability of adult neurons (Tan et al., 2013). By selectively inactivating miR-128-2 in forebrain neurons using Camk2a-Cre and floxed miR-128-2, Tan et al. found that reduced miR-128 expression triggered the early onset of hyperactivity, seizures, and death (Tan et al., 2013). Based on their bioinformatics network and pathway analyses of miR-128 target genes, those authors found that miR-128 may regulate the expression of numerous ion channels and transporters as well as genes that contribute to neurotransmitter-driven neuronal excitability and motor activity (Tan et al., 2013). Because NPCs are not excitable due to a lack of active sodium channels (Li et al., 2008), it is unlikely that the cellular effects of miR-128 observed here resulted from changes in the expression of ion channels or transporters. However, it will be interesting to follow neurons derived from NPCs with misregulated miR-128 to characterize how these neurons integrate into and function in cortical circuits. Moreover, it will be interesting to generate miR-128-1 and miR-128-2 double knockout mice and inducible miR-128-overexpressing transgenic mice to monitor the proliferation and differentiation of NPCs and their effects on behavior.

Taken together, our results suggest that miR-128 is an important regulator of cortical development through PCM1. Future studies to further elucidate specific aspects of the roles of miR-128 and PCM1 in neuronal development and function will be of great interest to this field.

Materials and methods

Animals

All studies were conducted with protocols that were approved by the Institutional Animal Care and Use Committee (IACUC, protocol number: 2013/SHS/809) of the Duke-NUS Graduate Medical School and National Neuroscience Institute. Time-mated C57BL/6 mice were purchased (InVivos, Singapore) at E13.5 and E14.5 for in utero electroporation and culturing of NPCs.

Isolation and culture of NPCs

Mouse embryos were harvested at E14.5, and the dorsolateral forebrain was dissected and enzymatically triturated to isolate a population of cells enriched in NPCs as previously described. NPCs isolated from a single brain were suspension-cultured in a T25 tissue culture flask in proliferation medium containing human EGF (10 ng ml-1), human FGF2 (20 ng ml-1) (Invitrogen, Carlsbad, CA), N2 supplement (1%) (GIBCO), penicillin (100 U ml-1), streptomycin (100 mg ml-1), and L-glutamine (2 mM) for 5 days and were allowed to proliferate to form neurospheres.

Transient transfection of NPCs by electroporation

DIV 5 neurospheres were dissociated into single cells using accutase, yielding 4–6 × 10⁶ cells per T25 flask. For each electroporation reaction, 1 × 10⁶ cells were mixed with 2 µg DNA and electroporated using the Neon electroporator (Invitrogen) according to the manufacturer’s protocol. Immediately following electroporation, cells were suspension-cultured in a 6-well tissue culture plate in proliferation medium and were allowed to re-form neurospheres for 24 hr.

In vitro NPC proliferation assay

Twenty-four hours post-electroporation, the cells were pulsed with 1 mM 5-bromo-2’-deoxyuridine (BrdU, Roche) for 6 hr. The neurospheres were then gently dissociated by pipetting and seeded onto 60 mm coverslips coated with poly-L-lysine and laminin, at a density of 2 × 10⁴ cells/coverslip. After waiting 30 min to allow the cells to attach, the cells were fixed with 4% paraformaldehyde for 30 min at room temperature. To detect BrdU, NPCs were pre-treated with 2 M HCl for 15 min at 37°C, washed with borate buffer (pH 8.5) for 30 min and immunostained using a mouse antibody against BrdU (#8039, Abcam).

In vitro NPC differentiation assay

Twenty-four hours post-electroporation, neurospheres were gently dissociated by pipetting and seeded onto 60 mm coverslips coated with poly-L-lysine and laminin, at a density of 2 × 10⁴ cells/coverslip. Subsequently, NPCs were cultured as monolayer in differentiation medium containing N2 (1%) in DMEM/F12 and were maintained for 5–6 days.

Immunocytochemistry

The primary antibodies included the following: rabbit anti-Ki67 (#15580, Abcam), mouse anti-beta III tubulin (TUJ1, #1637, Millipore), mouse anti-GFAP(#N206A/8, NeuroMab), mouse anti-NEUN (#MAB377, Millipore), chicken anti-MAP2 (#5392, Abcam), rabbit anti-PH3 (#9701, Cell Signaling), rabbit anti-TBR2 (#23345, Abcam), rabbit anti-cleaved caspase-3 (#9661, Cell Signaling), and rabbit anti-PAX6 (#PRB-278P, Covance). The secondary fluorochrome-conjugated antibodies were diluted 1:400 (donkey anti-mouse, donkey anti-rabbit, goat anti-mouse and goat anti-rabbit, goat anti-chicken (Invitrogen]). Nuclear counterstaining was performed with 4’, 6-diamidino-2-phenylindole dihydrochloride (DAPI) (Sigma-Aldrich, #B2261at 0.25 μg/μl). TUNEL staining was carried out using a kit purchased from Roche (#12156792910). Images were obtained using an LSM710 confocal microscope (Zeiss).

Laser capture microdissection (LCM)

For LCM, unfixed, fresh E14.5 brains were embedded in Tissue-Tek O.C.T. compound (Sakura) at -24°C. Ten-micrometer cryosections were mounted on PEN Membrane slides (Leica Microsystems, Germany) and stored at -80°C until ready for dissection. LCM of the VZ/SVZ, IZ, and CP was performed under direct visualization of the unstained tissue based on tissue morphology using an inverted microscope and PALM Robo software (Carl Zeiss, Germany). The isolated tissue samples were attached onto an Adhesive Cap-500 tube (Carl Zeiss) for direct lysis and total RNA extraction.

DNA, miRNA, and shRNA constructs

Lentiviral miR-128 expression plasmid and miR-128-Zip knockdown plasmid was obtained from System Biosciences. miR-128 inhibitor was obtained from Genepharma. The PCM1 expression construct was a kind gift from A. Kamiya (Johns Hopkins, US).

To generate luciferase reporter constructs, the 3’-UTR of Pcm1 was produced by PCR using murine genomic DNA library. Following primers were used: Pcm1 (1865bp), forward primer: 5’-GAACCTGAAACAGTGGGAGC-3’; reverse primer: 5’-ACGGTTGCATGTTCCCAATC-3’. The resulting PCR products were cloned into the pmirGLO Dual-Luciferase miRNA Target Expression Vector (Promega).

To generate the pmirGLO-PCM1 3’-UTR mutant construct, miR-128 targeting sequences (CACTGTG) were mutated to (GAGTCTG) by the Quick Change Site-Directed Mutagenesis Kit (Stratagene) using following primers: forward primer: 5'-CCTGGACAGATTCAAACCTTGACAGAGTCTGGGATTTTTCTTTTGC-3' and reverse primer: 5'-GCAAAAGAAAAATCCC‍AG‍ACTCTGTCAA‍G‍G‍TTTGAATCTGTCCAGG-3'.

We generated two Pcm1 shRNA vectors with two different published targeting sequences (Kamiya et al., 2008) #1: 5’-AGCTACTTAATACAGACTA-3’ and #2: TCAGCTTCGTGATTCTA using pCDH-U6-nucGFP-Puro vector which was modified from the lentiviral miR-128 expression plasmid, MMIR-128-1-PA-1.

Luciferase assay

HEK293 cells were transfected with either the miR-128 mimic or control miRNA in conjunction with the luciferase reporter constructs. Forty-eight hours after they were transfected, the cells were lysed and subjected to luciferase assays using the Dual Luciferase Reporter Assay System (Promega) according to the manufacturer’s protocol.

RNA isolation and real-time polymerase chain reaction (PCR)

Total RNA was extracted using the miRNeasy kit (Qiagen) from tissue samples or NPCs. The extraction procedure was then followed by cDNA synthesis using a cDNA synthesis kit (Promega). PCRs were performed on three independent sets of template, and the cycling parameters were as follows: 94°C for 15 s, 55°C for 30 s, and 70°C for 30 s for 40 cycles using the CFX96 real-time PCR detection system (Bio-Rad, Hercules, CA). For each assay, PCR was performed after a melting curve analysis. To reduce variability, we ran each sample in duplicate or even triplicate and included control qPCR reactions without template for each run. The qPCR primers are listed in Figure 4—source data 4.

In utero electroporation

Timed-pregnant mice (E13.5) were anesthetized with isoflurane (induction, 3.5%; surgery, 2.5%), and the uterine horns were exposed by laparotomy. The DNA (3–5 µg µl-1 in water) together with the dye Fast Green (2 mg ml-1; Sigma Aldrich, St. Louis, MO) was injected through the uterine wall into one of the lateral ventricles of each embryo using a 30-gauge Hamilton syringe. Approximately 2 μl of DNA and dye solution was delivered using a pressure injector (Picospritzer III; General Valve, Pine Brook, NJ). For electroporation, five electrical pulses (amplitude, 35 V; duration, 50 ms; intervals, 950 ms) were delivered with a BTX square-wave electroporation generator (Harvard Apparatus, Holiston, MA). The uterine horns were placed back into the abdominal cavity after electroporation, and the embryos were allowed to continue their normal development. Electroporated mouse brains were harvested at E14.5 and E17.5 for the proliferation and differentiation analyses, respectively.

Mitotic spindle orientation assay

The mitotic spindle orientation of dividing cells was determined on micrographs by measuring the angle of chromosomes relative to the ventricular surface. Nuclei were counterstained with DAPI, and mitotic cells were immunostained with PH3. GFP-PH3 double-positive cells within the VZ were identified on micrographs, and approximately 150 cells per experimental condition were used for quantification.

In vivo NPC proliferation and cell cycle exit assay

For proliferation assays, E14.5 pregnant dams were administered 5-ethynyl-2’-deoxyuridine (5 mg per kg body weight dissolved in 0.9% saline) (EdU, ThermoFisher Scientific) by intraperitoneal injection, and the embryos were harvested 2 hr later. For cell cycle exit assays, E13.5 pregnant dams were IP injected with 5 mg per kg body weight EdU immediately following in utero electroporation, and the embryos were harvested 24 hr later. Visualization of EdU was performed in accordance with the manufacturer’s protocol.

In situ (ISH) and immunohistochemistry

A 5’- digoxigenin (DIG)-labeled locked nucleic acid (LNA) miR-128 ISH detection probe (Exiqon) was used to detect miR-128 expression in the brain. The sequence of the probe was 5’-AAAGAGACCGGTTCACTGTGA-3’. Briefly, E12.5 to P0 perfused brains were dehydrated in 30% sucrose, embedded with Tissue-Tek, and sectioned at 12 µm (coronal sections) or 14 µm (sagittal sections). Next, the brain slices were treated with 10 μg ml-1 Proteinase K at 37°C for 15 min, followed by incubation with the LNA-DIG-labeled miR-128 detection probes (50 nM) at 50°C overnight. The sections were blocked with PBS containing 0.1% Triton X-100, 10% normal goat serum (NGS), and 0.2% bovine serum albumin (BSA) and were incubated with an AP-conjugated anti-DIG antibody (1:1000) in PBS at 4°C overnight. The NBT+CIP substrate was then added (#K2191020, BioChain Institute, Newark, CA). For simultaneous miR-128 ISH and immunostaining, the brain slices were incubated with primary antibodies (peroxidase-conjugated anti-DIG, 1:200 [Roche]; mouse anti-NESTIN, 1:1000 [Sigma]) in Tris-Buffered Saline (TBS) containing 0.1% Tween-20, 20% NGS and 0.1% BSA. Immunostaining was detected using Alexa 488, Alexa 555 or Alexa 647 fluorescent secondary antibodies. Slices were mounted with Vectashield containing DAPI (Vector Labs, Burlingame, CA) and examined with confocal microscopy.

Confocal image acquisition and quantification

For the analysis of electroporated brain areas, volumetric z-stacks were acquired for each experimental condition using an LSM710 laser confocal microscope and the Z-series images were collapsed with a maximum intensity projection to a 2D representation. To quantify NPC neurogenesis, the Z-series images were taken using a 40x oil immersion objective (NA 1.3) in the CP zone. To quantify the proliferation of NPCs, the Z-series images were taken using a 60x oil immersion objective (NA 1.3) in the SVZ. Approximately 1500–2000 GFP-positive cells were counted for each condition, and at least three sets of independent experiments were performed and manually quantified in a blind manner.

Immunoblotting

Cells or brain tissues were lysed using RIPA buffer containing phosphatase and protease inhibitors. Proteins were separated by SDS–PAGE under reducing conditions and transferred to polyvinyl difluoride (PVDF) membranes (Millipore, Billerica, MA). Antibody incubations were performed in 5% BSA in TBS buffer using following antibodies: anti-PCM1, 1:1000(Cell Signaling, Danvers, MA); anti-β-actin, 1:1000 (Santa Cruz, Dallas, TX); and HRP-conjugated rabbit or mouse antibodies, 1:3,000 (GE Life Science, Pittsburgh, PA).

Generation of lentiviral particles

Recombinant lentiviral particles were produced by co-transfection of HEK293T cells with 6 μg of pMD2G-VSVG, 6 μg of PAX2 packaging plasmids, and 0 μg of pCDH-U6-shRNA-nucGFP-Puro plasmid construct using Lipofectamine 2000 (Life Technologies). Lentiviral particles were collected from supernatant after 72 hr by using PEG-it kit (System Biosciences). Lentiviral particles were concentrated up to 2 × 105 TU/μL.

Statistical analysis

At least 3 experiments were performed independently under each experiment condition, and similar results were obtained. Statistical analyses were performed using ANOVA and Student’s t-test. All data were presented as mean and standard deviation (mean ± SD). Statistical significance was defined when ***p<0.001, **p<0.01, *p<0.05 compared with the control.

Acknowledgements

We are grateful to Dr. Atsushi Kamiya (Johns Hopkins) for mouse PCM1 expression vectors. Also, we thank Drs. Jaewon Ko and Shirish Shenolikar for their critical comments on the manuscript and helpful advice. This work was supported by Singapore Translational Research (STaR) Investigator Award to EKT, A*STAR BMRC TCRP Grant (13/1/96/19/688, to HSJ and LZ), Duke-NUS Signature Research Program Block Grant (to HSJ), and NNI Research Grant (to LZ).

Funding Statement

The funders had no role in study design, data collection and interpretation, or the decision to submit the work for publication.

Funding Information

This paper was supported by the following grants:

  • Singapore A*Star 13/1/96/19/688 to Wei Zhang, Hidayat Lokman, Hyunsoo Shawn Je, Li Zeng.

  • Duke-NUS GMS Signature Research Program Grant to Hyunsoo Shawn Je.

  • NNI Research Grant to Eng King Tan, Li Zeng.

  • Singapore Translational Research Investigator Award to Eng King Tan.

Additional information

Competing interests

The authors declare that no competing interests exist.

Author contributions

WZ, Conceived, designed, and performed most of experiments, Conception and design, Acquisition of data, Analysis and interpretation of data, Drafting or revising the article.

PJK, Conceived, designed, and performed most of experiments, Conception and design, Acquisition of data, Analysis and interpretation of data, Drafting or revising the article.

ZC, Performed qPCR analysis, microdissection, and imaging analysis, Acquisition of data, Analysis and interpretation of data.

HL, Performed qPCR analysis, microdissection, and imaging analysis, Acquisition of data, Analysis and interpretation of data.

LQ, Performed qPCR analysis, microdissection, and imaging analysis, Acquisition of data, Analysis and interpretation of data.

KZ, Performed qPCR analysis, microdissection, and imaging analysis, Acquisition of data, Analysis and interpretation of data.

SGR, Performed bioinformatic analysis and edited the paper, Analysis and interpretation of data, Drafting or revising the article.

EKT, Provided tissue samples, antibodies, and edited the paper, Drafting or revising the article, Contributed unpublished essential data or reagents.

HSJ, Contributed to ideas, designed, and supervised all experiments, Conception and design, Analysis and interpretation of data, Drafting or revising the article.

LZ, Contributed to ideas, designed, and supervised all experiments, Conception and design, Analysis and interpretation of data, Drafting or revising the article.

Ethics

Animal experimentation: All studies were conducted with protocols that were approved by the Institutional Animal Care and Use Committee (IACUC, protocol number: 2013/SHS/809) of the Duke-NUS Graduate Medical School and National Neuroscience Institute.

References

  1. Abu-Elneel K, Liu T, Gazzaniga FS, Nishimura Y, Wall DP, Geschwind DH, Lao K, Kosik KS. Heterogeneous dysregulation of microRNAs across the autism spectrum. Neurogenetics. 2008;9:153–161. doi: 10.1007/s10048-008-0133-5. [DOI] [PubMed] [Google Scholar]
  2. Adlakha YK, Saini N. MiR-128 exerts pro-apoptotic effect in a p53 transcription-dependent and -independent manner via PUMA-bak axis. Cell Death and Disease. 2013;4:e11324. doi: 10.1038/cddis.2013.46. [DOI] [PMC free article] [PubMed] [Google Scholar]
  3. Adlakha YK, Saini N. Brain microRNAs and insights into biological functions and therapeutic potential of brain enriched miRNA-128. Molecular Cancer. 2014;13:33. doi: 10.1186/1476-4598-13-33. [DOI] [PMC free article] [PubMed] [Google Scholar]
  4. Bartel DP. MicroRNAs: target recognition and regulatory functions. Cell. 2009;136:215–233. doi: 10.1016/j.cell.2009.01.002. [DOI] [PMC free article] [PubMed] [Google Scholar]
  5. Bez A, Corsini E, Curti D, Biggiogera M, Colombo A, Nicosia RF, Pagano SF, Parati EA. Neurosphere and neurosphere-forming cells: morphological and ultrastructural characterization. Brain Research. 2003;993:18–29. doi: 10.1016/j.brainres.2003.08.061. [DOI] [PubMed] [Google Scholar]
  6. Cai L, Morrow EM, Cepko CL. Misexpression of basic helix-loop-helix genes in the murine cerebral cortex affects cell fate choices and neuronal survival. Development. 2000;127:3021–3030. doi: 10.1242/dev.127.14.3021. [DOI] [PubMed] [Google Scholar]
  7. Chen Y, Dong C. Abeta40 promotes neuronal cell fate in neural progenitor cells. Cell Death and Differentiation. 2009;16:386–394. doi: 10.1038/cdd.2008.94. [DOI] [PubMed] [Google Scholar]
  8. Ferreira A, Caceres A. Expression of the class III beta-tubulin isotype in developing neurons in culture. Journal of Neuroscience Research. 1992;32:516–529. doi: 10.1002/jnr.490320407. [DOI] [PubMed] [Google Scholar]
  9. Franzoni E, Booker SA, Parthasarathy S, Rehfeld F, Grosser S, Srivatsa S, Fuchs HR, Tarabykin V, Vida I, Wulczyn FG. MiR-128 regulates neuronal migration, outgrowth and intrinsic excitability via the intellectual disability gene Phf6. eLife. 2015;4 doi: 10.7554/eLife.04263. [DOI] [PMC free article] [PubMed] [Google Scholar]
  10. Furukawa-Hibi Y, Kobayashi Y, Chen C, Motoyama N. FOXO transcription factors in cell-cycle regulation and the response to oxidative stress. Antioxidants & Redox Signaling. 2005;7:752–760. doi: 10.1089/ars.2005.7.752. [DOI] [PubMed] [Google Scholar]
  11. Ge X, Frank CL, Calderon de Anda F, Tsai L-H. Hook3 interacts with PCM1 to regulate pericentriolar material assembly and the timing of neurogenesis. Neuron. 2010;65:191–203. doi: 10.1016/j.neuron.2010.01.011. [DOI] [PMC free article] [PubMed] [Google Scholar]
  12. Guibinga G-H, Hrustanovic G, Bouic K, Jinnah HA, Friedmann T. MicroRNA-mediated dysregulation of neural developmental genes in HPRT deficiency: clues for lesch-nyhan disease? Human Molecular Genetics. 2012;21:609–622. doi: 10.1093/hmg/ddr495. [DOI] [PMC free article] [PubMed] [Google Scholar]
  13. Gupta A, Tsai L-H, Wynshaw-Boris A. Life is a journey: a genetic look at neocortical development. Nature Reviews Genetics. 2002;3:342–355. doi: 10.1038/nrg799. [DOI] [PubMed] [Google Scholar]
  14. Heng JI-T, Chariot A, Nguyen L. Molecular layers underlying cytoskeletal remodelling during cortical development. Trends in Neurosciences. 2010;33:38–47. doi: 10.1016/j.tins.2009.09.003. [DOI] [PubMed] [Google Scholar]
  15. Hollis ER, Jamshidi P, Low K, Blesch A, Tuszynski MH. Induction of corticospinal regeneration by lentiviral trkB-induced erk activation. Proceedings of the National Academy of Sciences of the United States of America. 2009;106:7215–7220. doi: 10.1073/pnas.0810624106. [DOI] [PMC free article] [PubMed] [Google Scholar]
  16. Huttner WB, Kosodo Y. Symmetric versus asymmetric cell division during neurogenesis in the developing vertebrate central nervous system. Current Opinion in Cell Biology. 2005;17:648–657. doi: 10.1016/j.ceb.2005.10.005. [DOI] [PubMed] [Google Scholar]
  17. Ishino Y, Hayashi Y, Naruse M, Tomita K, Sanbo M, Fuchigami T, Fujiki R, Hirose K, Toyooka Y, Fujimori T, Ikenaka K, Hitoshi S. Bre1a, a histone H2B ubiquitin ligase, regulates the cell cycle and differentiation of neural precursor cells. Journal of Neuroscience. 2014;34:3067–3078. doi: 10.1523/JNEUROSCI.3832-13.2014. [DOI] [PMC free article] [PubMed] [Google Scholar]
  18. Kamiya A, Tan PL, Kubo Ken-ichiro, Engelhard C, Ishizuka K, Kubo A, Tsukita S, Pulver AE, Nakajima K, Cascella NG, Katsanis N, Sawa A. Recruitment of PCM1 to the centrosome by the cooperative action of DISC1 and BBS4. Archives of General Psychiatry. 2008;65:996–1006. doi: 10.1001/archpsyc.65.9.996. [DOI] [PMC free article] [PubMed] [Google Scholar]
  19. Kawahara H, Imai T, Okano H. MicroRNAs in neural stem cells and neurogenesis. Frontiers in Neuroscience. 2012;6 doi: 10.3389/fnins.2012.00030. [DOI] [PMC free article] [PubMed] [Google Scholar]
  20. Krishnan K, Steptoe AL, Martin HC, Wani S, Nones K, Waddell N, Mariasegaram M, Simpson PT, Lakhani SR, Gabrielli B, Vlassov A, Cloonan N, Grimmond SM. MicroRNA-182-5p targets a network of genes involved in DNA repair. RNA. 2013;19:230–242. doi: 10.1261/rna.034926.112. [DOI] [PMC free article] [PubMed] [Google Scholar]
  21. Li T, Jiang L, Chen H, Zhang X. Characterization of excitability and voltage-gated ion channels of neural progenitor cells in rat hippocampus. Journal of Molecular Neuroscience. 2008;35:289–295. doi: 10.1007/s12031-008-9065-7. [DOI] [PubMed] [Google Scholar]
  22. Li X, Jin P. Roles of small regulatory RNAs in determining neuronal identity. Nature Reviews Neuroscience. 2010;11:329–338. doi: 10.1038/nrn2739. [DOI] [PubMed] [Google Scholar]
  23. Ma Q-H, Futagawa T, Yang W-L, Jiang X-D, Zeng L, Takeda Y, Xu R-X, Bagnard D, Schachner M, Furley AJ, Karagogeos D, Watanabe K, Dawe GS, Xiao Z-C. A TAG1-APP signalling pathway through Fe65 negatively modulates neurogenesis. Nature Cell Biology. 2008;10:283–294. doi: 10.1038/ncb1690. [DOI] [PubMed] [Google Scholar]
  24. Martínez-Cerdeño V, Noctor SC, Kriegstein AR. The role of intermediate progenitor cells in the evolutionary expansion of the cerebral cortex. Cerebral Cortex. 2006;16:i152–i161. doi: 10.1093/cercor/bhk017. [DOI] [PubMed] [Google Scholar]
  25. Mi H, Muruganujan A, Casagrande JT, Thomas PD. Large-scale gene function analysis with the PANTHER classification system. Nature Protocols. 2013;8:1551–1566. doi: 10.1038/nprot.2013.092. [DOI] [PMC free article] [PubMed] [Google Scholar]
  26. Peruzzi P, Bronisz A, Nowicki MO, Wang Y, Ogawa D, Price R, Nakano I, Kwon C-H, Hayes J, Lawler SE, Ostrowski MC, Chiocca EA, Godlewski J. MicroRNA-128 coordinately targets polycomb repressor complexes in glioma stem cells. Neuro-Oncology. 2013;15:1212–1224. doi: 10.1093/neuonc/not055. [DOI] [PMC free article] [PubMed] [Google Scholar]
  27. Pontious A, Kowalczyk T, Englund C, Hevner RF. Role of intermediate progenitor cells in cerebral cortex development. Developmental Neuroscience. 2008;30:24–32. doi: 10.1159/000109848. [DOI] [PubMed] [Google Scholar]
  28. Postiglione MP, Jüschke C, Xie Y, Haas GA, Charalambous C, Knoblich JA. Mouse inscuteable induces apical-basal spindle orientation to facilitate intermediate progenitor generation in the developing neocortex. Neuron. 2011;72:269–284. doi: 10.1016/j.neuron.2011.09.022. [DOI] [PMC free article] [PubMed] [Google Scholar]
  29. Qian F, Kruse U, Lichter P, Sippel AE. Chromosomal localization of the four genes (nFIA, b, c, and X) for the human transcription factor nuclear factor i by FISH. Genomics. 1995;28:66–73. doi: 10.1006/geno.1995.1107. [DOI] [PubMed] [Google Scholar]
  30. Schmidt M, Fernandez de Mattos S, van der Horst A, Klompmaker R, Kops GJPL, Lam EW-F, Burgering BMT, Medema RH. Cell cycle inhibition by FoxO forkhead transcription factors involves downregulation of cyclin D. Molecular and Cellular Biology. 2002;22:7842–7852. doi: 10.1128/MCB.22.22.7842-7852.2002. [DOI] [PMC free article] [PubMed] [Google Scholar]
  31. Scholzen T, Gerdes J. The ki-67 protein: from the known and the unknown. Journal of Cellular Physiology. 2000;182:311–322. doi: 10.1002/(SICI)1097-4652(200003)182:3&#x0003c;311::AID-JCP1&#x0003e;3.0.CO;2-9. [DOI] [PubMed] [Google Scholar]
  32. Shi Y, Zhao X, Hsieh J, Wichterle H, Impey S, Banerjee S, Neveu P, Kosik KS. MicroRNA regulation of neural stem cells and neurogenesis. Journal of Neuroscience. 2010;30:14931–14936. doi: 10.1523/JNEUROSCI.4280-10.2010. [DOI] [PMC free article] [PubMed] [Google Scholar]
  33. Smrt RD, Szulwach KE, Pfeiffer RL, Li X, Guo W, Pathania M, Teng Z-Q, Luo Y, Peng J, Bordey A, Jin P, Zhao X. MicroRNA miR-137 regulates neuronal maturation by targeting ubiquitin ligase mind bomb-1. Stem Cells. 2010;28:1060–1070. doi: 10.1002/stem.431. [DOI] [PMC free article] [PubMed] [Google Scholar]
  34. Sun T, Hevner RF. Growth and folding of the mammalian cerebral cortex: from molecules to malformations. Nature Reviews Neuroscience. 2014;15:217–232. doi: 10.1038/nrn3707. [DOI] [PMC free article] [PubMed] [Google Scholar]
  35. Takagi H, Setou M, Ito S, Yao I. SCRAPPER regulates the thresholds of long-term Potentiation/Depression, the bidirectional synaptic plasticity in hippocampal CA3-CA1 synapses. Neural Plasticity. 2012;2012:1–7. doi: 10.1155/2012/352829. [DOI] [PMC free article] [PubMed] [Google Scholar]
  36. Tan CL, Plotkin JL, Veno MT, von Schimmelmann M, Feinberg P, Mann S, Handler A, Kjems J, Surmeier DJ, O'Carroll D, Greengard P, Schaefer A. MicroRNA-128 governs neuronal excitability and motor behavior in mice. Science. 2013;342:1254–1258. doi: 10.1126/science.1244193. [DOI] [PMC free article] [PubMed] [Google Scholar]
  37. Tan X, Shi S-H. Neocortical neurogenesis and neuronal migration. Wiley Interdisciplinary Reviews: Developmental Biology. 2013;2:443–459. doi: 10.1002/wdev.88. [DOI] [PMC free article] [PubMed] [Google Scholar]
  38. Vilchez D, Boyer L, Lutz M, Merkwirth C, Morantte I, Tse C, Spencer B, Page L, Masliah E, Berggren WT, Gage FH, Dillin A. FOXO4 is necessary for neural differentiation of human embryonic stem cells. Aging Cell. 2013;12:518–522. doi: 10.1111/acel.12067. [DOI] [PMC free article] [PubMed] [Google Scholar]
  39. Volvert M-L, Rogister F, Moonen G, Malgrange B, Nguyen L. MicroRNAs tune cerebral cortical neurogenesis. Cell Death and Differentiation. 2012;19:1573–1581. doi: 10.1038/cdd.2012.96. [DOI] [PMC free article] [PubMed] [Google Scholar]
  40. Wang W-Z, Oeschger FM, Lee S, Molnár Z. High quality RNA from multiple brain regions simultaneously acquired by laser capture microdissection. BMC Molecular Biology. 2009;10:69. doi: 10.1186/1471-2199-10-69. [DOI] [PMC free article] [PubMed] [Google Scholar]
  41. Wang X, Lui JH, Kriegstein AR. Orienting fate: spatial regulation of neurogenic divisions. Neuron. 2011;72:191–193. doi: 10.1016/j.neuron.2011.10.003. [DOI] [PMC free article] [PubMed] [Google Scholar]
  42. M. Witkos T, Koscianska E, J. Krzyzosiak W. Practical aspects of microRNA target prediction. Current Molecular Medicine. 2011;11:93–109. doi: 10.2174/156652411794859250. [DOI] [PMC free article] [PubMed] [Google Scholar]
  43. Yang Y-T, Wang C-L, Van Aelst L. DOCK7 interacts with TACC3 to regulate interkinetic nuclear migration and cortical neurogenesis. Nature Neuroscience. 2012;15:1201–1210. doi: 10.1038/nn.3171. [DOI] [PMC free article] [PubMed] [Google Scholar]
  44. Zhang W, Thevapriya S, Kim PJ, Yu W-P, Shawn Je H, King Tan E, Zeng L. Amyloid precursor protein regulates neurogenesis by antagonizing miR-574-5p in the developing cerebral cortex. Nature Communications. 2014;5 doi: 10.1038/ncomms4330. [DOI] [PubMed] [Google Scholar]
eLife. 2016 Feb 17;5:e11324. doi: 10.7554/eLife.11324.038

Decision letter

Editor: Eunjoon Kim1

In the interests of transparency, eLife includes the editorial decision letter and accompanying author responses. A lightly edited version of the letter sent to the authors after peer review is shown, indicating the most substantive concerns; minor comments are not usually included.

[Editors’ note: a previous version of this study was rejected after peer review, but the authors submitted for reconsideration. The first decision letter after peer review is shown below.]

Thank you for choosing to send your work entitled "miR-128 Regulates Proliferation and Neurogenesis of Neural Precursors by Targeting PCM1 in the Developing Neocortex" for consideration at eLife. Your full submission has been evaluated by a Senior editor, a Reviewing editor and three peer reviewers, and the decision was reached after discussions between the reviewers. Based on our discussions and the individual reviews below, we regret to inform you that your work will not be considered further for publication in eLife.

Reviewer #1:

1) The conclusion of the first paragraph is: "qPCR confirmed the observed neural tissue-specific miR-128 expression." But none of the preceding data suggests specificity. For example, "miR-128 was expressed at low levels in the subventricular zone (SVZ) and in the cortical plate (CP) at E14.5…" and "…we performed quantitative real-time PCR (qPCR) and found a similar temporal enrichment of miR-128 in the forebrain, which contains both the SVZ and the CP". Also, "…miR-128 was found to be predominantly expressed in the brain and spinal cord of E14.5 mice…". This does not strike the reviewer as specificity.

2) The authors claim: "High-magnification images of cortical slices at E14.5 revealed the expression of miR-128 in cells within the SVZ and the CP but not within the intermediate zone (IZ) (Figure 1C)." The enrichment of the labeling looks convincing for the CP but there is no obvious distinction between the SVZ and the IZ.

3) The isolation procedure of NPCs requires more details regarding its efficiency.

4) The authors state: "The percentage of BrdU- positive but Ki67-negative cells was increased by 350% in NPCs overexpressing miR-128 (Figure 2C, D, arrowheads for BrdU-positive, Ki67-negative cells), indicating that the ectopic expression of miR-128 stimulated NPCs to exit the cell cycle." The conclusion regarding exit from the cell cycle does not follow from the BrdU -positive/Ki67 negative cells.

5) TUNEL is a relatively insensitive way to detect apoptosis and should be complemented by other more conclusive methods.

6) What was the efficiency of the transfection with CMV-promoter-driven expression of the mouse miR-128-1 precursor and EF1α promoter-driven copGFP constructs?

7) The claim of an effect on neuronal differentiation is a good start, but their study requires more detail regarding exactly what the effects are on differentiation and on specific cell types. The paper as it now stands reads like an isolated observation without larger conceptual insights arising from the data presented.

Reviewer #2:

The development of the cerebral cortex involves a tight coordination of progenitor proliferation, neuron migration and differentiation. The present work analyses the function of miR-128 during cerebral cortex development, which is a microRNA misregulated in autism spectrum disorder. The findings suggest that miR-128 is expressed by cortical progenitors where it controls their proliferation and differentiation by repressing the expression of PCM1, a protein previously described as critical for cell-cycle regulation. Ectopic expression of miR-128 promotes cell cycle exit and neurogenesis in vitro as well as in the cortex in vivo. This phenotype is rescued by PCM1 gain of function and mimicked by its loss expression, suggesting that PCM1 is a downstream target of miR-128 critical for cortical neurogenesis. Thus miR128 may belong to the machinery that coordinate cell cycle exit with neuronal differentiation.

1) According to its marked detection in the CP but not in VZ/SVZ, miR-128 has recently been shown to be solely important for late aspects of corticogenesis (migration and differentiation of projection neurons) (Franzoni et al., 2015). The results of the present findings suggest an early function of miR-128 and the reviewer highly recommends clarification of the discrepancy observed between both works.

2) The authors claim that miR-128 is not expressed in the IZ. The low magnification in Figure 1C is not conclusive and doesn't allow the reviewer to take a conclusion. One suitable experiment is qRT-PCR analysis of miR-128 and its corresponding pre-miR128 on laser-captured cortical wall regions.

3) The described gain of function phenotypes in vitro (Figure 2) is incomplete and should include more information about the experimental procedures in the text (e.g. length of BrdU pulses for cell cycle exit, timing of cultures, etc.).

4) Additional loss of function experiments (using antagomiRs or sponges against endogenous miR-128) should be done to support a physiological function of miR-128 in NPCs. This remark also stands for in utero (in vivo) experiments.

5) The monitoring of AP (=RGC) and IP cell populations using Pax6 and Tbr2, respectively is inconclusive. Other markers should be checked (such as Sox2 for AP and Insm1 for IP) to exclude specific marker loss after miR-128 expression rather than progenitor population loss.

6) The authors claim that overexpression of miR-128 "accelerates" cell cycle exit in vivo, however this is not experimentally demonstrated. In addition, promoting the generation of IPs is not really matching with increase cell cycle exit as these progenitors retain the ability to cycle and generate the bulk of projection neurons. This should be clarified and rephrased in the text.

7) It is not clear what parameter overexpression of miR-128 is affecting in APs. Is it only promoting the generation of IP or also inducing direct neurogenesis? This should be experimentally addressed. Moreover, these experiments should be complemented by loss of function studies as mentioned above. In its present form, the manuscript does not address any physiological roles of mir-128 in corticogenesis.

8) While there is no doubt that miR-128 can target PCM1 mRNAs in vitro, the expression of PCM and its targeting by endogenous miR-128 should be assessed in vivo (immunolabelings, etc.). Along this line the results obtained with functional experiments performed in vitro with miR-128 or PCM1 (proliferation and differentiation) should be confirmed in vivo. This is important because cultured NPC are different from resident APs and IPs (gene expression pattern deregulated to some extent).

Reviewer #3:

In this manuscript, the authors investigated the function of miR-128 in cortical neural differentiation. They showed that miR-128 enhances neuronal differentiation and represses proliferation of NPCs through PCM1. The results are interesting. However the data are limited and impact is moderate. I have several major concerns.

First, the experiments are not complete. For gene or miRNA functional assays, both gain and loss of function assays should be performed, but not. The justification of ASD link is based on a previous study showing that miR-128 is one of 28 microRNAs dysregulated in at least one ASD individuals (for miR-128, the level is decreased in one ASD) (Abu-Elneel Neurogenetics 2008). However, several experiments only show the impact of overexpression of miR-128, not reduction, on NPCs.

Second, the in vitro NPC assays were done using electroporation which introduces a large amount of genetic materials into the cells. Electroporation also leads to a lot of cell death which is well known. However, these are not addressed. These experiments should be done, or at least confirmed using lentiviral infection.

Third, the paper is not well prepared. There is a lack of details both in methods and in legends.

Fourth, many of the experiments do not have appropriate controls.

Fifth, the statistical analyses were not done correctly.

[Editors’ note: what now follows is the decision letter after the authors submitted for further consideration.]

Thank you for resubmitting your work entitled "MiRNA-128 Regulates the Proliferation and Neurogenesis of Neural Precursors by Targeting PCM1 in the Developing cortex" for further consideration at eLife. Your revised article has been favorably evaluated by a Senior editor, a Reviewing editor, and three reviewers. The manuscript has been improved but there are some remaining issues that need to be addressed before acceptance, as outlined below:

Briefly, the reviewers pointed out some misinterpretations, unclear descriptions, and technical shortcomings, and suggested to perform some more experiments to clarify these issues. More importantly, the reviewers raised a concern about the lack of the data from knockout mice, although I am well aware of that you already have in utero electroporation loss-of-function data (semi-in vivo data) in the manuscript. These data may take a while to obtain, but you may already be close to these data or can consider using the Crispr technology to speed up the processes. Inclusion of these data, in addition to the above mentioned revision experiments, would much strengthen the manuscript.

Reviewer #1:

In this revised application, the authors have provided a substantial amount of data. In fact, the authors have provided new data to address all of my concerns, except for one, which is evidence for in vivo targeting of PCM1 by miR-128. However, given the substantial other evidence supporting the regulation of PCM1 by miR-128, I consider this is an optional data at this point. I suggest acceptance for publication.

Reviewer #2:

1) They note that an early expansion of NPC pools by miR-128 knockdown did not result in a net increase in neuronal numbers. That is a curious result and their explanation regarding a critical time window does not seem like an adequate explanation.

2) They did a number of experiments to validate PCM1 as a target miR-128, but they failed to do one of the most important experiments, i.e. show that the "anti-miR" can increase the endogenous protein. They show that miR-128 over expression can reduce the protein, but over-expression experiments are never as strong as the knock down experiment.

3) They need to make clearer how they chose genes for qPCR. Did they look at every gene in their list of predicted targets? Which list? How was the list filtered? How did they settle on PCM1 among all the genes affected by over-expression? Was it the only one also affected by the miR-128 inhibitor? What is the role of the other genes on the list that are potential miR-128 targets?

4) Did PCM1 knock down or over-expression affect spindle orientation?

5) miRNAs generally have small effects-they tend to buffer cells to assure a precision outcome. This paper would lead one to think that miR-128 has effects in development that go far beyond what is likely to be the in vivo role of this miRNA. The system they are analyzing which controls neural precursor numbers and spindle orientation in precursors is likely to be far more complex than what is presented here, and hence the paper seems like a simplification of a much deeper biological question.

Reviewer #3:

The updated version of the manuscript includes new set of data that answer several of my concerns. However, I have additional comments about the manuscript in its present form.

1) One major issue concerns the interpretation of the data obtained in vitro with BrdU incubation. According to their clarified BrdU experiment procedure. I noticed a misinterpretation of the data. Indeed, conversely to its fast clearance from brain tissue in vivo, the BrdU remains pretty stable (for several hours) in the culture medium and it is necessary to replace it after a short time to properly assess a single cohort of cells undergoing S-phase. This is an issue when it comes to monitor cell cycle exit rate of such cohort (Figures 2G2J; 5C). In these bioassays, the cell cycle rate exit is totally biased by the continuous labelling (during 24 hours or so) of proliferative cells undergoing S-phase (which is indeed different between conditions). Same comments stand when assessing S-phase in proliferation assays with 6hours of incubation in BrdU-containing medium.

2) The conclusion about mitotic spindle orientation (lanes 169-17) is incorrect. The Figures 3A-3C indeed show that acute modulation of miR128 expression affect spindle orientation. It is not possible to conclude that default of mitotic spindle orientation leads to impaired APs division (symmetric vs asymmetric). This has been discussed in several recent publications. A clonal analysis would be required to follow the fate of the AP progenies after miR-128 modulation. One complementary set of experiments to decipher the functional impact of mitotic spindle orientation modification would be to focally electroporate APs (with miR-128 or miR-Zip-128) and identify the fate of the progenies 24 hours later (Tbr1 for neuron, Pax6 for APs and Tbr2 for IPs).

[Editors' note: further revisions were requested prior to acceptance, as described below.]

Thank you for submitting your work entitled "MiRNA-128 Regulates the Proliferation and Neurogenesis of Neural Precursors by Targeting PCM1 in the Developing cortex" for consideration by eLife. Your article has been reviewed by two peer reviewers, and the evaluation has been overseen by a Reviewing Editor and a Senior Editor.

The reviewers have discussed the reviews with one another and the Reviewing Editor has drafted this decision to help you prepare a revised submission.

The current version of the manuscript with additional data has significantly improved, compared with the previous version.

However, there is still one remaining point that should be fixed. Like mentioned previously, keeping BrdU in NPC culture (which is more stable than in vivo) to assess proliferation is OK if the authors do not refer to a single cohort of cells that have undergone S-phase (otherwise the authors should have only treated cells for about an hour with BrdU).

Now, concerning the cell cycle exit rate, we usually monitor a single cohort of cell that has exited the cell cycle. It is thus not possible to measure it properly if the BrdU is kept during 24 hours in vitro (stable) because several cohorts of cells will undergo S-phase at different timing, further leading to biased analyses. However, the cell cycle exit is properly addressed in vivo (where clearance of BrdU is fast). I would thus suggest to get rid of the in vitro data that are poorly executed.

eLife. 2016 Feb 17;5:e11324. doi: 10.7554/eLife.11324.039

Author response


[Editors’ note: the author responses to the first round of peer review follow.]

Upon receiving the reviewers’ comments and suggestions, we carefully examined our manuscripts and found that none of the reviewers pointed out lack of novelty in our study or conceptual and experimental flaws. One of the reviewers found our study is rather “interesting” and all reviewers suggested better clarification of methodologies employed and demanded for new data by performing additional experiments. Therefore, to address the concerns raised by reviewers, we have performed the requested additional experiments and revised our manuscript, which now includes extensive new data and clarifications. Our specific, point-by-point responses to the reviewers are listed below:

• We have included new data showing the effect of knocking down miR-128 using an anti- sense short hairpin targeted at miR-128 (miR-ZIP-128) both in vitro NPC culture, and in vivo, following in utero electroporation. We found that loss-of-function in miR-128 has the opposite effect on neurogenesis in vitro (Figure 2D, E, I, J, N, and O) and in vivo (Figure 3A, C, F, G, J, K, N, O, R, S, V, and W).

• We have included new data demonstrating mitotic spindle orientation changes following miR-128 overexpression and knockdown in vivo (Figure 3A, B, and C). We found that miR-128 overexpression increase neurogenesis by enhancing indirect neurogenesis from basal neuronal progenitor cells

• We have repeated the cell proliferation experiments in vivo using EdU to supplement our previous findings with PH3 and Ki67. We obtained in vivo results that were consistent with our previous in vitro results (Figure 3D to G; Figure 3P to S).

• We have included new qPCR data using tissue samples derived from laser capture microdissection of E14.5 mouse brain, showing the levels of miR-128 expression in distinct tissue regions (Figure 4G).

• We have repeated the in vitro NPC experiments with lentivirus-mediated gene delivery of miR-128 and miR-ZIP-128. We demonstrated that, compared to the electroporation method, the transfection efficiency is improved, although the overall effect on neurogenesis remains unchanged.

• We have repeated the miR-128 target gene analysis to increase statistical power. We have included the results in the revised manuscript.

• We have revised the Materials and methods section as requested.

• We have revised the results and discussion sections as requested.

Reviewer #1:

Reviewer #1 recommended to perform additional experiments and to clarify the interpretation of the data as well as experimental procedures. We thank the reviewer for his/her comments and have addressed concerns as follows:

1) The conclusion of the first paragraph is: "qPCR confirmed the observed neural tissue-specific miR-128 expression." But none of the preceding data suggests specificity. For example, "miR-128 was expressed at low levels in the subventricular zone (SVZ) and in the cortical plate (CP) at E14.5…" and "…we performed quantitative real-time PCR (qPCR) and found a similar temporal enrichment of miR-128 in the forebrain, which contains both the SVZ and the CP". Also, "…miR-128 was found to be predominantly expressed in the brain and spinal cord of E14.5 mice…". This does not strike the reviewer as specificity.

The reviewer is correct here. We have edited the main text (Results).

2) The authors claim: "High-magnification images of cortical slices at E14.5 revealed the expression of miR-128 in cells within the SVZ and the CP but not within the intermediate zone (IZ) (Figure 1C)." The enrichment of the labeling looks convincing for the CP but there is no obvious distinction between the SVZ and the IZ.

To address this, we performed laser capture micro-dissection to isolate cells within three brain regions (VZ/SVZ, IZ, CP) and measured the levels of endogenous miR-128 expression using qPCR. We confirmed that endogenous miR-128 is enriched within the CP region, and there is no difference between the VZ/SVZ and IZ (Figure 4G) In addition to confirm miR-128 expression in the VZ/SVZ, we have included new ISH and IHC co-localization data to show that miR-128 is expressed in nestin-positive NPCs within the VZ/SVZ at E14.5 (Figure 1—figure supplement 1). We have edited the main text to reflect these new findings (subsection “miR-128 is expressed in NPCs in the developing murine cortex”).

3) The isolation procedure of NPCs requires more details regarding its efficiency.

We have revised the description of the isolation procedures to include the number of dissected cortices, the number of NPCs following suspension culture, and numbers of NPCs used for electroporation (Materials and methods). We have also included schematic representations to illustrate the in vitro cell proliferation, cell cycle exit and neuronal differentiation experimental procedures (Figure 2A, F, K).

4) The authors state: "The percentage of BrdU-positive but Ki67-negative cells was increased by 350% in NPCs overexpressing miR-128 (Figure 2C, D, arrowheads for BrdU-positive, Ki67-negative cells), indicating that the ectopic expression of miR-128 stimulated NPCs to exit the cell cycle." The conclusion regarding exit from the cell cycle does not follow from the BrdU -positive/Ki67 negative cells.

We agree that the statement in the original manuscript was not clear and we would like to clarify our cell cycle exit assay. First, all NPCs that have undergone S-phase of the cell cycle were labelled with BrdU by pulse labelling the electroporated cells for 24 hours. Then we used Ki67 (labels G1, S, G2 and M-phase) as a negative marker for cells that have exited the cell cycle. In short, NPCs that have exited the cell cycle following S-phase were identified as cells that were positive for GFP and BrdU, but negative for Ki67. Our results showed that the percentage of cells that exited the cell cycle increased 350% in NPCs overexpressing miR-128 compared to miR-mimic (Figure 2G-H). To rule out cell death as a cause we performed both TUNEL assay and antibody staining against cleaved caspase-3 to show that miR-128 did not affect apoptosis (Figure 2—figure supplement 2). Taken together, we concluded that ectopic expression of miR-128 induced cell cycle exit in NPCs.

5) TUNEL is a relatively insensitive way to detect apoptosis and should be complemented by other more conclusive methods.

We agree with the reviewer and would like to clarify that we had already performed immunostaining to analyze cleaved caspase-3, a marker for apoptosis, in our original manuscript (subsection “miR-128 regulates the proliferation and differentiation of NPCs in vitro”, third paragraph) (Figure 2—figure supplement 2).

6) What was the efficiency of the transfection with CMV-promoter-driven expression of the mouse miR-128-1 precursor and EF1α promoter-driven copGFP constructs?

We used a dual-promoter expression construct featuring a CMV-promoter that drives the expression of miR-128 precursor and an EF1α promoter that drives copGFP upon expression of a single plasmid vector. The transfection efficiency for the two elements (miR-128 and copGFP) will always be the same. We have edited the main text (subsection “miR-128 regulates the proliferation and differentiation of NPCs in vitro”) and included graphical representation of the constructs to highlight the dual promoter arrangement (Figure 2—figure supplement 1).

Author response image 1 illustrates the transfection efficiency following electroporation of NPCs in vitro, using aforementioned constructs, which indicate 50% of cells express GFP after 24 hours.

Author response image 1. Transfection efficiency of expression constucts.

Author response image 1.

NPCs were electroporated with the indicated plasmids and the nuclei were counterstained with DAPI. White outlines indicate GFP+ cells and red outlines indicate cells have that borderline expression of GFP and considered GFP-negative. White arrow indicates a GFP-negative cell. Quantification of the ratio of GFP-positive cells over total DAPI counterstained cells show the transfection efficiency to be consistent between the miR-128 overexpression construct and its corresponding control. More than 1500 GFP-positive cells were counted for each condition. At least three sets of independent experiments were performed. The values represent the means ± s.d. (n=3). Student’s t-test, differences were considered significant at ***P<0.001.

DOI: http://dx.doi.org/10.7554/eLife.11324.035

7) The claim of an effect on neuronal differentiation is a good start, but their study requires more detail regarding exactly what the effects are on differentiation and on specific cell types. The paper as it now stands reads like an isolated observation without larger conceptual insights arising from the data presented.

We respectfully disagree with the reviewer. In our manuscript, we present experimental evidence suggesting that miR-128 regulates self-renewal and neuronal differentiation of NPCs by targeting PCM1 during early cortical development in a rigorous manner. We further strengthened this evidence by performing experiments suggested by the reviewers. For example: 1) We have included new qPCR data using tissue samples from laser capture microdissection of E14.5 mouse brain, showing the levels of miR-128 expression in distinct tissue regions; 2) We have included new data showing the effect of knocking down miR-128 using an anti-sense short hairpin targeted at miR-128 both in vitro NPC culture, and in vivo, following in utero electroporation; 3) We have included new data demonstrating spindle orientation changes following miR-128 overexpression and knockdown in vivo. We believe that our findings greatly enhance the understanding of the functional role that miR-128 plays in the homeostasis of neural stem cells through its multiple layers of exquisite control during early cortical development.

Reviewer #2: The development of the cerebral cortex involves a tight coordination of progenitor proliferation, neuron migration and differentiation. The present work analyses the function of miR-128 during cerebral cortex development, which is a microRNA misregulated in autism spectrum disorder. The findings suggest that miR-128 is expressed by cortical progenitors where it controls their proliferation and differentiation by repressing the expression of PCM1, a protein previously described as critical for cell-cycle regulation. Ectopic expression of miR-128 promotes cell cycle exit and neurogenesis in vitro as well as in the cortex in vivo. This phenotype is rescued by PCM1 gain of function and mimicked by its loss expression, suggesting that PCM1 is a downstream target of miR-128 critical for cortical neurogenesis. Thus miR128 may belong to the machinery that coordinate cell cycle exit with neuronal differentiation.

Reviewer #2 suggested clarifying the discrepancy between Franzoni et al. and ours on the role of miR-128 in corticogenesis. In addition, he/she suggested performing additional loss-of-function experiments to support a physiological his/her comments and have addressed the concerns as follows:

1) According to its marked detection in the CP but not in VZ/SVZ, miR-128 has recently been shown to be solely important for late aspects of corticogenesis (migration and differentiation of projection neurons) (Franzoni et al., 2015). The results of the present findings suggest an early function of miR-128 and the reviewer highly recommends clarification of the discrepancy observed between both works.

Although we observed that miR-128 is highly enriched in the CP, suggesting that miR-128 could play a role in late corticogenesis, we respectfully disagree with the reviewer’s view that miR-128 is solely important for late aspects of corticogenesis. The paper by Franzoni et al. provided insufficient evidence to rule out potential involvement of miR-128 during early corticogenesis, as most of their results were obtained upon miR-128 overexpression during late corticogenesis, given that they performed in uteroelectroporation at E15.5, at which early neurogenesis has largely concluded (Franzoni E, Booker SA, Parthasarathy, 2015. Furthermore, they did not perform any analysis on neural progenitor proliferation and renewal, which was not the focus of their study.

In addition, as mentioned in our response to reviewer #1’s comments (see point 2 above) we have included new ISH and IHC co-localization data to show that miR-128 is expressed in nestin positive NPCs within VZ/SVZ at E14.5 using LNA probes (Figure 1—figure supplement 1). Furthermore, Ge et al. demonstrated that PCM1 knockdown in NPCs leads to-1) decreased NPC proliferation, 2) increased cell-cycle exit of NPCs, and 3) overproduction of neurons (Ge et al., 2010), which were in accordance with our miR-128 overexpression data during early cortical neurogenesis. It will be interesting to examine the function of Phf6 as a potential downstream target of miR-128 during early neurogenesis, but we thought this would be out of the scope for our current manuscript. Taken together, we argue that there is little overlap or discrepancy between Franzoni et al. and our results. We have included these points in our revised Discussion (third paragraph).

2) The authors claim that miR-128 is not expressed in the IZ. The low magnification in Figure 1C is not conclusive and doesn't allow the reviewer to take a conclusion. One suitable experiment is qRT-PCR analysis of miR-128 and its corresponding pre-miR128 on laser-captured cortical wall regions.

As mentioned in our response to reviewer #1’s comments (see point 2 above) we performed laser-capture micro-dissection to isolate NPCs from the three regions (VZ/SV, IZ, and CP) and analysed the expression levels of miR-128 using qPCR (Figure 4G). We confirmed that endogenous miR-128 is enriched within the CP region, and there is no difference between the VZ/SVZ and IZ. We have edited the main text to reflect these new findings.

3) The described gain of function phenotypes in vitro (Figure 2) is incomplete and should include more information about the experimental procedures in the text (e.g. length of BrdU pulses for cell cycle exit, timing of cultures, etc.).

As mentioned in our response to reviewer #1’s comments (see point 2 above) we have revised the description of the isolation procedures to include the number of dissected cortices, the number of NPCs following suspension culture, and numbers of NPCs used for electroporation Materials and methods). We have also included schematic representations to illustrate the in vitro cell proliferation, cell cycle exit and neuronal differentiation experimental procedures (Figure 2A, F, K).

4) Additional loss of function experiments (using antagomiRs or sponges against endogenous miR-128) should be done to support a physiological function of miR-128 in NPCs. This remark also stands for in utero (in vivo) experiments.

We agreed with the reviewer and performed the loss-of-function experiment using a construct that expresses anti-sense miR-128 short-hairpin RNAs (miR-Zip-128)(Guibinga et al., 2012). The passages below include excerpts from our updated manuscript (Results), modified to highlight the findings from the miR-128 loss-of-function experiments:

First, expression of miR-Zip-128 in cultured NPCs increased BrdU incorporation, but reduced the number of cells that exit from the cell cycle, which are indicative of a net increase in proliferative capacity of NPCs. Furthermore, miR-Zip-128 expression in NPCs decreased neural differentiation, as measured by Tuj1 staining (Figure 2).

Then, we performed miR-128 loss-of-function experiments in vivoby in uteroelectroporation of miR-Zip-128 at E13.5. First we monitored mitotic spindle orientation in dividing apical progenitors (AP) within the VZ/SVZ and found that miR-128 knockdown led to a significant increase in horizontally dividing cells (Figure 3A-C).

The observation was further supported when we found that miR-128 knockdown cells showed a significant increase in EdU incorporation (Figure 3F, G), a significant increase in Ki67-positive cells (Figure 3—figure supplement 1C, D) and a significantly higher percentage of cells positive for the AP markers PAX6 (Figure 3F, G) and SOX2 (Figure 3—figure supplement 2), indicating an increase in actively proliferating APs in the VZ/SVZ.

Next, we examined whether the significant decrease in obliquely dividing cells following miR-128 knockdown was indicative of an eventual contraction of basal progenitors (BP) by using TBR2 as a marker. miR-128 knockdown led to a significant decrease in the number of TBR2-positive cells (Figure 3N, O). Taken together we concluded that miR-128 knockdown regulates the NPC population by promoting AP proliferation while inhibiting BP generation.

As the BPs are responsible for the bulk of cortico-neurogenesis (Tan and Shi, 2013), we further asked whether miR-128 affects NPC differentiation. First we analysed the change in the number of BPs exiting the cell cycle following miR-128 knockdown. We found that compared to control, miR-128 knockdown cells showed a significant decrease in cells that were GFP- and Edu-positive but Ki67-negative indicating decreased cell cycle exit.

Finally we asked whether the observed changes in cell cycle exit ultimately led to a difference in neurogenesis. We analyzed brains at E17.5, four days after electroporation and neuronal differentiation was assayed by immunostaining with a specific antibody against the neuronal marker NeuN. Intriguingly, miR-128 knockdown significantly decreased the number of NeuN-positive neurons in the CP compared to control (Figure 3V, W).

Taken together, suppression of endogenous miR-128 in early neural precursors impedes their developmental progression by retaining NPCs in a more primitive and proliferative state. Most intriguingly, this early expansion of NPCs did not translate into a net increase in neuronal numbers, suggesting that there is a potential critical time window in which the progenitors must switch to a differentiation state, otherwise, terminally compromising their neurogenic capacity.

5) The monitoring of AP (=RGC) and IP cell populations using Pax6 and Tbr2, respectively is inconclusive. Other markers should be checked (such as Sox2 for AP and Insm1 for IP) to exclude specific marker loss after miR-128 expression rather than progenitor population loss.

We performed additional experiments to monitor SOX2 expression, which was consistent with our previous findings (Figure 3 —figure supplement 2). Although we didn’t monitor IP cell populations, we performed alternative experiments to monitor mitotic spindle orientation in dividing APs within the VZ. In this experiment, we demonstrated that miR-128 expression led to a significant decrease in horizontally dividing cells, which are in accordance with a contraction of the AP cell population, but a significant increase in obliquely dividing cells, which indicated an expansion of the IP cell population (Huttner and Kosodo, 2005; Wang, Lui and Kriegstein, 2011). In addition, expression of miR-Zip-128 resulted in the opposite effect from miR-128 expression. We have included these new findings in our revised manuscript (subsection “miR-128 promotes neuronal differentiation in the developing cortex in vivo”) (Figure 3A-C).

6) The authors claim that overexpression of miR-128 "accelerates" cell cycle exit in vivo, however this is not experimentally demonstrated. In addition, promoting the generation of IPs is not really matching with increase cell cycle exit as these progenitors retain the ability to cycle and generate the bulk of projection neurons. This should be clarified and rephrased in the text.

Regarding the first point mentioned, we agree with the reviewer that our data does not suggest an “acceleration” of cell cycle exit. We have rephrased our conclusion to highlight the final increase in BrdU-positive/Ki67-negative cells after miR-128 overexpression (Figure 3P, Q). In regards to the second point, the increase in cell cycle exit is observed in the basal progenitors or IPs within the IZ. The increased cell cycle exit of IPs is consistent with our other findings that miR-128 overexpression leads to increase neurogenesis in vivo (Figure 3T, U). We have included these points and revised our manuscript accordingly (subsection “miR-128 promotes neuronal differentiation in the developing cortex in vivo”).

7) It is not clear what parameter overexpression of miR-128 is affecting in APs. Is it only promoting the generation of IP or also inducing direct neurogenesis? This should be experimentally addressed. Moreover, these experiments should be complemented by loss of function studies as mentioned above. In its present form, the manuscript does not address any physiological roles of mir-128 in corticogenesis.

As mentioned in our response to the comments above, mitotic spindle orientation of APs in the VZ/SVZ suggests that miR-128 overexpression does not affect direct neurogenesis as reflected by no change in vertically (60-90°) dividing cells (Shitamukai and Matsuzaki, 2012) (Figure 3A, B).

8) While there is no doubt that miR-128 can target PCM1 mRNAs in vitro, the expression of PCM and its targeting by endogenous miR-128 should be assessed in vivo (immunolabelings, etc.). Along this line the results obtained with functional experiments performed in vitro with miR-128 or PCM1 (proliferation and differentiation) should be confirmed in vivo. This is important because cultured NPC are different from resident APs and IPs (gene expression pattern deregulated to some extent).

Regarding the first point, we performed two sets of experiments to determine if PCM1 is an endogenous in vivotarget of miR-128. First, the qPCR analysis showed that temporal expression of miR-128 was gradually increased in the forebrain of the embryo at E12.5, 14.5, 17.5, and P0 (Figure 4—figure supplement 2B). In contrast, PCM1 protein level was found to gradually decrease in the forebrain at these time points (Figure 4—figure supplement 2B). Next, LCM (revealed that miR-128 was highly expressed in the CP zone of the mouse cerebral cortex by qPCR, compared to IZ and SVZ/VZ. Conversely, qPCR analysis showed PCM1 was decreased in the CP zone compared to IZ and SVZ/VZ (Figure 4G, H). These results (as well our bioinformatics and expression analyses of potential targets) suggest that PCM1 can be an in vivotarget of miR-128. We have included these new findings and revised our manuscripts (subsection “PCM1 is a direct target of miR-128 in NPCs”).

In regards to the second point, we agree with the reviewer that cultured NPCs could be different from those neural progenitors in vivo. With that in mind, we have originally designed the experiments to study the functional changes resulting from miR-128 in NPC culture as an in vitromodel, followed by in vivoexperiments using in uteroelectroporation of embryonic brain. To reflect this original intention, we have extensively revised the manuscript by rearranging figures and adding more data.

Reviewer #3: In this manuscript, the authors investigated the function of miR-128 in cortical neural differentiation. They showed that miR-128 enhances neuronal differentiation and represses proliferation of NPCs through PCM1. The results are interesting. However the data are limited and impact is moderate. I have several major concerns.

Reviewer #3 focuses on function of miR-128 in cortical neural differentiation. They showed that miR-128 enhances neuronal differentiation and represses proliferation of NPCs through PCM1. The results are interesting. However the data are limited and impact is moderate. We thank the reviewer for his/her comments and have addressed the concerns raised as follows:

First, the experiments are not complete. For gene or miRNA functional assays, both gain and loss of function assays should be performed, but not. The justification of ASD link is based on a previous study showing that miR-128 is one of 28 microRNAs dysregulated in at least one ASD individuals (for miR-128, the level is decreased in one ASD) (Abu-Elneel Neurogenetics 2008). However, several experiments only show the impact of overexpression of miR-128, not reduction, on NPCs.

We thank the reviewer for the valuable comment. As mentioned in our response to reviewer #2’s comments (see point 4 above) we used a construct that expresses anti-sense miR-128 short hairpin RNAs (miR-Zip-128) and performed miR-128 loss-of-function both in vitroand in vivo. The new findings have been included in the updated manuscript (Results) (Figures 2, 3).

Second, the in vitro NPC assays were done using electroporation which introduces a large amount of genetic materials into the cells. Electroporation also leads to a lot of cell death which is well known. However, these are not addressed. These experiments should be done, or at least confirmed using lentiviral infection.

We thank the reviewer for the valuable comment. We have repeated the in vitro NPC experiments replacing electroporation with lentivirus vectors to deliver the miR-128 overexpression and knockdown constructs. We noted that the efficiency of transfection is improved whereas the overall effect remains unchanged. We have included these points in the updated manuscript (subsection “miR-128 regulates the proliferation and differentiation of NPCs in vitro” and Figure 2 —figure supplement 4).

Third, the paper is not well prepared. There is a lack of details both in methods and in legends.

We thank the reviewer for the valuable comment. We have included further details in the Materials and methods section and revised the figure legends.

Fourth, many of the experiments do not have appropriate controls.

Fifth, the statistical analyses were not done correctly.

We thank the reviewer for the valuable comment. We have made the appropriate changes in the manuscript. As mentioned below we have updated our manuscript and used one-way ANOVA to test our hypotheses where appropriate.

[Editors' note: the author responses to the re-review follow.]

Briefly, the reviewers pointed out some misinterpretations, unclear descriptions, and technical shortcomings, and suggested to perform some more experiments to clarify these issues. More importantly, the reviewers raised a concern about the lack of the data from knockout mice, although I am well aware of that you already have in utero electroporation loss-of-function data (semi-in vivo data) in the manuscript. These data may take a while to obtain, but you may already be close to these data or can consider using the Crispr technology to speed up the processes. Inclusion of these data, in addition to the above mentioned revision experiments, would much strengthen the manuscript. Reviewer #2: 1) They note that an early expansion of NPC pools by miR-128 knockdown did not result in a net increase in neuronal numbers. That is a curious result and their explanation regarding a critical time window does not seem like an adequate explanation.

We agreed with the reviewer that our explanation in the previous manuscript was merely speculation and might not be an adequate explanation for the phenomenon. Therefore, we have made changes in our revised manuscript accordingly (subsection “miR-128 promotes neuronal differentiation in the developing cortex in vivo“, fifth paragraph).

2) They did a number of experiments to validate PCM1 as a target miR-128, but they failed to do one of the most important experiments, i.e. show that the "anti-miR" can increase the endogenous protein. They show that miR-128 over expression can reduce the protein, but over-expression experiments are never as strong as the knock down experiment.

We agree with the reviewer that knock down experiments are crucial for validating the relationship between miR-128 and its proposed target, PCM1. That was the reason why we performed a knock down experiment using anti-miR-128 in primary mouse NPCs and detected change in endogenous PCM1 protein level via western blot analysis in our original manuscript (Figure 4F). Furthermore, we used the luciferase assay to validate the binding specificity of miR-128 with its predicted target, the 3-UTR of the Pcm1 gene. Upon confirmation of the binding, we performed separate experiments to monitor endogenous protein level change in NPCs by using either miR-128 overexpression or knockdown in mouse NPCs (Figure 4D, 4F).

3) They need to make clearer how they chose genes for qPCR. Did they look at every gene in their list of predicted targets? Which list? How was the list filtered? How did they settle on PCM1 among all the genes affected by over-expression? Was it the only one also affected by the miR-128 inhibitor? What is the role of the other genes on the list that are potential miR-128 targets?

We have prepared the diagram below (Author response image 2) to clarify the processes in identifying miR-128 target genes. In addition, we have modified the revised manuscript to better describe rationale of choosing PCM1 as the putative target of miR-128 based on its functional role (subsection “miR-128 promotes neuronal differentiation in the developing cortex in vivo“).

Author response image 2. Schematic diagram outlines rationale of gene selection process.

Author response image 2.

Two widely used in silico microRNA target prediction databases (TargetScan and miRanda)(Mi et al., 2013; Witkos et al., 2011) predicted 800 and 940 potential targets of miR-128, respectively. Among the 77 overlapping targets only 53 were annotated to have known biological function and only 11 out of the 53 genes exhibited consistent reduction in mRNA levels upon miR-128 overexpressionin cultured mouse NPCs and were further tested for reciprocal upregulation when miR-128 was inhibited. Lastly, upon miR-128 inhibition in NPCs, only Pcm1, Nfia, Foxo4, and Fbxl20 were consistently upregulated.

DOI: http://dx.doi.org/10.7554/eLife.11324.036

Briefly, among four candidate targets identified from multiple round of validation, Foxo4, which encodes for an insulin/IGF-1 responsive transcription factor that regulates cell cycles (Furukawa-Hibi et al., 2005; Schmidt et al., 2002), was ruled out because a recent study reported that the loss of FOXO4 reduced the potential of human embryonic stem cells to differentiate into neural lineages(Vilchez et al., 2013), which was opposite from the cellular phenotype of NPCs upon miR-128 overexpression. Nfia and Fbox120 were ruled out, because Nfia protein functions as a transcription and replication factor for adenovirus DNA replication (Qian et al., 1995) and Fbx120 protein is involved in synaptic plasticity, which occurs postnatally (Takagi et al., 2012). Therefore, we sought to focus on PCM1 as our primary gene of interest (Figures 47).

4) Did PCM1 knock down or over-expression affect spindle orientation?

We carried out the spindle orientation assay following PCM1 overexpression using in utero electroporation in E13.5 mice. The result was still similar to that of miR-128 knockdown (original manuscript, Figure 3C). We observed an increase in percentage of horizontally dividing cells and a decrease in percentage of obliquely dividing cells, which is consistent with our previous observations of increased numbers of PAX2-positive cells and decreased numbers of TBR2-positive cells upon PCM1 overexpression (original manuscript, Figure 5—figure supplement 7C-F). We included these data in Figure 5—figure supplement 7B, and described these results in the revised manuscript (subsection “PCM1 regulates the proliferation and differentiation of NPCs”, last paragraph).

5) miRNAs generally have small effects-they tend to buffer cells to assure a precision outcome. This paper would lead one to think that miR-128 has effects in development that go far beyond what is likely to be the in vivo role of this miRNA. The system they are analyzing which controls neural precursor numbers and spindle orientation in precursors is likely to be far more complex than what is presented here, and hence the paper seems like a simplification of a much deeper biological question.

We agree that miRNAs tend to function as fine-tuning modulators of cellular processes(Bartel, 2009; Kawahara et al., 2012; Li and Jin, 2010; Shi et al., 2010). However, there are numerous examples of how miRNAs exert significant functional changes upon perturbation(Franzoni et al., 2015; Peruzzi et al., 2013; Tan et al., 2013). In addition, while we are currently obtaining miR-128-1 and -2 double knockout mice, which were cryopreserved, from our collaborators, we regret that the potential experimental outcome from these mice may be only included in a future study due to time restriction.

Reviewer #3: The updated version of the manuscript includes new set of data that answer several of my concerns. However, I have additional comments about the manuscript in its present form. 1) One major issue concerns the interpretation of the data obtained in vitro with BrdU incubation. According to their clarified BrdU experiment procedure. I noticed a misinterpretation of the data. Indeed, conversely to its fast clearance from brain tissue in vivo, the BrdU remains pretty stable (for several hours) in the culture medium and it is necessary to replace it after a short time to properly assess a single cohort of cells undergoing S-phase. This is an issue when it comes to monitor cell cycle exit rate of such cohort (Figures 2G2J; 5C). In these bioassays, the cell cycle rate exit is totally biased by the continuous labelling (during 24 hours or so) of proliferative cells undergoing S-phase (which is indeed different between conditions). Same comments stand when assessing S-phase in proliferation assays with 6hours of incubation in BrdU-containing medium.

We understand the reviewer’s concern that the length of BrdU exposure may bias our results and interpretation. Therefore, we thoroughly tested various conditions before we used fixed length of BrdU incorporation for different assays (6 hours for the proliferation and 24 hours for the cell cycle exit assays).

First, we tested the incorporation rate of BrdU as well as cell cycle exit rate at multiple time points in native NPCs before electroporation. Given that miR-128 upregulation and downregulation would produce opposing cellular effects, we determined the baseline condition that would be able to clearly demonstrate changes, which was set at around 50% BrdU+/Dapi+ for the cell proliferation assay upon 6 hour after BrdU exposure. We also set the baseline around 50% BrdU+Ki67-/Dapi+ for the cell cycle exit assay which was reached upon 24 hours of BrdU exposure.

Furthermore, we have included additional data at multiple time points from the cell proliferation assay and cell cycle exit assay following electroporation with miR-Zip-128 constructs. We have found that the effects of miR-128 knockdown – increased cell proliferation compared to control and decreased cell cycle exit compared to control – could be observed at most of the time points, indicating that the BrdU exposure lengths used in the original manuscript did not dictate or biasexperimental outcomes. We included this data in Figure 2—figure supplement 6A-D, and described these results in the revised manuscript (subsection “miR-128 regulates the proliferation and differentiation of NPCs in vitro”, last paragraph).

2) The conclusion about mitotic spindle orientation (lanes 169-17) is incorrect. The Figures 3A-3C indeed show that acute modulation of miR128 expression affect spindle orientation. It is not possible to conclude that default of mitotic spindle orientation leads to impaired APs division (symmetric vs asymmetric). This has been discussed in several recent publications. A clonal analysis would be required to follow the fate of the AP progenies after miR-128 modulation. One complementary set of experiments to decipher the functional impact of mitotic spindle orientation modification would be to focally electroporate APs (with miR-128 or miR-Zip-128) and identify the fate of the progenies 24 hours later (Tbr1 for neuron, Pax6 for APs and Tbr2 for IPs).

We agree with the reviewer that one cannot conclude the fate of AP progeny solely based on changes in mitotic spindle orientation alone and that is precisely the reason why we had followed up the spindle orientation findings with experiments to identify the fate of AP progenies. In our original manuscript, we found that miR-128 manipulation affected the balance between AP (PAX6 and SOX2 positive cells) and IP (TBR2 positive cells) generation (Figure 3H-O).

We also acknowledge that recent studies have found that spindle orientation might not be the only mechanism responsible for fate determination in APs (Konno et al., 2008; Noctor et al., 2008; Peyre and Morin, 2012) and did not exclude the involvement of other potential mechanisms. We added these points in our revised manuscript (subsection “miR-128 promotes neuronal differentiation in the developing cortex in vivo”).

For the proposed clonal analysis, given that more than 85% of electroporated, GFP+ APs could be labelled with EdU upon 24 hours of exposure (data not shown), we could use GFP signal as a surrogate marker for EdU, that made EdU or BrdU incorporation assay redundant, when we perform analysis using PAX2 and TBR2 immunostaining. In addition, when APs were labelled with EdU for 24 hours immediately following electroporation for traditional clonal analysis, we observed that the knockdown of miR-128 increases Pax6-positive cells, but decreases Tbr2-positive cells in the EdU-positive cell population (Author response image 3A-C) in a manner that follows very closely with our previous findings in our first manuscript (original manuscript Figure 3K, O). Taken together, the APs focally electroporated with miR-128 knockdown constructs increased APs, but decreased BPs.

Author response image 3. Clonal analysis reveals the fate of progeny derived from electroporated progenitor cells.

Author response image 3.

In utero electroporation was performed on E13.5 embryos to introduce either miR-128-ZIP or a control construct into NPCs lining the ependymal layer. Ependymal NPCs were further labeled with EdU immediately following electroporation. (A-C) At E14.5, tissue sections were acquired for EdU detection and immunostained with antibodies against PAX6 (A) and TBR2 (not shown). (B) Quantification of PAX6- EdU- GFP-triple-positive cells over EdU- GFP-double-positive cells shows significant increase of Pax6 positive cells in progeny from miR-128-ZIP electroporated NPCs compared to control. (C) Quantification of TBR2- EdU- GFP-triple-positive cells over EdU- GFP-double-positive cells shows significant decrease of TBR2-positive cells in progeny from miR-128-ZIP electroporated NPCs compared to control. (D) Tissue sections acquired at E14.5, and processed for EdU detection and immunostained with antibodies against TBR1revealed minimal overlap between EdU-positive cells and TBR1-positive cells. In (A), circles show GFP- EdU-double-positive cells, blue circles show PAX6-negative cells among GFP-EdU- double-positive cells. Scale bar, 10 um. (D) Scale bar, 100 um. More than 500 GFP-positive cells were counted for each condition. At least three sets of independent experiments were performed. The values represent the means ± s.d. (n=3). Student’s t-test, differences were considered significant at ***P<0.001.

DOI: http://dx.doi.org/10.7554/eLife.11324.037

However, we failed to observe cells that were double positive for both Tbr1 and EdU24 hours after EdU labelling (Author response image 3D), indicating there was negligible direct neurogenesis from the electroporated APs.

[Editors' note: further revisions were requested prior to acceptance, as described below.]

The current version of the manuscript with additional data has significantly improved, compared with the previous version.

However, there is still one remaining point that should be fixed. Like mentioned previously, keeping BrdU in NPC culture (which is more stable than in vivo) to assess proliferation is OK if the authors do not refer to a single cohort of cells that have undergone S-phase (otherwise the authors should have only treated cells for about an hour with BrdU).

Now, concerning the cell cycle exit rate, we usually monitor a single cohort of cell that has exited the cell cycle. It is thus not possible to measure it properly if the BrdU is kept during 24 hours in vitro (stable) because several cohorts of cells will undergo S-phase at different timing, further leading to biased analyses. However, the cell cycle exit is properly addressed in vivo (where clearance of BrdU is fast). I would thus suggest to get rid of the in vitro data that are poorly executed.

We agree with the reviewers and have made corrections in the revised manuscript. First, we have added statements (subsection “miR-128 regulates the proliferation and differentiation of NPCs in vitro”) to clarify that our in vitro proliferation assay was done without synchronizing the cell cycle of the NPCs and thus the change in proliferation rate may not represent that of a single cohort, but rather of a heterogeneous group from all phases of the cell cycle (Bez et al., 2003). In addition, as suggested by the reviewers, we have removed the in vitro cell cycle exit data from the manuscript.

Associated Data

    This section collects any data citations, data availability statements, or supplementary materials included in this article.

    Supplementary Materials

    Figure 4—source data 1. Gene Ontology (GO) of the miR-128 target gene list.

    53 genes with annotated GO terms which were predicted as targets of miR-128 by both TargetScan and miRanda algorithms, were listed. The genes were sorted in alphabetical order. GO information was obtained from the PANTHER website (http://www.pantherdb.org).

    DOI: http://dx.doi.org/10.7554/eLife.11324.017

    DOI: 10.7554/eLife.11324.017
    Figure 4—source data 2. Relative expression of 53 predicted miR-128 targets upon overexpression of miR-128 in NPCs.

    Cultured NPCs were transfected with either miR-128 or miR-mimic control for 48 hr and were harvested for qPCR analysis. 11 genes (Pcm1, Lmbr1l, Foxo4, Sh2d3c, Nfia, Pde8b, Sec24a, Pde3a, Fbxl20, Ypel3 and Kcnk10) showed consistent and significant reduction in mRNA levels upon miR-128 expression in NPCs (highlighted in yellow). At least three sets of independent experiments were performed. The values represent the mean ± s.d. (n = 3).

    DOI: http://dx.doi.org/10.7554/eLife.11324.018

    DOI: 10.7554/eLife.11324.018
    Figure 4—source data 3. Relative expression of miR-128 targets upon downregulation of miR-128 in NPCs using miR-Zip-128.

    NPC primary cultures were transfected with either miR-Zip-128 or miR-Zip scramble control, and mRNAs of 11 target genes were measured via qPCR analysis. Only PCM1 was significantly upregulated upon anti-miR-128 expression in NPCs. At least three sets of independent experiments were performed. The values represent the mean ± s.d. (n = 3).

    DOI: http://dx.doi.org/10.7554/eLife.11324.019

    DOI: 10.7554/eLife.11324.019
    Figure 4—source data 4. List of qPCR primers.

    DOI: http://dx.doi.org/10.7554/eLife.11324.020

    DOI: 10.7554/eLife.11324.020

    Articles from eLife are provided here courtesy of eLife Sciences Publications, Ltd

    RESOURCES