. 2016 Feb 2;5:e10747. doi: 10.7554/eLife.10747

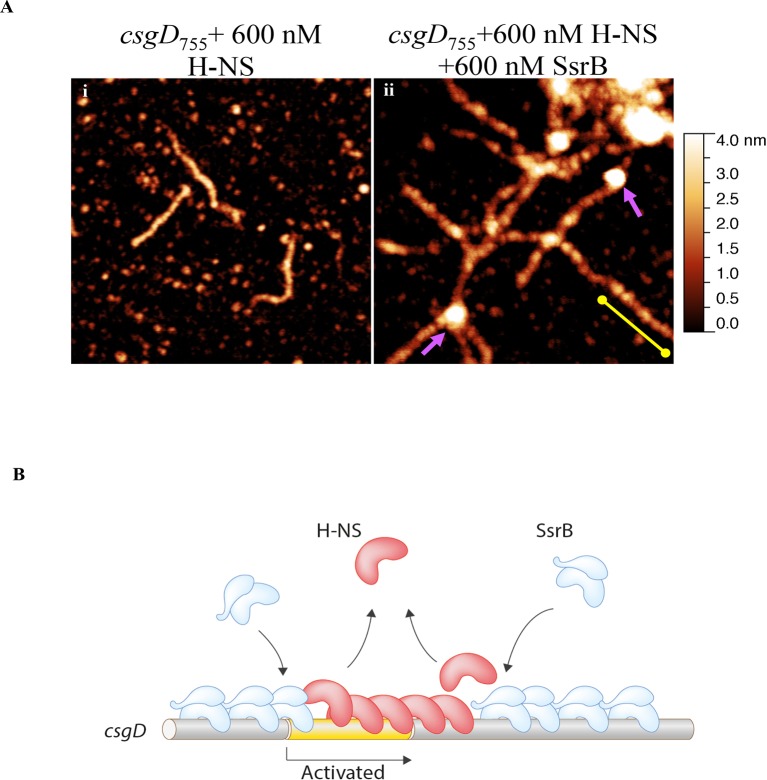
Figure 6. SsrB condenses H-NS bound csgD DNA.

(A) (i) AFM imaging in the presence of 600 nM H-NS shows a straight and rigid filament on csgD755. (ii) Addition of 600 nM SsrB to the H-NS bound csgD DNA resulted in areas of condensation (pink arrows; an ‘SsrB signature’) along with a few areas where the straight H-NS bound conformation persisted (yellow line; an ‘H-NS signature’); Scale bar = 200 nm as in Figure 5A. (B) A model for the mechanism of anti-silencing by SsrB at csgD wherein SsrB likely displaces H-NS from the ends of a stiffened nucleoprotein filament and relieves the blockade on the promoter for RNA polymerase to activate transcription. For details refer to (Winardhi et al., 2015).

DOI: http://dx.doi.org/10.7554/eLife.10747.024

Figure 6.

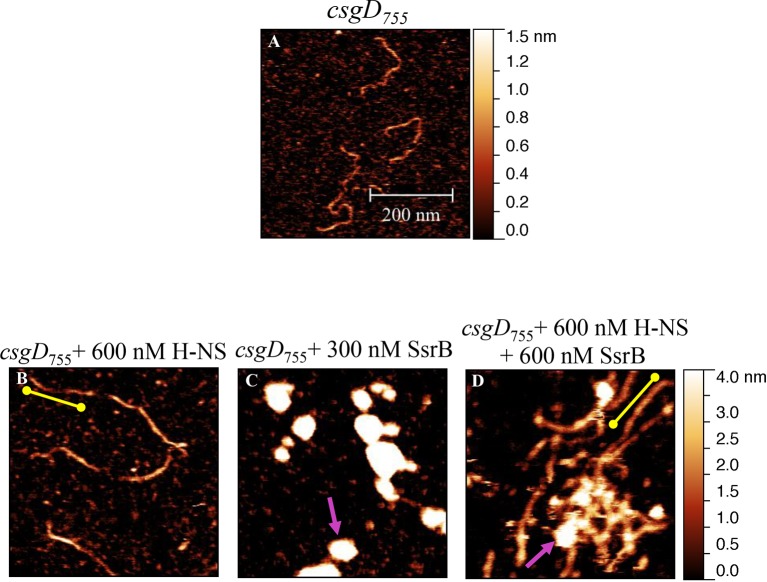
Figure 6—figure supplement 1. Liquid AFM imaging of (A) the 755 bp csgD regulatory region.

Figure 6—figure supplement 1.

(B) In the presence of 600 nM H-NS, a straight and rigid filament was observed (yellow line). (C) In the presence of 300 nM SsrB, areas of condensation were evident (pink arrow). (D) Addition of 600 nM SsrB to the H-NS bound csgD DNA resulted in areas of condensation (pink arrows; an ‘SsrB signature’) along with a few areas where the straight H-NS bound conformation persisted (yellow line; an ‘H-NS signature’); Scale bar = 200 nm.
Figure 6—figure supplement 2. SsrB D56A and SsrBc condense H-NS-bound csgD DNA.
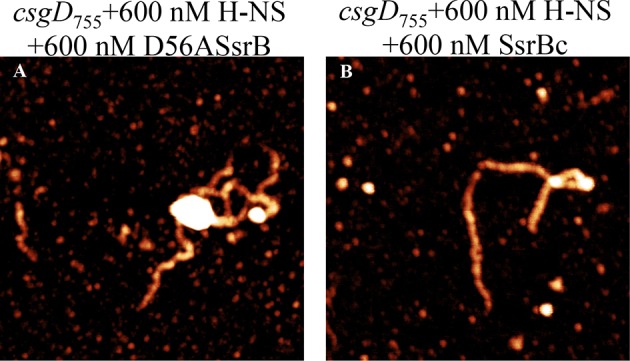
Figure 6—figure supplement 2.

AFM imaging in the presence of H-NS shows areas of condensation upon addition of (A) 600 nM D56ASsrB and (B) 600 nM SsrBc; Scale bar = 200 nm as in Figure 5A.
Figure 6—figure supplement 3. SsrB and H-NS form a complex on csgD.
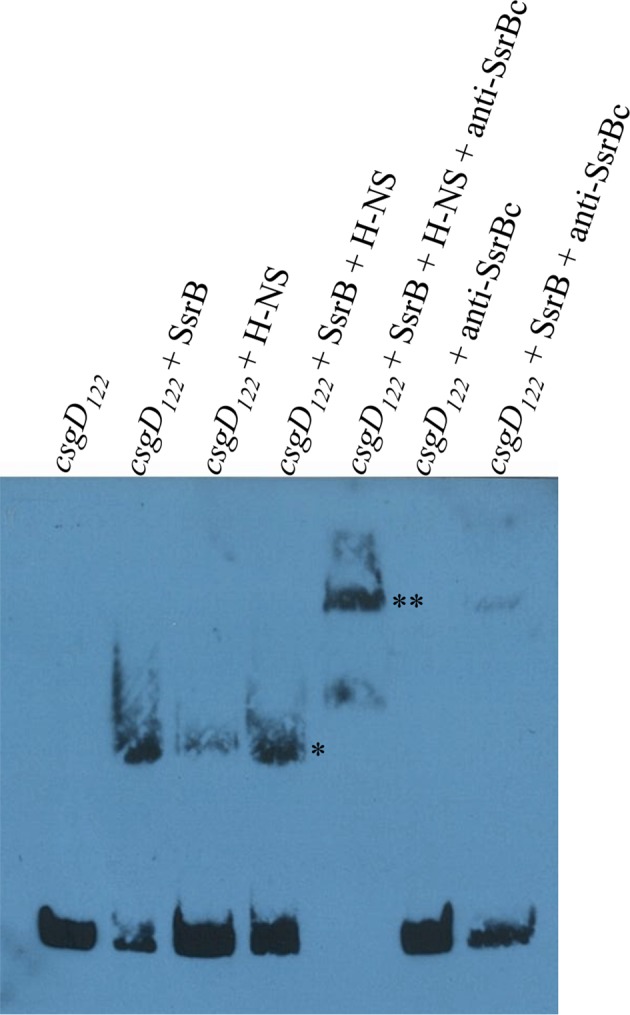
Figure 6—figure supplement 3.

Electrophoretic mobility shift assay with the 122 bp csgD regulatory region, csgD122 (left to right); in the presence of SsrB and H-NS, the DNA-protein complex (*) is super-shifted in the presence of anti-SsrBc serum (**). A DNA-protein complex is also observed when SsrB and H-NS were present alone. Note the absence of any complex in a control reaction with csgD122 and anti-SsrBc, while anti-SsrBc recognizes the SsrB-csgD122 complex.
Figure 6—figure supplement 4. The sequence of the 755 bp csgD regulatory region indicating the H-NS binding region according to Gerstel et al. (2003); and the SsrB binding motif as found by Feng et al. (2004).

Figure 6—figure supplement 4.