

Abstract
Objectives
The prevalence of Huntington's disease (HD) recorded in the UK primary care records has increased twofold between 1990 and 2010. This investigation was undertaken to assess whether this might be due to an increased incidence. We have also undertaken a systematic review of published estimates of the incidence of HD.
Setting
Incident patients with a new diagnosis of HD were identified from the primary care records of the Clinical Practice Research Datalink (CPRD). The systematic review included all published estimates of the incidence of HD in defined populations.
Participants
A total of 393 incident cases of HD were identified from the CPRD database between 1990 and 2010 from a total population of 9 282 126 persons.
Primary and secondary outcome measures
The incidence of HD per million person-years was estimated. From the systematic review, the extent of heterogeneity of published estimates of the incidence of HD was examined using the I2 statistic.
Results
The data showed that the incidence of HD has remained constant between 1990 and 2010 with an overall rate of 7.2 (95% CI 6.5 to 7.9) per million person-years. The systematic review identified 14 independent estimates of incidence with substantial heterogeneity and consistently lower rates reported in studies from East Asia compared with those from Australia, North America and some—though not all—those from Europe. Differences in incidence estimates did not appear to be explained solely by differences in case ascertainment or diagnostic methods.
Conclusions
The rise in the prevalence of diagnosed HD in the UK, between 1990 and 2010, cannot be attributed to an increase in incidence. Globally, estimates of the incidence of HD show evidence of substantial heterogeneity with consistently lower rates in East Asia and parts of Europe. Modifiers may play an important role in determining the vulnerability of different populations to expansions of the HD allele.
Keywords: EPIDEMIOLOGY, GENETICS
Strengths and limitations of this study.
The study provides the most reliable estimates of the incidence of Huntington's disease (HD), in the UK, between 1990 and 2010.
The study also provides a comprehensive and contemporary review of the published incidence of HD globally.
The study of the incidence of HD in the UK relies on new diagnoses of HD being reported in primary care records.
The systematic review does not attempt a quantitative assessment of the quality of the included studies.
Huntington's disease (HD) is an autosomal-dominant neurological disorder.1 2 Located on chromosome 4p16.3, the normal form of the gene contains up to 38 trinucleotide repeats. The abnormal form of the gene has from 40 to 125 trinucleotide repeats.3 The HD gene codes for a protein called huntintin. The abnormal form of the gene codes for a toxic protein. The gene can expand during transmission, possibly leading to different rates of incidence and prevalence in different populations.
HD usually presents in early to middle life with abnormal movements including chorea, dystonia and rigidity.1 2 Patients may also suffer severe psychiatric complications including hallucinations, delusions, obsessive-compulsive disorder, depression and bipolar disorder.2 They contend with progressive cognitive loss.1 2 It is uniformly fatal over a 10–20-year decline. Aspiration pneumonia and suicide are common causes of death.2
A previous study by us has shown4 that the prevalence of HD, as diagnosed and recorded in primary care records, has increased from 5.4 (95% CI 3.8 to 7.5) per 100 000 in 1990 to 12.3 (95% CI 11.2 to 13.5) per 100 000 in 2010. In order to explore the basis for this unexpected finding, we have undertaken a study of the incidence of HD in the UK over the same time period.
To place our own findings in context we have also undertaken a systematic review of published estimates of the incidence of HD. A previous systematic review of the incidence (as well as prevalence) of HD was published in 20125 and identified eight studies. That review only included studies carried out between 1985 and 2010 on the grounds that before 1985 MRI was not routinely in clinical use. Since the diagnosis of symptomatic (manifest) HD is essentially a clinical one, and not dependent on imaging, the present review attempted to identify all published estimates of the incidence of HD published between 1950 and 2014. We sought to examine the heterogeneity between these estimates and, in particular, the extent to which any observed differences between populations might be explained by methods used for case finding and diagnosis.
Methods
UK population-based estimates of the incidence of HD
Study design and setting
The Clinical Practice Research Datalink (CPRD), formerly the General Practice Research Database (GPRD), is a computerised database of anonymised longitudinal medical records from primary care that has been collected for over 25 years. The CPRD is assembled from the electronic health records of patients registered with around 625 contributing general practices and with over 5 million patients currently enrolled (representing approximately 8% of the UK population). The practices are broadly representative of those in the UK in geographical distribution, practice size, age and sex as well as ethnicity and body mass index of registered patients.6 Each individual patient is assigned a unique identification number. No information from their medical records, allowing identification of individual patients, is included in the database. The data are therefore entirely anonymous to investigators. It is also important to appreciate, for the benefit of those unfamiliar with the UK's National Health Service, that patients requiring specialist services must be referred by their general practitioner (GP). The referring GP will invariably be informed of the results of all investigations and the diagnosis.
CPRD includes the complete diagnostic and prescribing information for each registered patient. When patients newly register with a contributing practice, major past and existing diagnoses are recorded in their medical records and are included in the research database. However, the dates of onset and of past diagnoses are not always accurately recorded. In particular, some diagnoses that occurred in the past may be recorded without a date or as occurring at, or shortly after, the date of registration.
Morbidity in UK primary care is recorded using Read codes Clinical Terms V.3.7 At both practice and individual patient levels, the data are subject to a range of quality checks prior to being made available for research purposes.8 The quality of the data has been found to be high in a large number of independent validation studies.9
The potential funders of the study played no part in its design, analysis or interpretation.
Participants and variables
The source population was all patients aged 21 years or more who were registered with general practices contributing to the CPRD between 1990 and 2010. The age of 21 was used to distinguish adult form of HD from the very rare juvenile form of the condition.1 2 Eligible cases were defined as persons with one or more recorded diagnoses of HD or Huntington's chorea in their medical records. The Read codes used to identify cases of HD were F134.00 (Huntington's chorea) and Eu02200 (dementia in HD).
For each general practice record, the observation period for the study began as the later of two dates: either the study start date (1 January 1990) or the date at which the practice started contributing research standard data to the CPRD. The end of the observation period was the earlier of two dates: the last date for which the practice contributed data to the CPRD, or the study end date (31 December 2010). Individual patients were included in denominators only during times within the observation period that they were registered with a practice contributing data to the GPRD and were aged at least 21 years.
Incident patients were defined as all those with a first record of an HD diagnostic code, during the observation period, but with two additional criteria. (1) The patients’ first recorded HD diagnosis was required to have occurred at least 12 months after their first entry in the database. In other words, at least 12 months were required to have elapsed since their registration date. (2) Patients’ were required to have at least two recorded contacts with their contributing practice prior to their HD diagnosis. These additional criteria helped avoid including prevalent cases as if they were incident ones.
Statistical methods
Incidence was calculated from the ratio of number of persons with a new recorded diagnosis of HD for each year from 1990 to 2010, divided by the total number of persons in the database for that year, who had also had at least 1 year in the database and were aged at least 21 years. Binomial CIs were calculated. In estimating the incidence in age bands, annual incidence estimates were averaged and approximate (binomial) 95% CIs calculated. All incidence rates are expressed per million person-years.
Systematic review of studies of the incidence of HD
The criteria for inclusion in the systematic review were that a study should be based on a defined population and that it should provide information about the number of new HD diagnoses made within one or more specific time frames. No study was excluded by virtue of its date, the ages studied, or because of the approach taken to either case ascertainment or the diagnosis of HD. The search dates covered the period January 1950 to December 2013. There were no language restrictions.
Relevant publications were sought as follows:
Search of MEDLINE and EMBASE (see web extra annex 1). Studies fulfilling the inclusion criteria, but published only as abstracts, were considered for inclusion.
Scrutiny of the references quoted in reviews of the epidemiology of HD.10–17
Examination of the reference lists in publications meeting the inclusion criteria.
After the removal of duplicates, the full texts of the remaining articles were examined. The relevant details of those meeting the inclusion criteria were transcribed independently (by ARW and MDR) and entered into data extraction forms. Disagreements due to minor transcription errors were resolved by consensus. The data extraction forms recorded:
The full reference;
The geographical location and year(s) of the study;
The relevant population size;
The number of patient-years used in the estimation(s) of incidence;
The method(s) of case ascertainment;
The method(s) of diagnosis;
The number of new patients with HD during the year(s) of study;
The mean age at diagnosis, where provided, of patients with HD together with the age range or the 95% CIs;
The estimate(s) of incidence with (if calculated) their 95% CIs.
bmjopen-2015-009070supp.pdf (255KB, pdf)
In some instances, where numerical data were lacking, the number of patient-years was estimated by back extrapolation. Where no 95% CIs were provided, these were calculated from the available data. Reporting follows, where appropriate, the PRISMA guidelines.18
Statistical methods
Incidence rates and their 95% CIs were recalculated from the original reports from the number of new HD diagnoses divided by the number of person-years. In some instances, where either the number of cases or the number of person-years was not quoted, these were estimated by back extrapolation. The degree of heterogeneity was estimated from the I2 test.19
Results
The incidence of adult HD in the UK
A total of 393 incident cases of HD were identified from the CPRD database between 1990 and 2010 from a total population of 9 282 126 persons (corresponding to 54 907 468 person-years). The incidence rates, in 5–6-year bands (table 1), showed no significant changes between 1990 and 2010. The apparent fluctuations between 1990 and 1994 (see web extra annex 2) are likely to be due to sampling error as both the number of incident cases, and the denominators, were relatively small during these years. The average incidence rate of HD, during the entire period, was 7.2 (95% CI 6.5 to 7.9) per million patient-years. Rates for females (7.1, 95% CI 6.1 to 8.10) and males (7.3, 95% CI 6.3 to 8.4) were similar.
Table 1.
Average incidence rates and age of onset of HD 1990–2010
| Years | Incident cases | Denominators (patient years) | Incidence per million patient years (95% CIs) | Mean age of onset in years (SD and IQR) |
|---|---|---|---|---|
| 1990–1996 | 56 | 6 778 613 | 8.26 (6.24 to 10.73) | 51.5 (13.9 40 to 61) |
| 1997–2003 | 138 | 18 533 173 | 7.45 (6.26 to 8.80) | 53.1 (13.7 44 to 64) |
| 2004–2010 | 199 | 29 522 583 | 6.7 (5.84 to 7.75) | 52.1 (16.4 40 to 65) |
HD, Huntington's disease.
The mean age at diagnosis was 52.4 years (SD 15.1; IQR 42–64 years; see figure 1). It was almost identical in females (mean 52.4; SD 15.2; IQR 42–64 years) and males (52.4; SD 15.1; IQR 41–64 years). The ages of onset are shown in table 1 and do not show any significant change over the period of the study. The average annual incidence rates in relation to the age of onset are shown in table 2.
Figure 1.
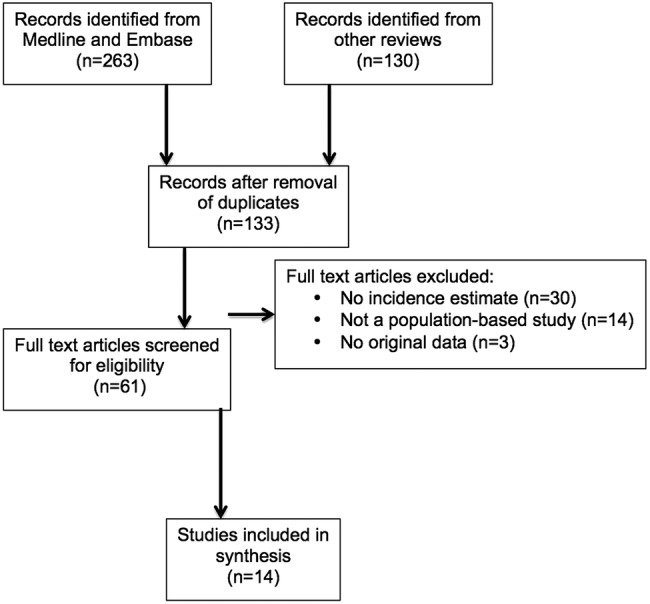
Flow diagram of search strategy.
Table 2.
Incidence and age of onset
| Incidence per million patient years (95% CIs) |
|||
|---|---|---|---|
| Age of onset (years) | 1990–1996 | 1997–2003 | 2004–2010 |
| <40 | 7.9 (4.4 to 13.1) | 5.6 (3.7 to 8.1) | 6.6 (4.9 to 8.7) |
| 40–49 | 13.2 (7.0 to 22.6) | 11.8 (8.0 to 16.8) | 10.8 (8.0 to 14.3) |
| 50–59 | 14.8 (7.6, 25.8) | 13.1 (9.0 to 18.4) | 7.2 (4.8 to 10.4) |
| >60 | 10.0 (5.7 to 16.2) | 10.7 (7.8 to 14.3) | 10.3 (8.1 to 13.0) |
Systematic review of the incidence of HD
The numbers of studies initially identified, screened, subjected to full-text review and included in the final synthesis are shown schematically in figure 1. Additional details of the included and excluded in studies are available in the web extra tables 2–5. We identified 14 published studies (figure 1) which, together with the results of the present study, provided 15 investigations into the incidence of HD for inclusion in our systematic review (table 3).
Table 3.
Incidence studies from the systematic review
| Study ID | Location | Study year(s) | Incident cases | Patient-years | Incidence per 1 000 000 person-years (95% CIs) | Age of onset | Comments |
|---|---|---|---|---|---|---|---|
| Eastern Asia | |||||||
| Chen 196820 | Guam | 1960–1966 | 0 | 265 825 | 0.00 (0 to 13.9) | Not stated | |
| Chang 199423 | Hong Kong, China | 1984–1991 | 20 | 43 520 000 | 0.46 (0.28 to 0.71)* | 37.6 (range 20–52) | |
| Chen 201024 | Taiwan | 2000–2007 | 165 | 15 900 000 | 1.04 (0.89 to 1.21) | Not stated | Average incidence between 2000 and 2007 |
| Australasia | |||||||
| McCusker 200031 | NSW, Australia | 1991 and 1996 | 1991=26 1996=39 |
1991=5 732 031 1996=6 038 969 |
1991=4.5 (3.0 to 6.7) 1996=6.5 (4.6 to 8.8) |
47.9 (SD 13.7) |
|
| Europe | |||||||
| Palo 198725 | Finland | 1980s | 2† | 4 900 000 | 0.2 to 0.4 (0.02 to 1.3)* | Not stated | |
| Govoni 198827 | Ferrara, Italy | 1971–1987 | 14 | 6 032 096‡ | 1.1 (0.4 to 2.3) | Not stated | |
| Ramos-Arroyo 200530 | Navara and Basque, Spain | 1994–2002 | 111 | 21 165 000 | 4.7 (4.5 to 6.3)* | 43.7 (SD 15) |
|
| Mercy 200821 | Cambridge UK | 2000–2006 | 9 | 453 600 | 8.0 (2.0 to 23) | Not stated | Restricted age range (45–64 years) |
| Panas 201129 | Greece | 1995–2008 | 48† | 10 964 020 | 4.38 (3.23 to 5.50) | 44.0 (SD 12.9) | |
| Sackley 201128 | UK | 2004–2008 | 85 | 14 713 708 | 5.71 (4.45 to 7.07) | 48.3 (SD14.) | Average incidence between 2004 and 2008 |
| Sveinsson 201226 | Iceland | 1988–2007 | 8 | 5 714 285‡ | 1.4 (0.6 to 2.8)* | 51 (range 28–68) | |
| Douglas 201322 | UK | 1990–2010 | 12 | 17 142 857 | 0.70 (0.36 to 1.22) | Median=15 (range 5–20) | Restricted to juvenile HD |
| Current study | UK | 1990–2010 | 393 | 54 907 468 | 7.2 (6.5 to 7.9) | 52 years (SD 16) | Also includes annual incidence rates1990–2010 |
| North America | |||||||
| Kokman 199432 | Minnesota, USA | 1950–1989 | 10 | 4 134 000‡ | Definite=3.0 (1.0 to 5.0) Definite+probability=5.0 (3.0 to 9.0) |
Not stated | . |
| Almqvist 200133 | British Columbia, Canada | 1996–1999 | 110 | 16 058 394‡ | 6.9 (5.7 to 8.3)* | 46.9 (SD 13.7) | Author states population is ‘approximate’ |
*95% CIs not included in the published report but estimated for this review.
†Numbers of patients with HD calculated by back extrapolation.
‡Patient-years calculated by back extrapolation.
HD, Huntington's disease; NSW, New South Wales.
Estimates of the incidence of HD (table 3) ranged from 0 (95% CI 0 to 97.0)20 to 8.0 (95% CI 2.0 to 23) per million person-years,21 although the latter study was conducted among a restricted age range (45–64 years). It is clear from this table that there is marked heterogeneity (I2=98.5%, 95% CI 98.2% to 98.6%) across studies, even after the omission of the two age-specific estimates.21 22 Lower estimates of incidence were consistently reported for studies conducted in the East Asia region including Guam,20 Hong Kong23 and Taiwan24 compared with most of those undertaken in Europe, North America and Australia. There is, though, heterogeneity between European estimates of incidence. Studies conducted in Finland,25 Iceland26 and the Ferrara region of Italy27 show incidence estimates of around one per million person-years or less. Other studies carried out in UK,21 28 as well as the results reported here, suggest incidence rates of around 7–8 per million patient years (table 4). Estimates undertaken in Greece,29 the Basque region of Spain,30 Australia31 and North America32 33 are comparable to those in the UK including the present study. The low incidence of the juvenile form of HD,22 in the UK, is to be expected in the light of the known low prevalence of this very rare form of HD.
Table 4.
Sources of cases and diagnostic criteria used in the included studies
| Study ID | Location | Source of cases | Diagnostic criteria |
|---|---|---|---|
| Asia | |||
| Chen 196820 | Guam | Records of patients attending the Guam Memorial Hospital | Not stated |
| Chang 199423 | Hong Kong, China | Computer search of all major hospitals. Announcement in Hong Kong Medical Association Newsletter asking for information about known or suspected cases. Enquiry of all neurologists and psychiatrists in Hong Kong | All patients examined by a neurologist plus a psychiatrist. Diagnosis based on positive family history plus insidious progressive disorder with chorea, cognitive impairment and often psychiatric disturbance. Positive CT scan with caudate atrophy considered to be ‘supportive’ of an HD diagnosis |
| Chen 201024 | Taiwan | Outpatient and inpatient claims from the National Health Insurance Research Database | Search of National Health Insurance Research Database for ICD-9 code 333.4 |
| Australasia | |||
| McCusker 200031 | NSW, Australia | Records of the NSW HD Service. Records of the major general and chronic psychiatric hospitals in NSW. Questionnaires to adult and paediatric neurologists, psychiatrists, genetic counsellors and clinical geneticists | Definite: chorea or ataxia with a positive family history or expanded CAG repeat |
| Europe | |||
| Palo 198725 | Finland | Systematic search of all university, central, general and central psychiatric hospitals | Not stated |
| Govoni 198827 | Ferrara, Italy | Records of the neurology clinics of Ferrera and Bologna, civil records, records of the psychiatric institutions, records of public and private geriatric nursing homes | Combination of a positive family history, choreiform movements, mental deterioration |
| Ramos-Arroyo 200530 | Navara and Basque, Spain | Referrals to the Medical Genetics Laboratory of the Hospital Virgen del Camino, Pamplona, Spain, for diagnostic testing for HD between 1993 and 2002. Also searched for additional patients from the Basque country who might have been referred to other HD diagnostic genetic centres in Spain. In addition, patients who underwent presymptomatic testing and became symptomatic within the study period were also included | Definite=typical clinical features plus <36 CAG repeats plus positive family history Suspect=without positive family history |
| Mercy 200821 | Cambridge UK | Attendees/referrals to Addenbrooks’ Hospital memory/early dementia clinic | UHDRS >5 |
| Panas 201129 | Greece | Records of the Laboratory of Neurogenetics, Athens (the only neurogenetics lab in Greece) | Neurological examination including the UHDRS plus CAG repeat length in a subset of patients |
| Sackley 201128 | UK | Using THIN primary care research database the authors identified Read codes for HD | Based on recorded diagnosis |
| Sveinsson 201226 | Iceland | Medical records and hospital discharge diagnoses of all hospitals including records of neurological, psychiatric and genetic departments. Information from practising neurologists and selected GPs. Information from family members | Hyperkinetic movement disorder plus psychiatric symptoms plus progressive cognitive decline plus a positive family history or positive DNA analysis |
| Douglas 201322 | UK | Primary care National Health Service electronic health records | As recorded in patients’ electronic health records (Read codes F134.00 and Eu2200) |
| Current study | UK | Primary care National Health Service electronic health records | As recorded in patients’ electronic health records (Read codes F134.00 and Eu2200) |
| North America | |||
| Kokman 199432 | Minnesota, USA | Scrutiny of records of hospitals, nursing homes, private practitioners, state psychiatric hospital | Definite HD=documented record of progressive choreiform movement disorder; evidence of autosomal dominant inheritance; progressive cognitive, behavioural, and/or emotional dysfunction. Probable HD=2 out of 3 of the above criteria |
| Almqvist 200133 | British Columbia, Canada | Patients referred to Medical Genetics Laboratory/HD clinic | Patients with signs and symptoms compatible with HD and with CAG repeat lengths >36 |
HD, Huntington's disease; GP, general practitioner; ICD, International Classification of Diseases; NSW, New South Wales; THIN, The Health Improvement Network; UHDRS, United Huntington's Disease Rating Scale.
The approaches used in case ascertainment, and the criteria for accepting a diagnosis of HD among the included studies, are shown in table 4. A variety of methods were used in identifying patients with HD and, to a lesser extent, in the diagnostic criteria each study adopted. However, this variability is inadequate to explain the marked differences in the heterogeneity of incidence worldwide.
Discussion
UK estimate of incidence
The absence of any consistent change in the incidence of HD in the UK, between 1990 and 2010, is in marked contrast to the substantial increase in the prevalence of HD over the same period. Evans et al4 offered a number of possible explanations for the apparent rise in prevalence. These included (1) an increase in incidence; (2) an increase in the diagnosis of HD as a result of the availability of a genetic test permitting physicians to diagnose HD in patients with atypical symptoms; (3) an increase in the willingness of GPs to record a diagnosis of HD in patients’ records; (4) or an increase in the longevity of those with manifest HD as a consequence of the general population trend as well as the result of better symptomatic treatment.
Using the same database and during the same time period, our present study shows that the increase in prevalence of HD previously reported4 does not appear to be explained by a rise in incidence. More reliable diagnoses of HD are also unlikely to be an explanation because, if this had been the case, we should have observed an apparent increase in incidence. It is possible that patients with a prior diagnosis of HD are more likely to register with a practice contributing to the CPRD. We doubt that this is a viable explanation and, anyway, it should also be reflected by an increased incidence.
There are two remaining possibilities for this surprising rise in prevalence in the face of a constant incidence: (1) GPs are now more willing to include an HD diagnosis in the records of previously diagnosed patients potentially due to a decline in the stigma associated with the condition34; (2) survival has markedly improved. We are currently examining this second possibility.
Systematic review of incidence
The present systematic review confirms the apparent heterogeneity of the incidence of HD between different populations.5 Studies undertaken in Eastern Asia show consistently lower estimates of incidence compared with those reported from Australasia, North America and parts of Europe. It is notable, however, that substantial heterogeneity in the incidence of HD has been reported in the European region with, as already discussed, estimates from Finland, Iceland and Northern Italy being substantially less than those reported in Spain and the UK (table 3).
Although it is possible that this observed heterogeneity in the estimates of the incidence of HD could be due to differences in the methodology of case ascertainment and diagnosis, examination of the data in table 4 suggests that this is unlikely to be the sole explanation. Indeed, the heterogeneity of the estimates of the incidence of HD is broadly consistent with the heterogeneity of estimates of the prevalence of the condition. Lower prevalence rates of HD have been noted in studies carried out in Asia compared with those among populations predominantly of European decent. The estimates of incidence among Finish and Icelandic peoples as well as Italians from the Ferrara region of Italy are also compatible with the low prevalence rates in these populations. The very low incidence of juvenile HD, in the UK22 (0.70, 95% CI 0.36 to 1.22 per million person-years), is also consistent with its low prevalence (6.77, 95%CI 5.6 to 8.12 per million) compared with the most recent (2010) estimate of the prevalence of adult HD (123, 95% CI 112 to 135 per million).4
A definitive molecular genetic test for the HD mutation has been available since the early 1990s in most developed countries. Differences in the rates of genetic testing might provide some explanation for the differences in the heterogeneity of estimates of incidence in the populations studied. This explanation also seems unlikely. For example, the overall incidence of HD in Taiwan, during the past decade, has remained consistently lower than estimates from the UK over similar time periods.
The present study suggests that, over the past two decades, the incidence of HD in the UK has remained constant despite a doubling of the prevalence of HD during this same time period. We also demonstrate that there is significant heterogeneity in the estimates of the incidence of HD carried out in other populations worldwide. Particularly low estimates of incidence in Eastern Asia, as well as parts of Europe, suggests that modifiers of the expression of the disease may play an important role in determining the propensity of populations to be vulnerable to expansions of the HD allele.3 35 36 Better understanding of the potential modifiers of expression, in different populations, may help to develop new therapeutic strategies.
Footnotes
Contributors: All the authors contributed to the design of the study. Data extraction from CPRD was undertaken by LC, ID, SJE and LS. Data analyses were performed by LC, NSW and MDR. Statistical analyses were performed by LC, SJE and MDR. The systematic review was undertaken by ARW and MDR. All authors contributed to, and approved, the submitted manuscript.
Funding: The authors gratefully acknowledge support for this study from the Hereditary Disease Foundation, the Wellcome Trust and the Medical Research Council.
Competing interests: None declared.
Ethics approval: The study was approved from the CPRD's Independent Scientific Advisory Committee and from the London School of Hygiene and Tropical Medicine's Research Ethics Committee.
Provenance and peer review: Not commissioned; externally peer reviewed.
Data sharing statement: No additional data are available.
References
- 1.Novak MJ, Tabrizi SJ. Huntington's disease. BMJ 2010;341:34–40. [DOI] [PubMed] [Google Scholar]
- 2.Wexler NS. Huntington's disease: advocacy driving science. Annu Rev Med 2012;63:1–22. 10.1146/annurev-med-050710-134457 [DOI] [PubMed] [Google Scholar]
- 3.[No authors listed]. A novel gene containing a trinucleotide repeat that is expanded and unstable on Huntington's disease chromosomes. The Huntington's disease Collaborative Research Group. Cell 1993;72:971–83. 10.1016/0092-8674(93)90585-E [DOI] [PubMed] [Google Scholar]
- 4.Evans SJW, Douglas I, Rawlins MD et al. Prevalence of adult Huntington's disease in the UK based on diagnoses recorded in general practice records. J Neurol Neurosurg Psychiatry 2013;84:1156–60. 10.1136/jnnp-2012-304636 [DOI] [PMC free article] [PubMed] [Google Scholar]
- 5.Pringsheim T, Wiltshire K, Day L et al. The incidence and prevalence of Huntington's disease: a systematic review and meta-analysis. Mov Disord 2012;27:1083–91. 10.1002/mds.25075 [DOI] [PubMed] [Google Scholar]
- 6.Herrett E, Gallagher AM, Bhashkaran K et al. Data resource profile: Clinical Practice Research Datalink (CPRD). Int J Epidemiol 2015;4:827–36. 10.1093/ije/dyv098 [DOI] [PMC free article] [PubMed] [Google Scholar]
- 7.NHS Connecting for Health. Read Codes. http://www.connectingforhealth.nhs.uk/systemsandservices/data/uktc/readcodes (accessed 9 Jun 2015).
- 8.Clinical Practice Research Datalink. CPRD Governance. http://www.cprd.com/governance/ (accessed 9 Jun 2015).
- 9.Herrett E, Thomas SL, Schoonen WM et al. Validation and validity of diagnoses in the General Practice Research Database: a systematic review. Br J Clin Pharmacol 2010;69:4–14. 10.1111/j.1365-2125.2009.03537.x [DOI] [PMC free article] [PubMed] [Google Scholar]
- 10.Conneally PM. Huntington's disease: genetics and epidemiology. Am J Hum Genet 1984;36:506–26. [PMC free article] [PubMed] [Google Scholar]
- 11.Harper PS. The epidemiology of Huntington's disease. Hum Genet 1992;89:365–76. 10.1007/BF00194305 [DOI] [PubMed] [Google Scholar]
- 12.Kay C, Fisher E, Hayden MR. Epidemiology. In: Bates GP, Tabrizi SJ, Jones L, eds. Huntington's disease. 4th edn Oxford: Oxford University Press, 2014:131–64. [Google Scholar]
- 13.Leung CM, Chan YW, Chang CM et al. Huntington's disease in Chinese: a hypothesis of its origin. J Neurol Neurosurg Psychiatr 1992;55:681–4. 10.1136/jnnp.55.8.681 [DOI] [PMC free article] [PubMed] [Google Scholar]
- 14.Al-Jader LN, Harper PS, Krawczak M et al. The frequency of inherited disorders database: prevalence of Huntington disease. Community Genet 2001;4:148–57. doi:51175 [DOI] [PubMed] [Google Scholar]
- 15.Hoppitt T, Pall H, Calvert M et al. A systematic review of the incidence and prevalence of long-term neurological conditions in the UK. Neuroepidemiology 2011;36:19–28. 10.1159/000321712 [DOI] [PMC free article] [PubMed] [Google Scholar]
- 16.Centre for Molecular Medicine and Therapeutics. Published reports of the worldwide prevalence of Huntington's disease. University of British Columbia, 2011. [Google Scholar]
- 17.http://www.cmmt.ubc.ca/research/diseases/huntingtons/HD_Prevalence (accessed 9 Jun 2015).
- 18.Moher D, Liberati A, Tetzlaff J et al. , The PRISMA Group. Preferred Reporting Items for Systematic Reviews and Meta-Analyses: the PRISMA statement. PLoS Med 2009;6:e1000097 10.1371/journal.pmed1000097 [DOI] [PMC free article] [PubMed] [Google Scholar]
- 19.Higgins JP, Thompson SG, Deeks JJ et al. Measuring inconsistency in meta-analysis. BMJ 2003; 327:557–60. 10.1136/bmj.327.7414.557 [DOI] [PMC free article] [PubMed] [Google Scholar]
- 20.Chen KM, Brody JA, Kurland LT. Patterns of neurologic diseases on Guam. Arch Neurol 1968;19:573–8. 10.1001/archneur.1968.00480060043005 [DOI] [PubMed] [Google Scholar]
- 21.Mercy L, Hodges JR, Dawson K et al. Incidence of early-onset dementias in Cambridgeshire, United Kingdom. Neurology 2008;71:1496–9. 10.1212/01.wnl.0000334277.16896.fa [DOI] [PubMed] [Google Scholar]
- 22.Douglas I, Evans S, Rawlins MD et al. Juvenile Huntington's disease: a population-based study using the General Practice Research Database. BMJ Open 2013;3:e002085 10.1136/bmjopen-2012-002085 [DOI] [PMC free article] [PubMed] [Google Scholar]
- 23.Chang CM, Yu YL, Fong KY et al. Huntington's disease in Hong Kong Chinese: epidemiology and clinical picture. Clin Exp Neurol 1994;31:43–51. [PubMed] [Google Scholar]
- 24.Chen YY, Lai CH. Nationwide population-based epidemiologic study of Huntington's disease in Taiwan. Neuroepidemiology 2010;35:250–4. 10.1159/000319462 [DOI] [PubMed] [Google Scholar]
- 25.Palo J, Somer H, Ikonen E. Low prevalence of Huntington's disease in Finland. Lancet 1987;2:805–6. 10.1016/S0140-6736(87)92545-1 [DOI] [PubMed] [Google Scholar]
- 26.Sveinsson O, Halldórsson S, Olafsson E. An unusually low prevalence of Huntington's disease in Iceland. Eur Neurol 2012;68:48–51. 10.1159/000337680 [DOI] [PubMed] [Google Scholar]
- 27.Govoni V, Pavoni M, Granieri E et al. La chorea de Huntington nella provinica di Ferrara negli anni 1971–1987. Studio descrittivo. Riv Neurol 1988;58:235–40. [PubMed] [Google Scholar]
- 28.Sackley C, Hoppitt TJ, Calvert M et al. Huntington's disease: current epidemiology and pharmacological management in UK primary care. Neuroepidemiology 2011;37:216–21. 10.1159/000331912 [DOI] [PubMed] [Google Scholar]
- 29.Panas M, Karadima G, Vassos E et al. Huntington's disease in Greece: the experience of 14 years. Clin Genet 2011;80:586–90. 10.1111/j.1399-0004.2010.01603.x [DOI] [PubMed] [Google Scholar]
- 30.Ramos-Arroyo MA, Moreno S, Valiente A. Incidence and mutation rates of Huntington's disease in Spain: experience of 9 years of direct genetic testing. J Neurol Neurosurg Psychiatry 2005;76:337–42. 10.1136/jnnp.2004.036806 [DOI] [PMC free article] [PubMed] [Google Scholar]
- 31.McCusker EA, Casse RF, Graham SJ et al. Prevalence of Huntington disease in New South Wales in 1996. Med J Aust 2000;173:187–90. [DOI] [PubMed] [Google Scholar]
- 32.Kokmen E, Ozekmekci FS, Beard CM et al. Incidence and prevalence of Huntington's disease in Olmsted County, Minnesota (1950 through 1989). Arch Neurol 1994;51:696–8. 10.1001/archneur.1994.00540190076018 [DOI] [PubMed] [Google Scholar]
- 33.Almqvist EW, Elterman DS, MacLeod PM et al. High incidence rate and absent family histories in one quarter of patients newly diagnosed with Huntington disease in British Columbia. Clin Genet 2001;60:198–205. 10.1034/j.1399-0004.2001.600305.x [DOI] [PubMed] [Google Scholar]
- 34.Wexler AR. The woman who walked into the sea: Huntington's and the making of a genetic disease. New Haven: Yale University Press, 2008. [Google Scholar]
- 35.Warby SC, Visscher H, Collins JA et al. HTT haplotypes contribute to differences in Huntington disease prevalence between Europe and East Asia. Eur J Hum Genet 2011;19:561–6. 10.1038/ejhg.2010.229 [DOI] [PMC free article] [PubMed] [Google Scholar]
- 36.Xu M, Wu ZY. Huntington disease in Asia. Chin Med J (Engl) 2015;128:1815–19. 10.4103/0366-6999.159359 [DOI] [PMC free article] [PubMed] [Google Scholar]
Associated Data
This section collects any data citations, data availability statements, or supplementary materials included in this article.
Supplementary Materials
bmjopen-2015-009070supp.pdf (255KB, pdf)