

Abstract
Objective
Because of the lack of head-to-head trials, the aim was to indirectly compare sodium glucose transporter-2 (SGLT-2) inhibitors in the treatment of type 2 diabetes.
Design
Systematic review and network meta-analysis.
Data sources
MEDLINE and EMBASE were searched from January 2005 to January 2015.
Eligibility criteria
Randomised controlled trials assessing the efficacy of SGLT-2 inhibitors in patients with type 2 diabetes inadequately controlled with diet and exercise alone or metformin monotherapy. Minimum duration 24 weeks. Indirect comparison was undertaken using Bayesian methods.
Results
In monotherapy, a greater proportion of patients achieved a glycated haemoglobin (HbA1c) level of <7% on canagliflozin 300 mg than on canagliflozin 100 mg (risk ratio (RR) 0.72%, 95% credible intervals (CrI) 0.59% to 0.87%) and dapagliflozin 10 mg (RR 0.63, 95% CrI 0.48 to 0.85) but there were no significant differences compared with either dose of empagliflozin. In monotherapy, canagliflozin 300 mg reduced HbA1c more than other SGLT-2 inhibitors (mean difference ranged from 0.20% to 0.64%). There were no significant differences in weight reduction. All the flozins reduced systolic blood pressure (SBP) more than placebo, ranging from a reduction of 6 mm Hg with canagliflozin 300–2.6 mm Hg with empagliflozin 10 mg. In dual therapy with metformin, all flozins were more effective than placebo for achieving HbA1c <7%, and reducing HbA1c, weight and SBP. The proportions achieving HbA1c level of <7% were mostly similar. Canagliflozin 300 mg reduced HbA1c more than the other drugs but this just reached statistical significance only against canagliflozin 100 mg (MD 0.15, CrI 0.04 to 0.26).
Conclusions
There were few differences among the SGLT-2 inhibitors, but in monotherapy, the glucose-lowering effect of canagliflozin 300 mg is slightly greater than most other SGLT-2 inhibitors.
Keywords: SGLT2 inhibitors, type 2 diabetes
Strengths and limitations of this study.
In the absence of head-to-head comparisons of different sodium glucose transporter-2 inhibitors, a Bayesian network meta-analysis was used to compare the efficacy of the drugs.
Studies were identified by a systematic search, and data abstraction and quality assessment of the studies were done independently by two authors.
The study also includes the newer drugs in this class namely luseogliflozin, ipragliflozin and tofogliflozin.
Safety data were not compared. The trials were for a maximum of 26 weeks duration.
Introduction
The newest class of drugs for type 2 diabetes are the sodium glucose co-transporter 2 receptor (SGLT-2) inhibitors. These reduce the reabsorption of renal-filtered glucose back into the bloodstream, thereby leading to loss of glucose in the urine. In the UK, the first three drugs in this class to reach the market, dapagliflozin, canagliflozin and empagliflozin, have been approved by the National Institute for Health and Care Excellence (NICE).1–3
In addition to the SGLT-2 transport system in the kidney, there is also a related transport system in the gut, SGLT-1. Most SGLT-2 inhibitors have no significant effect of SGLT-1, but one of the class, canagliflozin, does affect SGLT-1, and it has been suggested by Polidori et al4 that canagliflozin may reduce blood glucose by a dual action in both gut and kidney. However, that suggestion followed a very short-term study of canagliflozin in healthy individuals, and the gut effect was seen only with higher doses (>200 mg).
A second study by Polidori and colleagues from Janssen Research and Development looked at the SGLT-1 effect in people with type 2 diabetes5 and found that canagliflozin 300 mg, but not 150 mg, reduced postprandial plasma glucose, by about 0.5 mmol/L (from graph) for about 2 h after administration, since it depends on an intestinal drug action not a systemic one. Would a change of that magnitude be enough to make a clinically meaningful difference in glycated haemoglobin (HbA1c), experienced once a day?
If the SGLT-1 effect is clinically significant in people with type 2 diabetes, then one might expect canagliflozin 300 mg to be more potent in reducing HbA1c levels than other SGLT-2 inhibitors without the SGLT-1 effect. The usual starting dose of canagliflozin is 100 mg once daily.
In the absence of head-to-head trials, the relative potencies can only be assessed by an indirect comparison by a network meta-analysis (NMA). We have therefore carried out two NMAs, one of five drugs in monotherapy and the other of four drugs in dual therapy with metformin. The aim was to determine whether the glucose-lowering effect of canagliflozin would be greater than that of other flozins without the SGLT-1 effect. Secondary aims were to compare effects on weight loss and blood pressure, and on proportions achieving HbA1c targets.
Methods
Information sources and search strategy
A systematic search was undertaken to identify all the relevant studies. The searches were carried out in MEDLINE, MEDLINE In-process and EMBASE from January 2005 to September 2014 using search strategies given in online supplementary appendix S1. The search strategy was modified for other databases. The searches were updated in January 2015 and no new studies were found to be relevant. The reference lists of all the included studies were also checked for possible inclusions.
bmjopen-2015-009417supp_appendix.pdf (210KB, pdf)
Study selection
Abstracts retrieved by the searches were screened for inclusion or exclusion. The studies were included if they met the following criteria: randomised controlled trial (RCT) assessing the efficacy of any SGLT-2 inhibitors in monotherapy in patients with type 2 diabetes inadequately controlled with diet and exercise, and in dual therapy in patients with inadequate control on metformin monotherapy. We compared the efficacies of only licensed doses, and in the data extraction tables, details of arms with other doses are omitted. Minimum duration was 24 weeks. The included studies should have reported either proportion of patients achieving an HbA1c target of <7.0% or mean change in HbA1c from baseline to 24 weeks. We also sought changes in body weight and systolic blood pressure (SBP) from baseline to 24 weeks.
Risk of bias assessment
The quality of studies was assessed using the Cochrane Collaboration's tool for assessing risk of bias.6 The items assessed were (1) sequence generation, (2) allocation concealment, (3) blinding of outcome assessor, (4) incomplete outcome data and (5) selective outcome reporting. They were graded as unclear, high or low risk of bias.
Study selection and data abstraction
The studies were screened for inclusion and exclusion by one author and checked by a second. Any disagreements were resolved through discussion. There was no need for a third reviewer to resolve any disagreements regarding inclusion or exclusion. Data extraction forms were completed by one author and checked by a second author. Similarly, quality assessment was done by one author and checked by a second.
Summary measures
The proportion of patients achieving an HbA1c level target of <7.0% at 24 weeks was summarised as risk ratio (RR). The treatment effects of continuous outcomes, that is, mean change in HbA1c, body weight or SBP from baseline to 24 weeks were summarised as weighted mean difference.
Data synthesis and model implementation
The treatment effects were assessed using a Bayesian approach to provide probability distributions for treatment effect parameters, with 95% credible intervals (CrIs) instead of 95% CI.
A Bayesian NMA method was used to analyse all the data, preserving randomised treatment effects within trials and accounting for correlation between comparisons with three arms. The freely available software, WinBUGS V.1.4.3, was used. The statistical heterogeneity in treatment effect estimates was estimated using between-study variance (ie, square root of the SD of underlying effects across trials) with 95% CrI.7 Since our NMA included different trials comparing different SGLT-2 inhibitors, the distribution of treatment effect modifiers cannot only vary across trials for a particular comparison (as with standard pairwise meta-analysis, causing heterogeneity), but also between comparisons (causing inconsistency). If there is an imbalance in the distribution of treatment effect modifiers between different types of direct comparisons, the related indirect comparisons will be biased.8 To estimate inconsistency in the networks of evidence, we calculated the difference between indirect and direct estimates whenever indirect estimates could be constructed with a single common comparator.9 Inconsistency was defined as disagreement between direct and indirect evidence with a 95% CrI excluding 0 for MD and 1 for RR.10 The model convergence was assessed using trace plots and the Brooks-Gelman-Rubin statistic. The analysis was undertaken using two Markov chains, which was ran simultaneously. The model was found to be converging adequately after 20 000 samples for both chains. We ran the model further using 70 000 samples and the results presented in the paper are based on these samples as we discarded the first 20 000 samples. The probability of a treatment being the most effective (first best), the second best, and so on was also calculated. The results have been presented graphically with median ranks.
Both fixed-effect and random-effect models were used. The Bayesian Deviation Information Criterion (DIC) was used to compare the two models to see which was appropriate to compare treatment effects. The DIC measures the fit of the model while penalising it for the number of effective parameters. The model with the lowest DIC value was considered as the most appropriate NMA model. Based on DIC values obtained from the two models and also because of small number of studies available for the NMA, a fixed-effect model was chosen. Owing to small number of studies, it would have been difficult to estimate between-studies variance if a random-effect model was implemented.
We excluded the Bolinder 2012 trial11 of dapagliflozin because it recruited patients with very good baseline HbA1c (mean 7.2%) who would have less to gain. The primary outcome of the study was body composition and HbA1c was an exploratory variable. The low baseline HbA1c meant that the reduction in HbA1c was much smaller that in other trials, creating heterogeneity. However details are reported in tables and the Bolinder study was included in a sensitivity analysis.
The Henry 2012 trial12 was unusual in that patients on no drug therapy were randomised straight to dual therapy with dapagliflozin and metformin (vs placebo and metformin) without trying monotherapy first. It is also included in a sensitivity analysis.
We also used the ipragliflozin trial by Kashiwagi et al24 only in sensitivity analysis because it had unusual features—an adjusted difference in HbA1c of 1.3%, which was made up of a reduction of 0.87% on ipragliflozin and a rise of 0.38% on placebo, despite weight loss on placebo. More of the placebo group (52%) had by chance had prior treatment with other glucose-lowering drugs than in the ipragliflozin arm (35%, p=0.045). No patients in the placebo group achieved HbA1c <7.0%, so in order to run the model we used 0.5% as achieving that.
We used a software called DigitizeIt to calculate SD from a published figure for an outcome mean change in HbA1c for a study13 assessing efficacy of canagliflozin in patients inadequately controlled with diet and exercise.
Results
Study selection and characteristics
A total of 535 abstracts were retrieved from the searches (figure 1). After removing 73 duplicate articles, there were 462 articles left for title and abstract screening. A total of 417 articles were excluded on the basis of title and abstracts. Forty-five articles were included for full-text screening. Thirteen trials12–24 met all the inclusion criteria and were included for the analysis. Table 1 gives characteristics of all the included studies. We have summarised baseline characteristics and results obtained in trials in tables 2 and 3. We included six trials11 12 14 15 17 18 of dapagliflozin, three trials13 19 22 of canagliflozin, two trials of empagliflozin16 20 one each of luseogliflozin,21 ipragliflozin24 and tofogliflozin.23
Figure 1.

Study selection flow diagram.
Table 1.
Baseline characteristics of all included studies
| Study | Participants and baseline data | Intervention/outcomes |
|---|---|---|
| Dapagliflozin | ||
|
Bailey et al14 Setting: multicentre (n=80) Design: four-arm, double-blind, placebo-controlled RCT, dual therapy. Only 10 mg arm included in NMA Follow-up: 24 weeks; 102 weeks |
N: 534 Participants: patients with type 2 diabetes inadequately controlled with metformin (≥1500 mg/day) Age (years): dapa 10 mg+metformin 52.7, SD 9.9; placebo+metformin 53.7, SD 10.3 HbA1c (%): dapa 10 mg+metformin 7.92, SD 0.82; placebo+metformin 8.11, SD 0.96 BMI (kg/m2): dapa 10 mg+metformin 31.2, SD 5.1; placebo+metformin 31.8, SD 5.3 |
Interventions
|
|
Bolinder et al11 Setting: multicentre (n=40) in Bulgaria, Czech Republic, Hungary, Poland and Sweden Design: two-arm, double-blind, placebo-controlled RCT in dual therapy Duration: 24 weeks |
N: 180 Participants: patients with type 2 diabetes inadequately controlled with metformin (≥1500 mg/day) Age (years): dapa 10 mg+metformin 60.6, SD 8.2; placebo+metformin 60.8, SD 6.9 HbA1c (%): dapa 10 mg+metformin 7.19, SD 0.44; placebo+metformin 7.16, SD 0.53. Note the very low baseline level BMI (kg/m2): dapa 10 mg+metformin 32.1, SD 3.9; placebo+metformin 31.7, SD 3.9 |
Intervention
|
|
Ferrannini et al15 Setting: multicentre (n=85) in the USA, Canada, Mexico and Russia Design: double-blind, parallel-group, placebo-controlled, phase 3 RCT in monotherapy Duration: 24 weeks |
N: 274 Participants: patients with type 2 diabetes mellitus inadequately controlled with diet and exercise, naïve to treatment Age (years): dapa 10 mg 50.6, SD 9.97; placebo 52.7, SD 10.3 HbA1c (%): dapa 10 mg 8.01, SD 0.96; placebo 7.84, SD 0.87 BMI (kg/m2): dapa 10 mg+metformin 33.6, SD 5.4; placebo+metformin 32.3, SD 5.5 |
Intervention
|
|
Henry et al12 —Two studies (focusing on study 2) Setting: multicentre (n=131)—hospitals and clinics in North America, Latin America, Europe and Asia Design: double-blind, active controlled trials in dual therapy Duration: 24 weeks |
N: 638 Participants: patients with type 2 diabetes inadequately controlled with diet and exercise, naïve to treatment Age (years): dapa 10 mg+metformin 51.5, SD 10.1; placebo+metformin 52.7, SD 10.4 HbA1c (%): dapa 10 mg+metformin 9.1, SD 1.3; placebo+metformin 9.1, SD 1.3 BMI (kg/m2): NR |
Intervention
|
|
Ji et al17 Setting: multicentre (n=40) in China (n=26), Korea (n=5), Taiwan (n=5) and India (n=4) Design: double-blind, placebo-controlled, parallel-group, RCT, monotherapy Duration: 24 weeks |
N: 393 Participants: patients with type 2 diabetes naïve to drug treatment (prescription medication for diabetes including Chinese traditional medicines for diabetes, or prescription medication for diabetes for <24 weeks since diagnosis) Age (years): dapa 10 mg 51.2, SD 9.89; placebo 49.9, SD 10.87 HbA1c (%): dapa 10 mg 8.28, SD 0.95; placebo 8.35, SD 0.95 BMI (kg/m2): dapa 10 mg 25.76, SD 3.43; placebo 25.93, SD 3.64 |
Intervention
|
|
Kaku et al23
2014 Setting: multicentre (n=NR) in Japan Design: double-blind, parallel-group, placebo-controlled RCT, monotherapy Duration: 24 weeks |
N: 261 Participants: patients with type 2 diabetes naïve to drug treatment Age (years): dapa 10 mg 57.5, SD 9.3; placebo 60.4, SD 9.7 HbA1c (%): dapa 10 mg 7.46, SD 0.61; placebo 7.50, SD 0.63 BMI (kg/m2): dapa 10 mg 26.6, SD 4.52; placebo 25.22, SD 4.39 |
Intervention
|
| Canagliflozin | ||
|
Lavalle-Gonzalez et al19 Setting: multicentre (n=169) in 22 countries Design: double-blind, placebo-controlled and active-controlled trial, dual therapy Duration: 26 weeks |
N: 1284 Participants: patients with type 2 diabetes inadequately controlled with metformin Age (years): cana 100 mg+metformin 55.5, SD 9.4; cana 300 mg+metformin 55.3, SD 9.2; placebo+metformin 55.3, SD 9.8 HbA1c (%): cana 100 mg+metformin 7.9, SD 0.9; cana 300 mg+metformin 7.9, SD 0.9; placebo+metformin 8.0, SD 0.9 BMI (kg/m2): cana 100 mg+metformin 32.4, SD 6.4; cana 300 mg+metformin 31.4, SD 6.3; placebo+metformin 31.1, SD 6.1 |
Intervention
|
|
Stenlof et al13 Setting: multicentre (n=NR) in 17 countries Design: double-blind, placebo-controlled, phase 3 RCT, monotherapy Duration: 26 weeks |
N: 584 Participants: patients with type 2 diabetes inadequately controlled with diet and exercise and also on antihypoglycaemic agents who underwent washout (8 weeks and diet and exercise period with placebo run-in period) of the agent Age (years): cana 100 mg 55.1, SD 10.8; cana 300 mg 55.3, SD 10.2; placebo 55.7, SD 10.9 HbA1c (%): cana 100 mg 8.1, SD 1.0; cana 300 mg 0, SD 1.0; placebo 8.0, SD 1.0 BMI (kg/m2): cana 100 mg 31.3, SD 6.6; cana 300 mg 31.7, SD 6.0; placebo 31.8, SD 6.2 |
Intervention
|
|
Inagaki et al22 Setting: multicenter (n=31) in Japan Design: double-blind placebo-controlled phase 3 parallel group trial Duration: 24 weeks |
N: 272 Participants: patients with type 2 diabetes inadequately controlled with diet and exercise Age (years): cana 100 mg 58.4, SD 10.4; placebo 58.2, SD 11.0 HbA1c (%): cana 100 mg 7.98, SD 0.73; placebo 8.04, SD 0.70 BMI (kg/m2): cana 100 mg 25.59, SD 4.20; placebo 25.85, SD 4.39 |
Intervention
|
| Empa | ||
|
Haring et al16 Setting: multicentre (n=148) in 12 countries (Canada, China, France, Germany, India, Korea, Mexico, Slovakia, Slovenia, Taiwan, Turkey and the USA) Design: double-blind placebo-controlled phase 3 RCT, dual therapy Duration: 24 weeks |
N: 637 Participants: patients with type 2 diabetes inadequately controlled with diet and exercise and a stable immediate-release metformin regimen Age (years): empa 10 mg+metformin 55.5, SD 9.9; empa 25 mg+metformin 55.6, SD 10.2; placebo+metformin 56, SD 9.7 HbA1c (%): empa 10 mg+metformin 7.94, SD 0.79; empa 25 mg+metformin 7.86, SD 0.87; placebo+metformin 7.90, SD 0.88 BMI (kg/m2): empa 10 mg+metformin 29.1, SD 5.5; empa 25 mg+metformin 29.7, SD 5.7; placebo+metformin 28.7, SD 5.2 |
Intervention
|
|
Roden et al20 Setting: multicentre (n=124) in 9 countries (Belgium, Canada, China, Germany, India, Japan, Switzerland and USA) Design: double-blind parallel-group RCT, monotherapy Duration: 24 weeks |
N: 899 Participants: patients with type 2 diabetes with no previous history to treatment (oral or injected hypoglycaemic agents 12 weeks prior to randomisation) Age (years): empa 10 mg 56.2, SD 11.6; empa 25 mg 53.8, SD 11.6; placebo 54.9, SD 10.9 HbA1c (%): empa 10 mg 7.87, SD 0.88; empa 25 mg 7.86, SD 0.85; placebo 7.91, SD 0.87 BMI (kg/m2): empa 10 mg 28.3, SD 5.5; empa 25 mg 28.2, SD 5.5; placebo 28.7, SD 6.2 |
Intervention
|
| Luseogliflozin | ||
|
Seino et al21 Setting: multicentre (n=23) in Japan Design: double-blind, placebo-controlled, parallel-group, comparative, RCT, monotherapy Duration: 24 weeks |
N: 158 Participants: patients diagnosed with type 2 diabetes on stable diet therapy for ≥6 weeks and not on any antidiabetic drugs Age (years): luseo 2.5 mg 58.9, SD 10.1; placebo 59.6, SD 9.3 HbA1c (%): luseo 2.5 mg 8.14, SD 0.91; placebo 8.17, SD 0.80 BMI (kg/m2): luseo 2.5 mg 25.98, SD 4.88; placebo 25.34, SD 4.19 |
Intervention
|
| Ipragliflozin | ||
|
Kashiwagi et al24 Setting: multicentre (n=34) in Japan Design: double-blind, placebo-controlled RCT with a 28 weeks open-label extension Duration: 24 weeks with a 28 weeks open-label extension |
N: 168 Participants: patients with type 2 diabetes of ≥12 weeks of duration, treated with metformin for ≥6 weeks and with an HbA1c level of 7.4–9.9% and BMI of 20–45 kg/m2 Age (years): ipra 50 mg 56.2, SD 10.67; placebo 57.7, SD 9.24 HbA1c (%): ipra 50 mg 8.25, SD 0.719; placebo 8.38, SD 0.738 BMI (kg/m2): ipra 50 mg 25.96, SD 4.410; placebo 25.47, SD 3.092 |
Intervention
|
| Togoliflozin | ||
|
Kaku et al23 Setting: multicentre (n=33) in specialists and non-specialists hospital in Japan Design: double-blind, placebo-controlled, parallel-group RCT Duration: 24 weeks |
N: 235 Participants: patients with type 2 diabetes naïve to drug therapy but, only treated with diet and exercise for ≥8 weeks before screening, HbA1c level of ≥7.3% to <10.3%, BMI of ≥18.5 to <45 kg/m2, per cent changes in HbA1c and body weight from the provisional registration visit to the final registration visit of ≤10% and <5%, respectively, controlled BP and those requiring antihypertensives only those who did not require changing of their dosing regimen. Patients using other antidiabetic drugs were eligible if they had stopped their drug ≥8 weeks before the provisional registration. (HbA1c reported in Japan Diabetes Society or JDS units but, converted to NGSP units) Age (years): tofo 10 mg 58.6, SD 9.8; tofo 20 mg 56.6, SD 10.2; tofo 40 mg 57.0, SD 9.1; placebo 56.8, SD 9.9 HbA1c (%): tofo 10 mg 8.45, SD 0.75; tofo 20 mg 8.34, SD 0.81; tofo 40 mg 8.37, SD 0.77; placebo 8.41, SD 0.78 BMI (kg/m2): tofo 10 mg 25.07, SD 3.53; tofo 20 mg 24.99, SD 4.55; tofo 40 mg 25.78, SD 4.10; placebo 26.00, SD 4.11 |
Intervention
|
BMI, body mass index; cana, canagliflozin; CPR, C peptide immunoreactivity; dapa, dapagliflozin; DBP, diastolic blood pressure; DEXA, dual-energy X-ray absorptiometry; empa, empagliflozin; FM, fat mass; FPG, fasting plasma glucose; FSI, fasting serum insulin; HbA1c, glycated haemoglobin; HDL-C, high-density lipoprotein cholesterol; HOMA-R, homeostasis model assessment of insulin resistance; HOMA-β, homeostasis model assessment of β-cell function; ipra, ipragliflozin; luseo, luseogliflozin; NMA, network meta-analysis; NR, not reported; OGTT, oral glucose tolerance test; PPG, postprandial glucose; RCT, randomised controlled trial; SBP, systolic blood pressure; tofo, tofogliflozin.
Table 2.
Summary table with results (monotherapy)
| Entry criteria HbA1c (%) | HbA1c baseline | Age baseline | BMI baseline | Weight baseline | eGFR baseline | Per cent HbA1c <7% drug | Per cent HbA1c <7% PBO | Weight loss PBO | Weight loss drug | Reduction HA1c PBO | Reduction HbA1c drug | Difference HbA1c | |
|---|---|---|---|---|---|---|---|---|---|---|---|---|---|
| Dapagliflozin | |||||||||||||
| Ferrannini et al15 | 7 to 10 | 7.84–8.01 | 50.6–52.7 | 32.3–33.6 | 88.8–94.2 | NR | 51 | 32 | −2.2 | −3.2 | −0.23 | −0.89 | −0.66 |
| Ji et al17 | ≥7.5 to ≤10.5 | 8.28–8.35 | 49.9–51.2 | 25.76–25.93 | 70.92–72.18 | NR | 50 | 21.3 | −0.27 | −2.25 | −0.29 | −1.11 | −0.82 |
| Kaku et al23 | ≥6.5 to ≤10 | 7.46–7.50 | 57.5–60.4 | 25.22–26.06 | 65.96–69.7 | 66.9–67.8 | 36 | 19 | −0.84 | −2.22 | −0.06 | −0.45 | −0.39 |
| Canagliflozin | |||||||||||||
| Inagaki et al22 | 7 to 10 | 8.04 | 58.2–58.4 | 25.59 to 25.85 | 68.57–69.10 | 81.4–84.7 | 31.5 | 6.6 | −0.76 | −3.76 | +0.29% | −0.74% | −1.03% |
| Stenlof et al13 | ≥7.0 to ≤10.0 | 8.0–8.1 | 55.1–55.7 | 31.3–31.8 | 85.8–87.6 | NR | 45, 62 | 21 | NR | NR | 0.14 | −0.77; −1.03 | −0.91; −1.17 |
| Empagliflozin | |||||||||||||
| Roden et al20 | ≥7.0 to ≤10.0 | 7.86–7.91 | 53.8–56.2 | 28.2–28.7 | 77.8–78.4 | 86.8–87.7 | 35, 44 | 12 | −0.33 | −2.26; −2.48 | 0.08 | −0.66; −0.78 | −0.74; −0.86 |
| Luseogliflozin | |||||||||||||
| Seino et al21 | ≥6.5 to ≤10.5 | 8.14–8.17 | 58.9–59.6 | 25.34–25.98 | 66.67–70.19 | NR | NR | NR | −0.9 | −2.7 | +0.13 | −0.63 | −0.76 |
| Tofogliflozin | |||||||||||||
| Kaku et al23 | ≥7.3 to <10.3 | 8.34–8.45 | 56.6–58.6 | 24.99–26 | 67.26–71.20 | 83.78–86.78 | NR | NR | −0.356 | −2.23 −2.851 −2.971 |
−0.028 | −0.767 −1.017 −0.870 |
−0.769 −0.990 −0.842 |
HbA1c in per cent; age in years; BMI in kg/m2; weight in kg; eGFR in mL/min/1.73 m2.
BMI, body mass index; eGFR, estimated glomerular filtration rate; HbA1c, glycated haemoglobin; NR, not reported; PBO, placebo.
Table 3.
Summary table with results (dual therapy)
| Entry criteria HbA1c (%) | HbA1c baseline | BMI baseline | Age baseline | Weight baseline | eGFR baseline | Per cent HbA1c <7% PBO | Per cent HbA1c <7% drug | Weight loss PBO | Weight loss drug | Reduction HA1c PBO | Reduction HbA1c drug | Difference HbA1c | |
|---|---|---|---|---|---|---|---|---|---|---|---|---|---|
| Dapagliflozin | |||||||||||||
| Bailey et al14 | 7–10 | 7.9–8.2 | 31.5 | 52.7–53.7 | NR | NR | 26 | 41 | 0.9 | 2.9 | 0.3 | 0.84 | 0.54 |
| Bolinder et al11 | 6.5–8.5 | 7.2 | 31.0 | 60.6–60.8 | 90.9–92.1 | ≥30 to ≥90 | NR | NR | 0.9 | 3.0 | 0.1 | 0.39 | 0.29 |
| Henry et al12 | 7.5–12 | 9.1 | NR | 51.0–52.7 | 87.2–88.4 | NR | 35 | 47 | 1.4 | 3.3 | 1.44 | 1.98 | 0.54 |
| Canagliflozin | |||||||||||||
| Lavalle-Gonzalez et al19 | 7.0–10.5 | 7.9 | 31.8 | 55.4 | 87.2 | 87.7 to 90.2 | 29 | 46; 58 | 1–2 | 3.3, 3.7 | 0.17 | 0.79, 0.94 | 0.62, 0.77 |
| Empagliflozin | |||||||||||||
| Haring et al16 2014 | 7–10 | 7.9 | 29.2 | 55.7 | 81.2 | 89.0 | 23 | 38; 39 | 0.45 | 2.0. 2.5 | 0.13 | 0.70, 0.77 | 0.57, 0.64 |
| Ipragliflozin | |||||||||||||
| Kashiwagi et al24 | 7.4–9.9 | 8.25–8.38 | 25.47–25.96 | 56.2–57.7 | NR | NR | 0 | 21.4 | −0.63 | −2.33 | 0.38 | −0.87 | −1.30 |
HbA1c in per cent; age in years; BMI in kg/m2; weight in kg; eGFR in mL/min/1.73 m2.
BMI, body mass index; eGFR, estimated glomerular filtration rate; HbA1c, glycated haemoglobin; NR, not reported; PBO, placebo.
Eight trials13 15 17 18 20–23 compared the efficacy of SGLT-2 inhibitors in monotherapy with placebo in patients inadequately controlled with diet and exercise. Six studies11 12 14 16 19 24 compared flozins with placebo in dual therapy in patients failing to achieve glycaemic control on metformin alone.
Not all studies reported all the outcomes. Data on mean change in HbA1c were reported by all studies. Six monotherapy studies13 15 17 18 20 22 reported the proportion achieving HbA1c of <7.0% as did five dual therapy studies.12 14 16 19 24 For mean change in weight, seven15 17 18 20–23 monotherapy and five12 14 16 19 24 dual therapy studies provided adequate information on efficacy of SGLT-2 inhibitors. For mean change in SBP, five monotherapy studies13 15 20 22 23 and three dual therapy studies16 19 24 reported sufficient data. Stenlof et al13 did not report weight SDs for the two doses of canagliflozin, so this study could not be included. The weight data for canagliflozin 100 mg come from Inagaki 2014 where the 100 and 200 mg doses of canagliflozin were used. We excluded the 200 mg dose since this is not a standard dose.
The networks comparing different SGLT-2 inhibitors for proportion of patients achieving HbA1c level of <7% in monotherapy and dual therapy are shown in figures 2 and 3.
Figure 2.
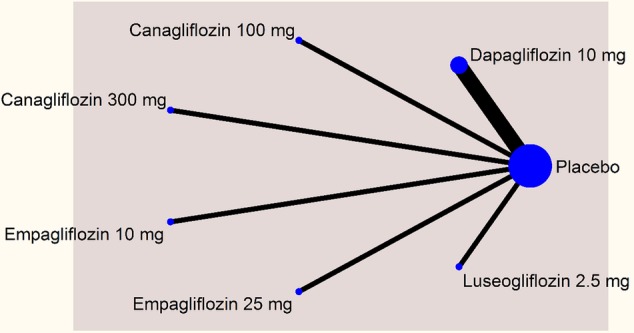
Network plot—monotherapy (mean change in glygated haemoglobin).
Figure 3.

Network plot—dual therapy (% of patients achieving glycated haemoglobin <7%).
As aforementioned, for other outcomes, some SGLT-2 inhibitors could not be included in the analysis due to inadequate information.
Risk of bias of included trials
Most of the included studies were high in quality, with low risk of bias. There were some studies where risk of bias could not be judged due to inadequate information. In this case, the risk of bias item was judged as unclear. Details of risk of bias are shown in figure 4. All the studies were funded by pharmaceutical companies.
Figure 4.
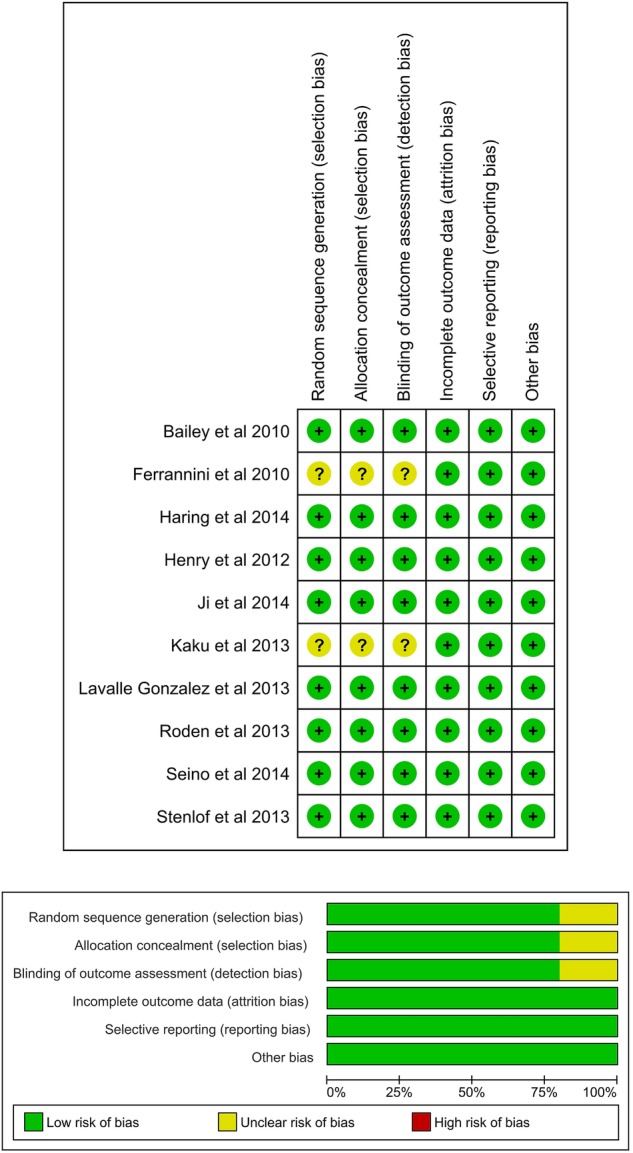
Risk of bias.
Monotherapy
All SGLT-2 inhibitors were all significantly more effective than placebo for increasing proportion of patients achieving HbA1c <7% (figure 5), reducing the mean change in HbA1c (%) from baseline (figure 6), and reducing mean weight from baseline (figure 7). All SGLT-2 inhibitors reduced SBP compared with placebo, but this failed to reach statistical significance for dapagliflozin 10 mg, tofogliflozin 10 and 40 mg because of wide CIs (figure 8).
Figure 5.

Proportion of patients achieving HbA1c level of <7%—monotherapy. HbA1c, glycated haemoglobin; NA, not available; NMA, network meta-analysis.
Figure 6.

Mean change in HbA1c (%)—monotherapy. HbA1c, glycated haemoglobin; NA, not available; NMA, network meta-analysis.
Figure 7.

Mean change in weight (kg)—monotherapy. NA, not available; NMA, network meta-analysis.
Figure 8.

Mean change in SBP (mm Hg)—monotherapy. NA, not available; NMA, network meta-analysis; SBP, systolic blood pressure.
Using canagliflozin 300 mg as the baseline, patients on canagliflozin 100 mg (RR=0.72, 95% CrI 0.59 to 0.87) and dapagliflozin 10 mg (RR=0.63, 95% CrI 0.48 to 0.85) were 28% and 37% less likely to have achieved HbA1c <7% compared with those on canagliflozin 300 mg (figure 5). The proportions of patients achieving HbA1c <7% were similar among empagliflozin 10 mg, canagliflozin 100 mg and dapagliflozin 10 mg.
Canagliflozin 300 mg gave the largest reduction in HbA1c (−1.23%) compared with placebo. Compared with the other flozins, some differences appeared not only statistically significant but also clinically meaningful: canagliflozin 100 mg MD from canagliflozin 300 mg=0.20 (95% CrI 0.05 to 0.36); empagliflozin 25 mg (MD 0.37, 95% CrI 0.16 to 0.58); tofogliflozin 40 mg (MD 0.39, 95% CrI 0.12 to 0.66); luseogliflozin 2.5 mg (MD=0.47, 95% CrI 0.19 to 0.74); tofogliflozin 10 mg (MD 0.46, 95% CrI 0.19 to 0.73); empagliflozin 10 mg (0.49, 95% CrI 0.29 to 0.69); and dapagliflozin 10 mg (MD=0.64, 95% CrI 0.45 to 0.83; figure 6).
Canagliflozin 100 mg led to greater weight reduction than the other flozins; this reaching statistical significance was compared with empagliflozin 25 mg (MD 0.85, 95% CrI 0.37 to 1.33); empagliflozin 10 mg (MD 1.07, 95% CrI 0.59 to 1.56); tofogliflozin 10 mg (MD 1.13, 95% CrI 0.45 to 1.80); luseogliflozin 2.5 mg (MD 1.20, 95% CrI 0.63 to 1.77); and dapagliflozin 10 mg (MD 1.37, 95% CrI 0.92 to 1.83; figure 7).
SBP was reduced by all the flozins relative to placebo, with reductions ranging from 6.1 mm Hg for canagliflozin 300 mg to 2.6 mm Hg for empagliflozin 10 mg, though (figure 8) in some cases CIs were wide and the reductions were not statistically significant. Among the flozins, only empagliflozin 10 mg gave a difference that was statistically significant against canagliflozin (figure 8; 300 mg: MD 3.55, 95% CrI 0.60 to 6.44; 100 mg: MD 2.56, 95% CrI 0.30 to 4.75).
For some comparisons, between-study variance was small suggesting no heterogeneity; however, the CrIs were wide which reflects the small number of studies available for pairwise comparisons. Analyses based on direct versus indirect comparisons showed no evidence of inconsistency between direct and indirect evidence in the network for all outcomes.
Dual therapy
For dual therapy, we undertook sensitivity analyses by including Kashiwagi et al24 (ipragliflozin), Henry et al12 (dapagliflozin) and Bolinder et al11 (dapagliflozin). Data for all the outcomes were not available from these studies. Therefore, a sensitivity analysis including the first two studies was undertaken for the proportions of patients achieving HbA1c level of <7%, mean change in HbA1c and mean change in weight. Bolinder et al11 study was included in the sensitivity analysis of mean change in HbA1c and weight. Kashiwagi et al24 was also included for sensitivity analysis of mean change in SBP.
All SGLT-2 inhibitors were significantly more effective than placebo for achieving HbA1c <7% (figure 9), reducing HbA1c (%) from baseline (figure 10), weight loss (figure 11) and reducing SBP (figure 12). The results were slightly different when the trials by Kashiwagi et al24 and Henry et al12 were included, as discussed later.
Figure 9.

Proportion of patients achieving HbA1c level of <7.0%—dual therapy. HbA1c, glycated haemoglobin; NA, not available; NMA, network meta-analysis.
Figure 10.

Mean change in HbA1c (%)—dual therapy. HbA1c, glycated haemoglobin; NA, not available; NMA, network meta-analysis.
Figure 11.

Mean change in weight (kg)—dual therapy. NA, not available; NMA, network meta-analysis.
Figure 12.

Mean change in SBP (mm Hg)—dual therapy. NA, not available; NMA, network meta-analysis; SBP, systolic blood pressure.
Empagliflozin 25 and 10 mg, and canagliflozin 300 mg had higher proportions of patients achieving HbA1c <7% than canagliflozin 100 mg and dapagliflozin 10 mg (figure 9).
Canagliflozin 300 mg gave the greatest reduction in HbA1c (0.77%), but the differences were small (vs canagliflozin 100 mg (MD=0.15, 95% CrI 0.04 to 0.26) and dapagliflozin 10 mg (MD=0.23, 95% CrI −0.01 to 0.47); figure 10). There were no statistically significant differences between the two doses of canagliflozin and the two doses of empagliflozin.
In sensitivity analyses compared with placebo (figure 13), ipragliflozin 50 mg showed the greatest reduction in HbA1c (1.25%) followed by canagliflozin 300 mg (0.77%), empagliflozin 25 mg (0.64%), canagliflozin 100 mg (0.62%), empagliflozin 10 mg (0.57%) and dapagliflozin 10 mg (0.54%), but as noted above, we have reservations about the Kashiwagi study.
Figure 13.

Proportion of patients achieving HbA1c level of <7.0% (dual therapy), sensitivity analysis including Henry et al12 and Kashiwagi et al.24 HbA1c, glycated haemoglobin; NA, not available; NMA, network meta-analysis.
All the drugs were associated with greater weight loss than placebo, ranging from a reduction of 1.63 kg on empagliflozin 10 mg to 2.5 kg on canagliflozin 300 mg (figure 11). Canagliflozin 300 mg was statistically significantly better in reducing weight than empagliflozin 10 mg (MD 0.88 kg, 95% CrI 0.16 to 1.61) and ipragliflozin 50 mg (0.81 kg, 95% CrI 0.03 to 1.58; figure 14).
Figure 14.

Mean change in weight (kg; dual therapy), sensitivity analysis including Bolinder et al,11 Henry et al12 2012 and Kashiwagi et al.24 NA, not available; NMA, network meta-analysis.
For mean change in SBP, inclusion of the Kashiwagi (ipragliflozin) and Henry studies (dapagliflozin) caused contrasting results. By excluding them, all flozins (canagliflozin 300 and 100 mg, empagliflozin 25 and 10 mg) were associated with significant reduction in SBP compared with placebo, but there were no significant differences among them (figure 12). By including the two studies, all flozins including dapagliflozin and ipragliflozin were found to be significantly better than placebo, but less so than without them, and there were differences between them. Dapagliflozin 10 mg was found to be significantly better than all other flozins, and ipragliflozin 50 mg, canagliflozin 300 mg and empagliflozin 25 mg were found to be better than empagliflozin 10 mg (figure 15).
Figure 15.

Mean change in SBP (mm Hg; dual therapy), sensitivity analysis including Kashiwagi et al.24 NA, not available; NMA, network meta-analysis; SBP, systolic blood pressure.
For some comparisons, between-study variance was small suggesting no heterogeneity; however, the CrIs were wide which reflects the small number of studies available for pairwise comparisons. Analyses based on direct versus indirect comparisons showed no evidence of inconsistency between direct and indirect evidence in the network for all outcomes.
The effect of including the Bolinder trial was that the mean reduction in HbA1c on dapagliflozin became significantly less than with canagliflozin 300 mg, empagliflozin 25 mg and canagliflozin 100 mg. The findings for weight did not change. However, as noted earlier, patients in the Bolinder trial started at a much lower baseline HbA1c and had a much smaller mean reduction in HbA1c.
A sensitivity analysis including the Henry and Kashiwagi trials is shown in figure 16. The CIs around ipragliflozin are very wide because no patients in the placebo group achieved HbA1c under 7%.
Figure 16.

Mean change in HbA1c (%; dual therapy), sensitivity analysis including Bolinder et al,11 Henry et al12 and Kashiwagi et al.24 HbA1c, glycated haemoglobin; NA, not available; NMA, network meta-analysis.
Discussion
Statement of principal findings
Our NMA showed few differences among the flozins. In monotherapy, canagliflozin 300 mg gave the largest reduction in HbA1c among the SGLT-2 inhibitors in patients with type 2 diabetes with inadequate glycaemic control on diet and exercise alone. However, treatment with canagliflozin would be started with 100 mg and only increased in those with an insufficient response to that dose. Those with a poor response to the 100 mg dose might also have a poor response to 300 mg.
In monotherapy, the reduction in weight was greatest with canagliflozin 100 mg (−3 kg). All the SGLT-2 inhibitors reduced SBP, though wide CIs meant that differences were not always statistically significant. In dual therapy with metformin, canagliflozin 300 mg gave the greatest reductions in HbA1c (0.77%) and weight (−2.5 kg), and these differences were sometimes statistically significant but not clinically so. There were no statistically significant differences among the drugs in reducing SBP.
Strengths and limitations
We compared the efficacy of SGLT-2 inhibitors in patients with type 2 diabetes inadequately controlled with diet and exercise or metformin monotherapy. The relevant studies were identified systematically. Data extraction and quality assessment of the included studies were checked systematically by two authors. Most of the included studies were high in quality but the risk of bias in some studies could not be judged due to lack of information.
Our study has strengths. Unlike conventional pair wise meta-analysis, our NMAs allow for comparisons between SGLT-2 inhibitors that have not been compared head-to-head in RCTs. In addition, combining direct and indirect evidence in NMA offer additional precision by ‘borrowing strength’ from indirect evidence.25 Another strength of the NMA is that it treats all comparators as separate treatments while gaining statistical power from including all available data.26
The main limitation is the lack of head-to-head trials. The number of trials contributing evidence to several comparisons in the network was small.
Another limitation is that in the trials, patients were randomised to canagliflozin 300 mg, whereas in clinical practice, they would be tried on 100 mg daily first.
One of the three dapagliflozin trials, by Kaku et al,18 recruited patients with a baseline HbA1c of only 7.5%, and not surprisingly their reduction in HbA1c was less (0.39%) than in most other trials. Exclusion of this study would raise the mean reduction on dapagliflozin to 0.75% (Astra Zeneca corporate communication, at NICE Appraisal Committee 25 November 2015).
Another factor to be considered is that in the dapagliflozin trials, HbA1c fell in the placebo groups, by 0.29% and 0.23% in the Ji et al17 and Ferrannini et al15 trials. In the Ferrannini trial, weight fell significantly by 2.2 kg. In the placebo groups in the canagliflozin trials, HbA1c rose by 0.29%22 and 0.14% (Stenlof CANTATA-M).13 Ferranini et al suggested that the reduction in HbA1c in the placebo group might have been due to improved adherence to lifestyle advice in that group, but since the placebo tablets matched the dapagliflozin ones, this seems unlikely.
When interpreting weight changes, the baseline body mass indices (BMIs) need to be considered. The trials in China and Japan recruited people with BMIs in the 25–26 range, whereas the European trials had mean BMIs ranging from 28 to almost 34.
Some of the included studies did not report data on all outcomes, and for these, we were not able to compare all the SGLT-2 inhibitors against each other. For example, the Seino et al21 trial with the new SGLT-2 inhibitor, luseogliflozin, did not provide data on proportion of patients achieving HbA1c level of <7% and mean change in SBP.
The primary outcomes of both canagliflozin studies were reported at 26 weeks instead of 24 weeks. Therefore, we assumed that the effect of canagliflozin measured at 26 weeks was comparable against other SGLT-2 inhibitors, which reported results at 24 weeks.
The numbers of patients in each centre were often small, such as means of 3.2 patients per centre in the Ferranini trial and 4.5 in the Bolinder one. This must raise questions about how typical the recruits were. We did not compare safety data.
Meaning of the study
In the absence of head-to-head comparison of SGLT-2 inhibitors in patients with type 2 diabetes inadequately controlled with diet and exercise or metformin, this study examines the evidence as to whether any drug is better than others. NICE has approved dapagliflozin 10 mg as an option for the treatment of diabetes in combination with metformin or as an add-on to insulin with or without other glucose-lowering drugs.1 NICE has approved canagliflozin as dual therapy (in combination with metformin if sulfonylurea is contraindicated) or triple therapy (in combination with metformin plus sulfonylurea or metformin plus thiazolidinediones) or as add on to insulin with or without other antidiabetic drugs.2 Empagliflozin has also been approved by NICE in combination therapy.3
The usual first drug for type 2 diabetes is metformin, with sulfonylurea in those who cannot tolerate metformin. NICE is appraising the use of the flozins in monotherapy in people who cannot take metformin in 2015.27 It has been pointed out that the flozins are the only oral glucose-lowering drugs that are associated with weight reduction.
A recent mixed treatment comparison, available in abstract only at present,28 compared the efficacy and safety of canagliflozin in dual therapy (in combination with metformin) using a Bayesian approach against sulfonylureas, pioglitazone, dipeptidyl peptidase-4 (DPP-4) inhibitors, glucagon-like peptide-1 (GLP-1) analogues and dapagliflozin. The outcomes compared were HbA1c, weight and hypoglycaemia at 26, 52 and 104 weeks. Pacou et al reported that both canagliflozin 100 and 300 mg led to larger reductions in HbA1c level than with DPP-4 inhibitors and dapagliflozin but similar reduction in HbA1c to liraglutide over 104 weeks. The weight reduction was also comparable to GLP-1 analogues. Hypoglycaemia was less frequent with all SGLT-2 inhibitors compared with sulfonylureas. The mixed treatment comparison undertaken by Pacou et al (most of whom are associated with Janssen, the manufacturers of canagliflozin) was not available in full, so we were not able to determine which studies were included or to assess the quality of the study.
Our initial question was whether canagliflozin is more potent than other SGLT-2 inhibitors, due to its dual effect on SGLT-2 and SGLT-1 receptors. In monotherapy, both doses of canagliflozin lowered HbA1c slightly more than both doses of empagliflozin, which does not have significant effects on SGLT-1 receptors. These differences were not seen in dual therapy. This suggests that the SGLT-1 effect may not be clinically significant.
There are still unanswered questions. We do not know how long SGLT-2 inhibitors would be effective for, but as the mode of action is independent of insulin release, one might expect them to be effective irrespective of diabetes duration. Women taking these drugs have increases in urinary tract and genital tract infection but these are reported in the trials to be mild in intensity. At present, we do not know if there are long-term adverse effects, either from the class as a whole or from individual drugs. There has been recent concern about diabetic ketoacidosis among people on the SGLT-2 inhibitors.29 30
Conclusion
There are few clinically significant differences among the drugs. In monotherapy, reductions in HbA1c were largest with canagliflozin and smallest with dapagliflozin. Differences in HbA1c were insignificant in dual therapy.
Footnotes
Contributors: NW and DSS conceived the study. DSS carried out the systematic review, assisted by NW. OAU carried out the network meta-analysis. All authors were involved in writing the manuscript.
Funding: This research received no specific grant from any funding agency in the public, commercial or not-for-profit sectors.
Competing interests: DSS has joined Eli Lilly but was employed by the University of Warwick when this review was undertaken. DSS carried out this work while in Warwick Medical School. DSS and NW were involved in the NICE STA on empagliflozin in combination therapy; NW was involved in the NICE STA of dapagliflozin in combination therapy; and OAU and NW are involved in the NICE appraisal of canagliflozin, dapagliflozin and empaglifozin in monotherapy for type 2 diabetes.
Provenance and peer review: Not commissioned; externally peer reviewed.
Data sharing statement: No additional data are available.
References
- 1.National Institute for Health and Care Excellence. NICE Guidance TA288. Dapagliflozin in combination therapy for treating type 2 diabetes. Secondary NICE Guidance TA288. Dapagliflozin in combination therapy for treating type 2 diabetes 2013. http://www.nice.org.uk/guidance/TA288/chapter/1-guidance
- 2.National Institute for Health and Care Excellence. NICE Guidance TA315. Canagliflozin in combination therapy for treating type 2 diabetes. Secondary NICE Guidance TA315. Canagliflozin in combination therapy for treating type 2 diabetes 2014. http://www.nice.org.uk/guidance/TA315/chapter/1-guidance
- 3.National Institute for Health and Care Excellence. Empagliflozin combination therapy for treating type 2 diabetes [ID641] GID-TAG441. Secondary Empagliflozin combination therapy for treating type 2 diabetes [ID641] GID-TAG441 2014. http://www.nice.org.uk/guidance/indevelopment/GID-TAG441
- 4.Polidori D, Sha S, Mudaliar S et al. Canagliflozin lowers postprandial glucose and insulin by delaying intestinal glucose absorption in addition to increasing urinary glucose excretion results of a randomized, placebo-controlled study. Diabetes Care 2013;36:2154–61. 10.2337/dc12-2391 [DOI] [PMC free article] [PubMed] [Google Scholar]
- 5.Stein P, Berg JK, Morrow L et al. Canagliflozin, a sodium glucose co-transporter 2 inhibitor, reduces post-meal glucose excursion in patients with type 2 diabetes by a non-renal mechanism: results of a randomized trial. Metab Clin Exp 2014;63:1296–303. 10.1016/j.metabol.2014.07.003 [DOI] [PubMed] [Google Scholar]
- 6.Higgins J, Green S, Collaboration TC.2011. Cochrane Handbook for Systematic Reviews of Interventions Version 5.1.0 [updated March 2011]. Secondary Cochrane Handbook for Systematic Reviews of Interventions Version 5.1.0 [updated March 2011] http://www.cochrane.org/handbook.
- 7.Veroniki AA, Vasiliadis HS, Higgins JP et al. Evaluation of inconsistency in networks of interventions. Int J Epidemiol 2013;42:332–45. 10.1093/ije/dys222 [DOI] [PMC free article] [PubMed] [Google Scholar]
- 8.Jansen JP, Naci H. Is network meta-analysis as valid as standard pairwise meta-analysis? It all depends on the distribution of effect modifiers. BMC Med 2013;11:159 10.1186/1741-7015-11-159 [DOI] [PMC free article] [PubMed] [Google Scholar]
- 9.Higgins JPT, Jackson D, Barrett JK et al. Consistency and inconsistency in network meta-analysis: concepts and models for multi-arm studies. Res Synth Methods 2012;3:98–110. 10.1002/jrsm.1044 [DOI] [PMC free article] [PubMed] [Google Scholar]
- 10.Dias S, Welton NJ, Caldwell DM et al. Checking consistency in mixed treatment comparison meta-analysis. Stat Med 2010;29:932–44. 10.1002/sim.3767 [DOI] [PubMed] [Google Scholar]
- 11.Bolinder J, Ljunggren O, Kullberg J et al. Effects of dapagliflozin on body weight, total fat mass, and regional adipose tissue distribution in patients with type 2 diabetes mellitus with inadequate glycemic control on metformin. J Clin Endocrinol Metab 2012;97:1020–31. 10.1210/jc.2011-2260 [DOI] [PubMed] [Google Scholar]
- 12.Henry RR, Murray AV, Marmolejo MH et al. Dapagliflozin, metformin XR, or both: initial pharmacotherapy for type 2 diabetes, a randomised controlled trial. Int J Clin Pract 2012;66:446–56. 10.1111/j.1742-1241.2012.02911.x [DOI] [PubMed] [Google Scholar]
- 13.Stenlof K, Cefalu WT, Kim KA et al. Efficacy and safety of canagliflozin monotherapy in subjects with type 2 diabetes mellitus inadequately controlled with diet and exercise. Diabetes Obes Metab 2013;15:372–82. 10.1111/dom.12054 [DOI] [PMC free article] [PubMed] [Google Scholar]
- 14.Bailey CJ, Gross JL, Pieters A et al. Effect of dapagliflozin in patients with type 2 diabetes who have inadequate glycaemic control with metformin: a randomised, double-blind, placebo-controlled trial. Lancet 2010;375:2223–33. 10.1016/S0140-6736(10)60407-2 [DOI] [PubMed] [Google Scholar]
- 15.Ferrannini E, Ramos SJ, Salsali A et al. Dapagliflozin monotherapy in type 2 diabetic patients with inadequate glycemic control by diet and exercise: a randomized, double-blind, placebo-controlled, phase 3 trial. Diabetes Care 2010;33:2217–24. 10.2337/dc10-0612 [DOI] [PMC free article] [PubMed] [Google Scholar]
- 16.Haring HU, Merker L, Seewaldt-Becker E et al. Empagliflozin as add-on to metformin in patients with type 2 diabetes: a 24-week, randomized, double-blind, placebo-controlled trial. Diabetes Care 2014;37:1650–9. 10.2337/dc13-2105 [DOI] [PubMed] [Google Scholar]
- 17.Ji L, Ma J, Li H et al. Dapagliflozin as monotherapy in drug-naive Asian patients with type 2 diabetes mellitus: a randomized, blinded, prospective phase III study. Clin Ther 2014;36:84–100.e9. 10.1016/j.clinthera.2013.11.002 [DOI] [PubMed] [Google Scholar]
- 18.Kaku K, Kiyosue A, Inoue S et al. Efficacy and safety of dapagliflozin monotherapy in Japanese patients with type 2 diabetes inadequately controlled with diet and exercise. Diabetes Obes Metab 2013;15:432–40. 10.1111/dom.12047 [DOI] [PubMed] [Google Scholar]
- 19.Lavalle-Gonzalez FJ, Januszewicz A, Davidson J et al. Efficacy and safety of canagliflozin compared with placebo and sitagliptin in patients with type 2 diabetes on background metformin monotherapy: a randomised trial. Diabetologia 2013;56:2582–92. 10.1007/s00125-013-3039-1 [DOI] [PMC free article] [PubMed] [Google Scholar]
- 20.Roden M, Weng J, Eilbracht J et al. Empagliflozin monotherapy with sitagliptin as an active comparator in patients with type 2 diabetes: a randomised, double-blind, placebo-controlled, phase 3 trial. Lancet Diabetes Endocrinol 2013;1:208–19. 10.1016/S2213-8587(13)70084-6 [DOI] [PubMed] [Google Scholar]
- 21.Seino Y, Sasaki T, Fukatsu A et al. Efficacy and safety of luseogliflozin as monotherapy in Japanese patients with type 2 diabetes mellitus: a randomized, double-blind, placebo-controlled, phase 3 study. Curr Med Res Opin 2014;30:1245–55. 10.1185/03007995.2014.912983 [DOI] [PubMed] [Google Scholar]
- 22.Inagaki N, Kondo K, Yoshinari T et al. Efficacy and safety of canagliflozin monotherapy in Japanese patients with type 2 diabetes inadequately controlled with diet and exercise: a 24-week, randomized, double-blind, placebo-controlled, Phase III study. Expert Opin Pharmacother 2014;15:1501–15. 10.1517/14656566.2014.935764 [DOI] [PubMed] [Google Scholar]
- 23.Kaku K, Watada H, Iwamoto Y et al. Efficacy and safety of monotherapy with the novel sodium/glucose cotransporter-2 inhibitor tofogliflozin in Japanese patients with type 2 diabetes mellitus: a combined phase 2 and 3 randomized, placebo-controlled, double-blind, parallel-group comparative study. Cardiovasc Diabetol 2014;13:65 10.1186/1475-2840-13-65 [DOI] [PMC free article] [PubMed] [Google Scholar]
- 24.Kashiwagi A, Kazuta K, Goto K et al. Ipragliflozin in combination with metformin for the treatment of Japanese patients with type 2 diabetes: ILLUMINATE, a randomized, double-blind, placebo-controlled study. Diabetes Obes Metab 2015;17: 304–8. 10.1111/dom.12331 [DOI] [PMC free article] [PubMed] [Google Scholar]
- 25.Cooper NJ, Peters J, Lai MC et al. How valuable are multiple treatment comparison methods in evidence-based health-care evaluation? Value Health 2011;14:371–80. 10.1016/j.jval.2010.09.001 [DOI] [PubMed] [Google Scholar]
- 26.Thorlund K, Mills EJ. Sample size and power considerations in network meta-analysis. Syst Rev 2012;1:41 10.1186/2046-4053-1-41 [DOI] [PMC free article] [PubMed] [Google Scholar]
- 27.National Institute for Health and Care Excellence. Canagliflozin, dapagliflozin and empagliflozin monotherapy for treating type 2 diabetes [ID756] GID-TAG471. Secondary canagliflozin, dapagliflozin and empagliflozin monotherapy for treating type 2 diabetes [ID756] GID-TAG471 2015. http://www.nice.org.uk/guidance/indevelopment/GID-TAG471
- 28.Pacou M, Taieb V, Abrams KR et al. Bayesian network meta-analysis to assess relative efficacy and safety of canagliflozin in patients with type 2 diabetes mellitus (T2DM) inadequately controlled with metformin. Value Health 2013;16:A609 10.1016/j.jval.2013.08.1747 [DOI] [Google Scholar]
- 29.Taylor SI, Blau JE, Rother KI. SGLT2 inhibitors may predipose to ketoacidosis. J Clin Endocrinol Metab 2015;100:2849–52. 10.1210/jc.2015-1884 [DOI] [PMC free article] [PubMed] [Google Scholar]
- 30.Peters AL, Buschur EO, Buse JB et al. Euglycemic diabetic ketoacidosis: a potential complication of treatment with sodium-glucose cotransported 2 inhibition. Diabetes Care 2015;38:1687–93. 10.2337/dc15-0843 [DOI] [PMC free article] [PubMed] [Google Scholar]
Associated Data
This section collects any data citations, data availability statements, or supplementary materials included in this article.
Supplementary Materials
bmjopen-2015-009417supp_appendix.pdf (210KB, pdf)