Abstract
The diagnosis of cardiac amyloidosis (CA) often necessitates invasive myocardial biopsy. We sought to evaluate whether LGE of the atrial myocardium by CMR was associated with impaired left atrial function, and whether the extent of left atrial LGE may enhance diagnostic differentiation of CA from other cardiomyopathies. Twenty-two patients with biopsy-proven CA, 37 with systemic hypertension (SH) and 22 with non-ischemic dilated cardiomyopathy (NIDC) underwent CMR and echocardiographic evaluation. CA patients had greater minimal left atrial volume (57 ± 53 vs. 24 ± 18 in SH and 19 ± 25% in NIDC, P=0.003), and significantly lower total left atrial emptying function (19 ± 14 vs. 40 ± 14 in SH and 33 ± 20% in NIDC, P=0.0006). The mean proportion of atrial enhancement (LGELA%) was significantly greater in CA patients compared to SH and NIDC (59 ± 36% vs. 7.4 ± 2.1 and 2.9 ± 9.0%, p<0.0001, respectively). There was also a strong inverse correlation between both active and total atrial emptying (r = −0.69 P=0.001, r=−0.67 P=0.01, respectively) with LGELA% for CA patients. In multivariable regression analysis, LGELA% was the strongest adjusted predictor for CA diagnosis. Using ROC analysis, LGELA% > or = 33% produced the highest diagnostic utility for CA (sensitivity 76%, specificity 94%). Patients with CA may have extensive LGE of the left atrial myocardium, which is associated with marked reduction in left atrial emptying function. The extent of left atrial LGE was highly predictive for the diagnosis of CA.
Keywords: amyloidosis, cardiac magnetic resonance imaging, late gadolinium enhancement, left atrial emptying function, non-ischemic dilated cardiomyopathy, systemic hypertension
INTRODUCTION
Recently there has been considerable interest in non-invasive diagnosis of cardiac amyloidosis (CA) using novel cardiac imaging modalities, such as contrast-enhanced cardiac magnetic resonance imaging (CMR). CMR may reveal a characteristic pattern of left ventricular subendocardial late gadolinium enhancement (LGE) that reflects the transmural histological distribution of amyloid protein within the ventricular myocardium.1 Prior studies of CMR in patients with histologically confirmed amyloidosis have revealed suboptimal nulling despite use of multiple inversion times (due to gadolinium uptake from the blood pool), as well as atrial enhancement.2 From a prognostic standpoint, the presence of LGE3 and hypointense signal on T2-weighted images4 may serve as important prognostic risk factors for mortality in amyloid patients. Amyloid protein deposition may also occur within the atrial endocardium,5 and has been associated with adverse pathophysiologic consequences, including both atrial failure and thromboembolism.6 The extent of left atrial enlargement, a surrogate marker for diastolic dysfunction, has been implicated as an independent predictor for long-term mortality.7 In this study, we sought to determine whether LGE of the left atrial myocardium in CA is associated with impaired left atrial emptying function. We also evaluated whether LGE extent within the left atrium may enhance diagnostic differentiation of CA from other cardiomyopathies.
METHODS
This was single-center study performed at our medical center. Twenty-two patients with endomyocardial biopsy-proven cardiac amyloidosis (CA) were recruited for this study. No patients had undergone any amyloid specific therapy prior to either echocardiogram or CMR 4 evaluation. One CA patient was excluded due to claustrophobia during CMR. Two additional groups of 37 patients with systemic hypertension (SH), and 22 patients with non-ischemic dilated cardiomyopathy (NIDC), who were clinically referred for CMR, were included as controls. Exclusion criteria were any clinical history of myocardial infarction and/or evidence of significant valvular heart disease. The Institutional Ethical Review Board at Brigham and Women’s Hospital approved the study.
All CMR examinations were performed with a 1.5-T scanner (Signa CV/i, General Electric, Milwaukee, Wisconsin) with the patient in a supine position and a 4- or 8-element phased-array coil placed over the chest. Images were acquired during breath-holds with electrocardiographic gating. We used a segmented k-space steady-state free-precession (SSFP) sequence (repetition time, 3.4 ms; echo time, 1.2 ms; in-plane spatial resolution between 1.5–1.8 mm and 1.8–2.1 mm, depending on the field of view) for cine imaging in parallel short-axis (contiguous slices of 8-mm thickness covering the base to apex) and 3 radial long-axis views (60 degrees apart) of the left ventricle. Temporal resolution of cine SSFP images were approximately 46 msec. With a previously described inversion recovery pulse sequence (repetition time, 4.8 ms; echo time, 1.3 ms; in-plane spatial resolution between 1.5–1.8 mm and 1.8–2.1 mm), LGE images at matching cine-image slice locations and slice thickness (8mm) were acquired 10 to 15 minutes after intravenous gadolinium-DTPA administration (0.15 to 0.20 mmol/kg; Magnevist, Berlex Pharmaceuticals, Wayne, NJ).8 We optimized the inversion time (250 to 350 ms) to null the normal myocardium gauged by obtaining signal intensity < 10 in the basal ventricular septum. LGE images were obtained with views per segment (range 8–24 lines) and trigger delay (350–550 msec) adjusted according to the patient’s heart rate to maximize image quality. LGE 5 characteristic for amyloidosis was defined as circumferential subendocardial enhancement. Focal areas of LGE (subepicardial, subendocardial, midwall) were excluded.
Echocardiography with tissue Doppler was performed in CA patients. Transmitral flow profiles, including peak early diastolic flow velocity (E), late diastolic flow velocity (A), and mitral E-wave deceleration time were assessed. Pulse-wave tissue Doppler imaging (TDI) was performed using spectral pulse-wave Doppler signal filters and minimum optimal gain. In apical views, a pulse-wave Doppler sample volume was placed at the level of the mitral annulus over the septal and lateral borders.9 Pulse-wave TDI results were characterized by a myocardial systolic wave, an early diastolic wave (E′), and an atrial contraction diastolic wave (A’). The pulse-wave TDI tracings were recorded over 5 cardiac cycles at a sweep speed of 100 mm/s and used for off-line calculations. The average e′ of the septal and lateral mitral annuluses was chosen to estimate LV diastolic function.
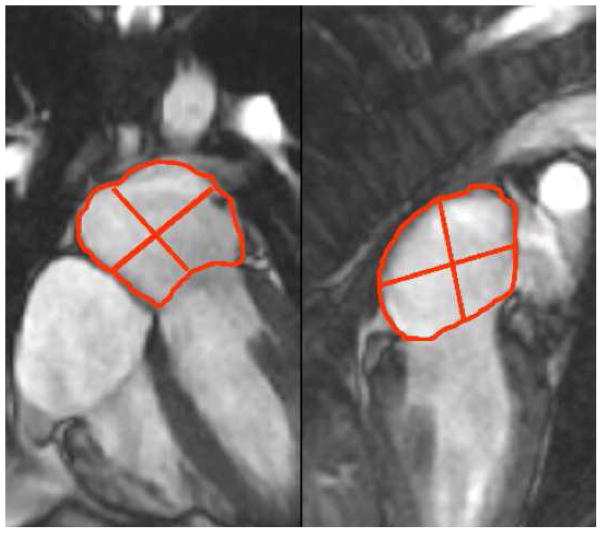
Cine SSFP and LGE imaging were performed in matching 3-radial planes to assess left atrial (LA) function and segmental infiltration of the LA myocardium. Tracing of the LA volumes were performed by a single experienced reader (KS) blinded to the patient’s name, underlying group diagnosis, and results from other examinations. LA volumes were calculated by the validated biplane area-length method and were assessed at each of the 3 diastolic time phases (end-ventricular systole, pre-atrial contraction, and post-atrial contraction). End-ventricular systole, pre-atrial contraction, and post-atrial contraction were marked by aortic valve closure, second diastolic opening of mitral valve leaflets, and mitral valve closure, respectively. At each time phase, LA volume was calculated by the biplane area-length method10 as follows: , where A2C and A4C were the LA areas on the 2-chamber and 4-chamber views, respectively, and L was the shorter long-axis length of the LA from either the 2-chamber or the 4-chamber views (Figure 1). The LA volumes quantified at end-ventricular systole, pre-atrial contraction, and post-atrial contraction, therefore corresponded to maximal LA volume (LAVmax), pre-atrial contraction LA volume (LAVac), and minimal LA volume (LAVmin), respectively. Consistent with the recommendation of published reports,11 all LA volumes were normalized to the patient’s body surface area.
Figure 1.
Method of measuring LA volumes for the calculation of LA emptying functions across different phases of ventricular diastole.
LA emptying functions were derived from the % reduction in LA volumes between the varying diastolic time points outlined above. LA total, passive, and active emptying functions (LAEFTotal, LAEFPassive, LAEFContractile) were calculated according to the following formulas, respectively:
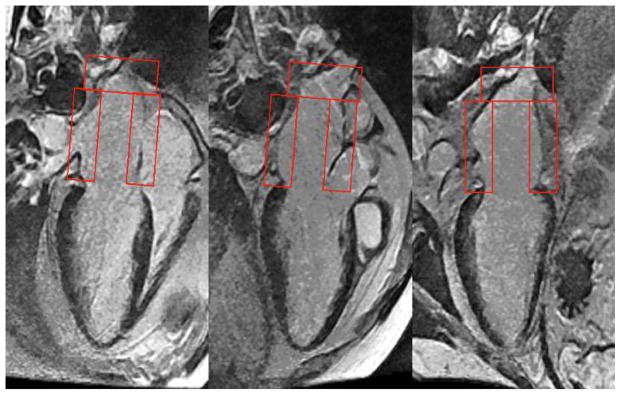
Assessment for presence of LGE in the LA was performed by consensus of 2 cardiologists, both blinded to the patient’s name and diagnosis. LGE imaging of the LA was analyzed by a 9-segment model (Figure 2) and quantified as a % extent of infiltration (LGELA%). The total number of segmental LGE of the LA (LGELA_Total) was counted and also expressed as a %age of the LA involved (LGELA%), where LGELA% = LGELA_Total*100%/9. The assessment of presence of LA LGE and quantitation of LGELA% was blinded to any of the results of LA function and vice versa.
Figure 2.
Grading of LA late gadolinium enhancement using a 9-segment model of the LA.
Prior to performing these assessments of LA LGE comparing the prospective cohorts, we blind-read radial long-axis LGE images and graded LGELA_Total of 21 subjects (14 with confirmed 7 cardiac amyloid, 7 normal volunteers) in order to test if patients with cardiac amyloidosis can be seen to have more prevalent LA LGE compared to normal volunteers. All 14 CA patients were noted to have LA LGE while only 1 of the 7 normal volunteers had LA LGE (P<0.0001). Average LGELA_Total was 7.5 segments for CA patients compared to 0.28 segments for normal volunteers (P<0.0001).
Continuous variables are summarized as mean ± standard deviation where normally distributed with equal variances and compared by student t test or ANOVA test. Non-parametrically distributed continuous data are presented as medians with interquartile range (IQR) and compared with Wilcoxon rank sum test or Kruskal-Wallis test. Bonferroni correction of type I error was used to adjust for multiple comparisons. We used Spearman’s rank correlation to examine correlations between continuous variables. Categorical variables are presented as frequency or percentage and were compared by the chi-square test (or Fisher exact test, where appropriate). We used logistic regression analysis to determine the association of clinical, ECG, LV and LA functional, and CMR contrast enhanced imaging variables with the diagnosis of CA. For continuous variables that were found to have strong association with CA diagnosis, we used receiver operator characteristic (ROC) analysis to determine the area under the curve (AUC) and the optimal diagnostic cut points for the variables. We constructed the best multivariable model for the diagnosis of CA using a stepwise selection strategy considering all available clinical, ECG, and imaging variables. In this selection, levels of model entry or stay were both set at 0.05. All statistical analyses were conducted with SAS version 9.1 (SAS Institute, Cary, NC) and graphical display were made using MedCalcR (Version 10.0.1, Belgium).
RESULTS
The baseline demographics of the study groups are displayed in Table 1. CA patients included 13 cases of primary AL subtype, 8 of senile transthyretin subtype, and 1 of family/hereditary mutant transthyretin subtype. The three groups were not different in age, gender, racial background, or body mass index nor were there any significant differences for their coronary artery risk factor profiles and baseline ECG findings. There was a higher prevalence of history of atrial fibrillation and use of oral anticoagulants in the CA group. The NIDC group had the largest indexed LVEDV and the lowest LVEF. No patients had received amyloid-specific treatment prior to CMR studies.
Table 1.
Baseline Characteristics
| Variable | Amyloidosis (n=22) | SH (n=37) | NIDC (n=22) | P value |
|---|---|---|---|---|
| Clinical History | ||||
| Patient Age in years (median, IQR) | 66, 17 | 59, 21 | 53, 17 | 0.002 |
| Women | 6 (27%) | 15 (41%) | 8 (37%) | 0.59 |
| Caucasian | 11 (50%) | 19 (52%) | 16 (72%) | 0.21 |
| Body Mass Index (kg/m2) | 24±6 | 29±8 | 28±4 | 0.10 |
| Diabetes mellitus | 2 (10%) | 12 (32%) | 4 (18%) | 0.11 |
| Hypercholesterolemia | 7 (33%) | 23 (62%) | 7 (32%) | 0.03 |
| Heavy Smoking | 2 (10%) | 5 (14%) | 1 (5%) | 0.54 |
| Peripheral vascular disease | 0 (0%) | 2 (7%) | 0 (0%) | 0.30 |
| Coronary artery disease | 0 (0%) | 3 (8%) | 0 (0%) | 0.21 |
| Atrial Fibrillation | 8 (36%) | 4 (11%) | 4 (18%) | 0.03 |
| On oral anticoagulants | 10 (45%) | 4 (11%) | 4 (18%) | 0.02 |
| Blood Pressure | ||||
| Systolic (mmHg) | 118±18 | 150±23 | 140±25 | <0.0001 |
| Diastolic (mmHg) | 67±11 | 77±13 | 79±16 | 0.009 |
| Electrocardiogram | ||||
| Normal Sinus Rhythm | 15 (68%) | 34 (92%) | 20 (91%) | 0.03 |
| Q waves | 7 (33%) | 4 (11%) | 2 (11%) | 0.07 |
| Left atrial enlargement | 4 (20%) | 7 (19%) | 7 (35) | 0.38 |
| Left ventricular hypertrophy | 3 (14%) | 4 (11%) | 3 (15%) | 0.90 |
| Low voltage QRS | 4 (20%) | 1 (5%) | 1 (3%) | 0.08 |
| QRS > 120 msec | 4 (19%) | 5 (14%) | 6 (30%) | 0.34 |
| Prolonged QTc | 13 (62%) | 22 (61%) | 13 (65%) | 0.96 |
| Left bundle branch block | 1 (5%) | 4 (11%) | 5 (25%) | 0.14 |
| Right bundle branch block | 5 (24%) | 4 (11%) | 0 (0%) | 0.06 |
| ST abnormalities | 6 (30%) | 6 (18%) | 5 (25%) | 0.60 |
| CMR Left Atrial and Left Ventricular Function | ||||
| Maximal LA volume (LAVmax, in ml/m2) (Median, IQR) | 60, 17¥ | 46, 47 | 15, 61 | 0.004 |
| Minimal LA volume (LAVmin, in ml/m2) (Median, IQR) | 47, 14¥ | 27, 24 | 7, 32 | <0.0001 |
| Passive atrial volume (ml) | 11±9 | 15±14 | 13±20 | 0.50 |
| Contractile atrial volume (ml) | 12±18 | 18±15 | 10±12 | 0.14 |
| Total left atrial emptying function (%) | 19±14¥ | 40±14 | 33±20 | 0.0006 |
| Passive left atrial emptying function (%) | 11±10 | 18±12 | 15±15 | 0.25 |
| Contractile left atrial emptying function (%) | 10±11¥ | 28±13 | 25±17 | 0.002 |
| Left ventricular mass index (g/m2) | 102±28¥ | 84±25 | 73±19 | 0.0005 |
| Left ventricular septal thickness in mm (Median, IQR) | 14, 4.6 | 14, 2.0 | 9, 1.6* | <0.0001 |
| Left ventricular lateral thickness in mm (Median, IQR) | 12, 3.5 | 10, 3.9 | 7.6, 1.2* | <0.0001 |
| Left ventricular end diastolic volume index (ml/m2) | 84±17 | 87±26 | 114±43* | 0.002 |
| Left ventricular end systolic volume index (ml/m2) | 52±28 | 39±20 | 75±47* | 0.0001 |
| Left ventricular ejection fraction (%) | 49±10 | 56±12 | 38±16* | <0.0001 |
| Left ventricle LGE present | 22 (100) | 10 (27) | 7 (37) | <0.0001 |
| Left Atrial LGE Extent | ||||
| Presence of left atrial LGE | 17 (78%)¥ | 5 (14%) | 2 (9%) | <0.0001 |
| Number of segments with left atrial LGE | 5.3±3.3¥ | 0.7±1.9 | 0.3±0.8 | <0.0001 |
| Quantitative left atrial LGE (%) | 59±36¥ | 7.4±21 | 2.9±9.0 | <0.0001 |
Denotes significant difference against amyloidosis group;
Denotes significant difference against both control groups.
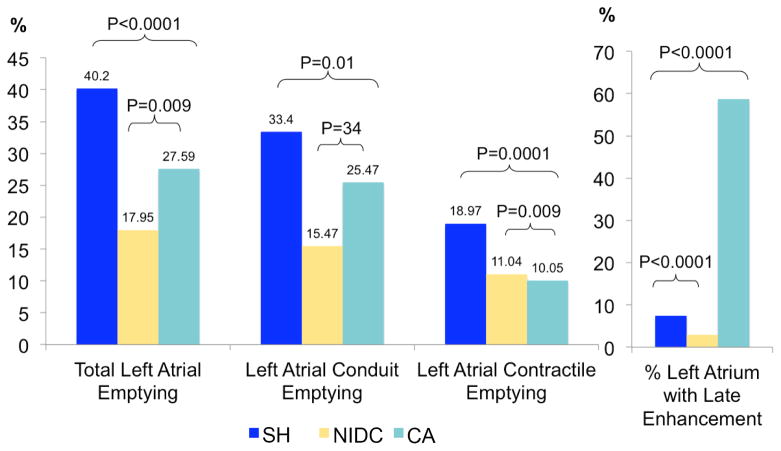
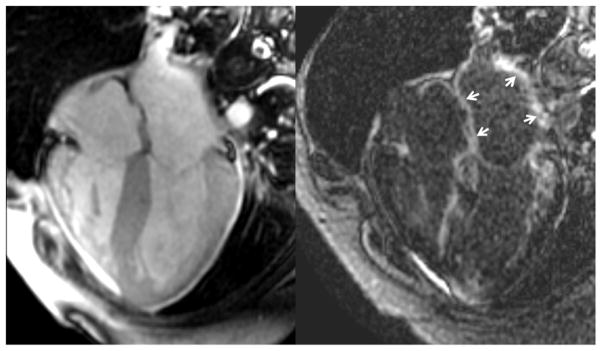
Quantitative CMR results between the three groups by ANOVA are presented in Table 1. LAVmax, LAVmin, and LV mass index of CA patients were significantly higher than both control groups. In addition, LAEFTotal was markedly reduced in CA patients compared to the control groups. LAEFPassive of CA patients, however, was not significantly different from the HTN group. During ventricular diastole, the markedly reduced LAEFTotal in CA patients was accounted for primarily by a reduced LAEFContractile as compared to the control groups. Qualitative interpretation identified LGE involvement of the LA in 78% of CA patients, compared to 14% and 9.1% of the HTN and NIDC groups (P<0.0001), respectively. LGELA% was extensive in the CA group, and significantly greater compared to the SH and NIDC groups. Figure 3 demonstrates the pair-wise comparisons of the different LA emptying function and LGELA% amongst the three groups. The observed marked reductions of LAEFTotal and LAEFContractile in CA patients were associated with a markedly high extent of LA LGE. Figure 4 illustrates a case example of a CA patient. This patient was noted to have no visible left atrial contraction on cine image (left) during late ventricular diastole despite normal sinus rhythm and no history of paroxysmal atrial fibrillation. After administration of gadolinium contrast, LGE imaging revealed LGE in all nine left atrial segments (indicated by arrows) as well as diffuse left ventricular myocardial enhancement.
Figure 3.
Comparisons of LA emptying functions and LA LGE sizes between study groups. Note that patients with CA had substantially elevated burden of LA LGE and reduced LA contractile emptying function. CA = cardiac amyloidosis, NIDC = non-ischemic dilated cardiomyopathy, SH = systemic hypertension.
Figure 4.
Case example of a patient with biopsy confirmed cardiac amyloidosis. Note the late enhancement involving the left atrial walls diffusely, associated with a marked reduction of left atrial contractile function.
We performed subgroup comparisons of CA patients and SH control since the morphological presentations of these 2 groups overlap clinically, especially between patients with AL subtype and SH patients. Septal and lateral wall thicknesses were not different between CA and SH patients, and between AL subtype CA patients and SH patients. Compared to SH patients, CA patients had lower LAEFTotal and LAEFContractile, and higher LGELA%. More specifically, when compared to SH patients, AL-subtyped CA patients had markedly lower LAEFTotal and LAEFContractile, and and higher LGELA% (all P<0.0001).
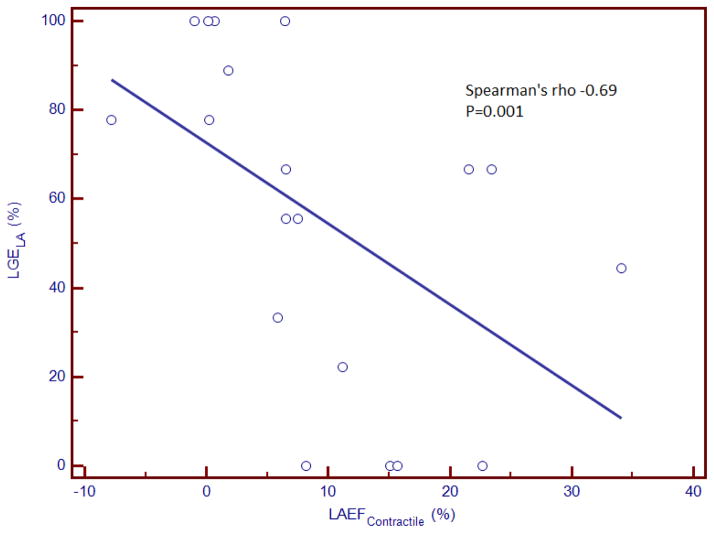
Spearman’s coefficients listed in Table 2 illustrate the quantitative relationship between LA size and different LA emptying functions with the extent of LA LGE. Among CA patients, LGELA% demonstrated a strong inverse correlation with LAEFContractile and LAEFTotal. Figure 5 illustrates the relationship between LAEFContractile and LGELA% in CA patients. Adjusted to age and history of atrial fibrillation, LGELA% of CA patients was 59% higher than HC patients and 67% higher than NIDC patients (both P<0.0001). In addition, adjusted to age and history of atrial fibrillation, LAEFContractile of CA patients was 14% lower than HC patients (P=0.0009) and 10% lower than NIDC patients (P=0.05), and LAEFTotal of CA patients was 17%% lower than HC patients (P=0.0003) and 9% lower than NIDC patients (P=0.09). Contrary to the findings in CA patients, there was no significant correlation between LGELA% and LA emptying functions or LA size in control patients with SH or NIDC (Table 2). Left ventricular end-systolic volume did not demonstrate any significant association with LGELA% across all groups.
Table 2.
Correlation between Components of Left Atrial Emptying Functions with Percent Extent of Left Atrial Late Gadolinium Enhancement
| Extent of Left Atrial Late Gadolinium Enhancement (%) | ||||
|---|---|---|---|---|
| All Patients | Amyloidosis | SH | NIDC | |
| Maximal left atrial volume | 0.32 P=0.01 |
0.13 P=0.60 |
0.15 P=0.48 |
−0.02 P=0.94 |
| Minimal left atrial volume | 0.42 P=0.0006 |
0.29 P=0.21 |
0.07 P=0.73 |
0.06 P=0.82 |
| Left atrial passive emptying function | −0.20 P=0.12 |
−0.31 P=0.20 |
0.26 P=0.20 |
−0.34 P=0.21 |
| Left atrial active emptying function | −0.52 P<0.0001 |
−0.69 P=0.0010 |
−0.17 P=0.41 |
−0.28 P=0.32 |
| Left atrial total emptying function | −0.47 P<0.0001 |
−0.67 P=0.001 |
0.14 P=0.47 |
−0.37 P=0.15 |
| Left ventricular end systolic volume index (per 10 ml/m2) | 0.03 P=0.83 |
0.21 P=0.41 |
0.09 P=0.64 |
0.19 P=0.46 |
Figure 5.
Scatterplot demonstrating a moderate inverse correlation between LA late gadolinium enhancement % and LA contractile emptying function. LAEFContractile= left atrial active emptying function, LGELA%= % late gadolinium enhancement extent of LA.
Echocardiography with tissue Doppler was performed a mean of 62 days (range 0 to 5.8 months) from the time of cardiac MRI in CA patients. Among the 18 CA patients who had echocardiography available for comparison, 10 had echocardiography performed for assessment of worsening heart failure symptoms and the other 8 were performed for routine assessment per clinicians’ discretion. No significant interval changes in treatment or status of atrial fibrillation were noted between times of CMR versus echocardiography. E’ by tissue Doppler echocardiography demonstrated moderate and good correlation with LAEFTotal and LAEFContractile, respectively in CA patients. A’, however, demonstrated a positive trend with LAEFTotal only.
Table 3 displays the univariable association of clinical, ECG, and imaging variables with the patient diagnosis of CA. When clinical and ECG variables were considered, only Q wave by ECG demonstrated significant, albeit weak, association with the clinical diagnosis of CA. LAVmin, LAEFTotal, LAEFContractile, and any presence of LGE within the LA demonstrated strong univariable associations with CA diagnosis. LGE extent of LA (LGELA%) and number of LA segments with LGE demonstrated the highest likelihood ratio chi-square for CA diagnosis in unadjusted analysis. For every LA segment with LGE, there was, on average, a nearly 2-fold increase in the odds of CA diagnosis.
Table 3.
Logistic Regression Analysis for a Diagnosis of Cardiac Amyloidosis
| Odds Ratio (95% CI) | LR χ2 | P-Value | |
|---|---|---|---|
| Clinical Variables | |||
| Patient age (in years) | 1.06 (1.02–1.11) | 10.93 | 0.0009 |
| Female gender | 0.59 (0.20–1.72) | 0.98 | 0.32 |
| Caucasian race | 0.69 (0.26–1.83) | 0.56 | 0.45 |
| Coronary artery disease | ** | ** | ** |
| Diabetes mellitus | 0.28 (0.06–1.35) | 3.13 | 0.08 |
| Hypercholesterolemia | 0.48 (0.17–1.37) | 1.95 | 0.16 |
| Heavy smoking | 0.98 (0.18–5.30) | 0.0005 | 0.98 |
| Electrocardiogram | |||
| Atrial fibrillation | 5.10 (1.40–18.55) | 6.21 | 0.01 |
| Significant Q waves | 4.00 (1.15–13.86) | 4.76 | 0.03 |
| Left atrial enlargement | 0.75 (0.21–2.62) | 0.21 | 0.65 |
| Left ventricular hypertrophy with strain | 1.17 (0.27–5.01) | 0.04 | 0.84 |
| Low voltage | 6.75 (1.13–40.29) | 4.71 | 0.03 |
| QRS > 120 msec | 0.96 (0.27–3.44) | 0.004 | 0.95 |
| Prolonged QTc | 0.97 (0.35–2.74) | 0.002 | 0.96 |
| Left bundle branch block | 0.26 (0.03–2.20) | 2.05 | 0.15 |
| Right bundle branch block | 4.06 (0.97–16.96) | 3.67 | 0.06 |
| Significant ST changes | 1.64 (0.51–5.24) | 0.67 | 0.41 |
| Significant T waves changes | 1.05 (0.36–3.08) | 0.007 | 0.93 |
| Left Ventricular Measurements | |||
| Left ventricular mass index (g/m2) | 1.03 (1.01–1.06) | 8.86 | 0.003 |
| Left ventricular end-diastolic volume index (per 10 ml/m2) | 0.85 (0.69–1.06) | 2.54 | 0.11 |
| Left ventricular end-systolic volume index (per 10 ml/m2) | 0.99 (0.85–1.16) | 0.007 | 0.93 |
| Left ventricular ejection fraction (per 10% change) | 0.96 (0.68–1.35) | 0.06 | 0.80 |
| Left Atrial Measurements | |||
| Maximal LA volume (LAVmax, in ml/m2) | 1.03 (1.01–1.06) | 10.84 | 0.001 |
| Minimal LA volume (LAVmin, in ml/m2) | 1.05 (1.02–1.09) | 18.61 | <0.0001 |
| Total left atrial emptying function (%) | 0.93 (0.89–0.97) | 18.86 | <0.0001 |
| Passive left atrial emptying function (%) | 0.96 (0.91–1.00) | 3.62 | 0.057 |
| Contractile left atrial emptying function (%) | 0.90 (0.85–0.95) | 20.57 | <0.0001 |
| Presence of left atrial LGE | 25.26 (7.08–90.08) | 31.89 | <0.0001 |
| Number of segments with left atrial LGE | 1.87 (1.41–2.47) | 36.22 | <0.0001 |
| Quantitative left atrial LGE (%) | 1.06 (1.03–1.08) | 36.22 | <0.0001 |
Likelihood ratio unavailable due to too few events for comparison.
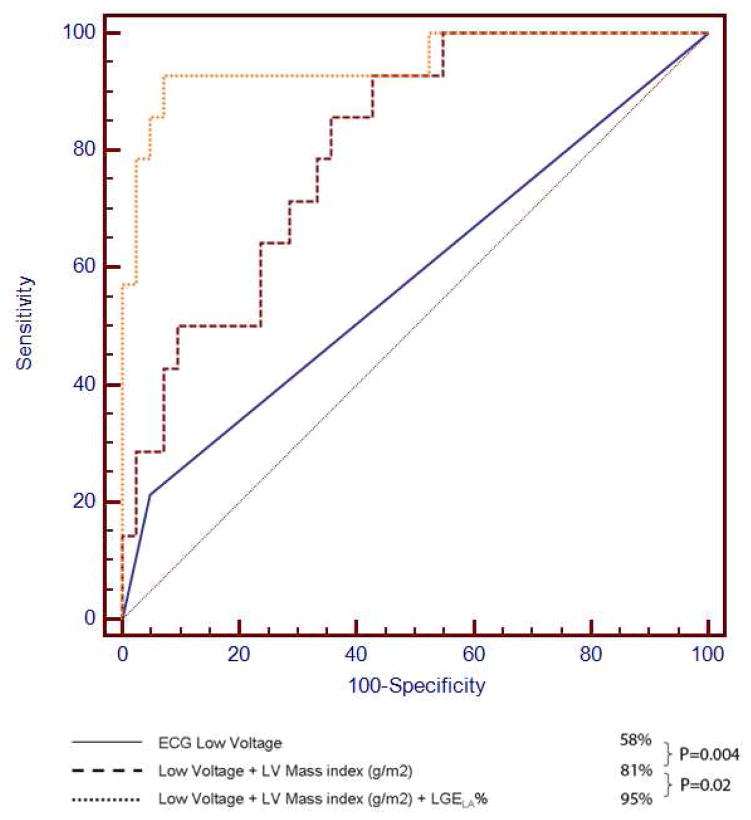
When all variables presented in Table 2 were considered in stepwise regression analysis, LGELA% was selected as the strongest multivariable predictor in the best overall model of CA diagnosis. Indeed, no other variable reached the level of significance (P<0.05) to enter the 11 model after LGELA% was selected, leaving LGELA% as the only variable selected to form the best final model for CA diagnosis. We used the ROC analysis to determine the optimal LGELA% cut points that demonstrated the highest overall diagnostic accuracy for CA diagnosis. We found that LGELA% ≥ 33% (or ≥ 3 out of 9) produced the highest diagnostic utility for CA (sensitivity 76%, specificity 94%). Figure 6 demonstrates the ROC curve demonstrating not only the strong association of LGELA% with CA diagnosis (AUC 95%, P=0.0004), but also the improvement in predicting CA diagnosis beyond clinical variables, such as low voltage by ECG and indexed LV mass (AUC 95% vs. 82%, P=0.02).
Figure 6.
Receiver operating characteristic analysis comparing LGELA%, LV mass, and low voltage ECG in diagnosing cardiac amyloidosis. LGELA% provided additional diagnostic value above LV mass 18 and low voltage ECG in diagnosing patients with cardiac amyloidosis. ECG = electrocardiogram, LV = left ventricular.
Since cardiac amyloidosis may mimic hypertensive heart disease in morphologic appearance, we performed regression analysis with only the SH patients as the control group. Using the same multivariable regression analysis to build the best overall model for prediction of a diagnosis of CA, LGELA% again was selected to be the strongest adjusted predictor. Once LGELA% was selected, no other variables were added to the model. For every LA segment with LGE, on average, there was a 1.9 -fold increase in the odds of CA diagnosis. By ROC analysis, LGE involvement of ≥3 LA segments was the optimal cut point, corresponding to a sensitivity of 76% and specificity of 94% for CA diagnosis.
Inter- and intra-observer variability of left atrial metrics were assessed in a subset of 25 CMR studies. There were high inter- and intra-observer correlations in quantifying LA volume (kappa statistics of 0.83 and 0.89, respectively) across the three time phases of the cardiac cycle. There were moderate inter- and intra-observer correlations in quantifying LGELA% (kappa statistic of 0.70 and 0.77, respectively).
DISCUSSION
The present study is the first comprehensive evaluation of left atrial pathology in cardiac amyloidosis using contrast-enhanced CMR. We report the following findings: 1) extensive LGE involvement of the LA myocardium in association with a marked reduction of LAEFContractile is a prevalent feature of patients with cardiac amyloidosis characterized by CMR, 2) while common clinical and ECG features could not differentiate CA and control patients, semi-quantitative measurement of LGE within the LA can achieve high diagnostic performance for the diagnosis of CA.
Atrial enhancement by CMR has been reported previously only in case reports of cardiac amyloidosis.12 In the present study, we show that atrial enhancement is common; that it is associated with LA dysfunction, and that it is independent of global LV systolic function but related to atrial amyloid infiltration as visualized by atrial LGE. Similar results regarding atrial dysfunction were reported by Modesto et al,13 using tissue Doppler-derived echocardiographic atrial strain imaging. However, the etiology of the LA dysfunction in this study could not be evaluated, due to limitation in evaluation of tissue characteristics by echocardiography. In the present study, we not only confirm that atrial dysfunction is a common finding in cardiac amyloidosis, but also report that CMR is able to demonstrate features strongly suggestive of LA infiltration, which in turn is strongly associated with impairment in LA emptying function. Pathologic examination of patients with cardiac amyloidosis often demonstrate an irregular surface of the atrial endocardium due to amyloid deposits, thereby producing a potential nidus for thrombus formation. In addition, if nephrotic syndrome is present, as often occurs in AL amyloidosis, there may be an associated hypercoagulable state. Atrial failure is associated with blood stasis and consequent increased risk of thrombus formation. Therefore, our findings provide insight into the observation that patients with cardiac amyloidosis have a high prevalence of atrial thrombi, even in the presence of normal sinus rhythm.
Although we postulate that LA LGE and LA dysfunction in cardiac amyloidosis increases the risk of LA thrombus formation, we did not visualize left atrial thrombus in any of the patients studied. However, several of these patients were already therapeutically anticoagulated with warfarin, and the MR sequence used in this study was not optimal for visualization of a small atrial thrombus. Based on the current data, no conclusion can be drawn about the diagnostic utility of the current techniques at different stages or subtypes of cardiac amyloidosis. However, there are already sensitive tools for typing the precursor protein in amyloidosis and, as the final diagnosis rests upon a positive biopsy, amyloid subtyping can be performed on biopsy tissue to ensure appropriate classification and treatment. Our study is also limited by a lack of correlative serum/plasma biomarkers including natriuretic peptides, which may provide useful insights regarding the systemic impact of left atrial functional impairment and infiltration observed by CMR. Finally, we did not perform strain or strain rate analysis by echocardiography on all patients within our cohort. Strain analysis has shown encouraging results for the diagnosis of amyloidosis.14,15 Therefore, future evaluation would be required to demonstrate any improvement of diagnostic accuracy by atrial CMR phenotypes on strain-based imaging in patients with suspected CA.
Acknowledgments
FUNDING SOURCES
Dr. Kwong is supported by a NIH grant R01-HL091157 and a research grant from Astellas Pharmaceuticals.
Footnotes
DISCLOSURES
Dr. Heydari is supported by a Clinical Fellowship Award from the Alberta Heritage Foundation for Medical Research. All other authors have no financial disclosures relevant to the content of this manuscript.
Publisher's Disclaimer: This is a PDF file of an unedited manuscript that has been accepted for publication. As a service to our customers we are providing this early version of the manuscript. The manuscript will undergo copyediting, typesetting, and review of the resulting proof before it is published in its final citable form. Please note that during the production process errors may be discovered which could affect the content, and all legal disclaimers that apply to the journal pertain.
References
- 1.Maceira AM, Joshi J, Prasad SK, Moon JC, Perugini E, Harding I, Sheppard MN, Poole-Wilson PA, Hawkins PN, Pennell DJ. Cardiovascular Magnetic Resonance in Cardiac Amyloidosis. Circulation. 2005;111:186–193. doi: 10.1161/01.CIR.0000152819.97857.9D. [DOI] [PubMed] [Google Scholar]
- 2.Syed IS, Glockner JF, Feng D, Araoz PA, Martinez MW, Edwards WD, Gertz MA, Dispenzieri A, Oh JK, Bellavia D, Tajik AJ, Grogan M. Role of cardiac magnetic resonance imaging in the detection of cardiac amyloidosis. JACC Cardiovasc Imaging. 2010;3:155–164. doi: 10.1016/j.jcmg.2009.09.023. [DOI] [PubMed] [Google Scholar]
- 3.Austin BA, Tang WH, Rodriguez ER, Tan C, Flamm SD, Taylor DO, Starling RC, Desai MY. Delayed hyper-enhancement magnetic resonance imaging provides incremental diagnostic and prognostic utility in suspected cardiac amyloidosis. JACC Cardiovasc Imaging. 2009;2:1369–1377. doi: 10.1016/j.jcmg.2009.08.008. [DOI] [PubMed] [Google Scholar]
- 4.Wassmuth R, Abdel-Aty H, Bohl S, Schulz-Menger J. Prognostic impact of T2-weighted CMR imaging for cardiac amyloidosis. Eur Radiol. 2011;21:1643–1650. doi: 10.1007/s00330-011-2109-3. [DOI] [PubMed] [Google Scholar]
- 5.Smith TJ, Kyle RA, Lie JT. Clinical significance of histopathologic patterns of cardiac amyloidosis. Mayo Clin Proc. 1984;59:547–555. doi: 10.1016/s0025-6196(12)61493-1. [DOI] [PubMed] [Google Scholar]
- 6.Feng D, Edwards WD, Oh JK, Chandrasekaran K, Grogan M, Martinez MW, Syed IS, Hughes DA, Lust JA, Jaffe AS, Gertz MA, Klarich KW. Intracardiac thrombosis and embolism in patients with cardiac amyloidosis. Circulation. 2007;116:2420–2426. doi: 10.1161/CIRCULATIONAHA.107.697763. [DOI] [PubMed] [Google Scholar]
- 7.Mohty D, Pibarot P, Dumesnil JG, Darodes N, Lavergne D, Echahidi N, Virot P, Bordessoule D, Jaccard A. Left atrial size is an independent predictor of overall survival in patients with primary systemic amyloidosis. Arch Cardiovasc Dis. 2011;104:611–618. doi: 10.1016/j.acvd.2011.10.004. [DOI] [PubMed] [Google Scholar]
- 8.Kim RJ, Fieno DS, Parrish TB, Harris K, Chen EL, Simonetti O, Bundy J, Finn JP, Klocke FJ, Judd RM. Relationship of MRI delayed contrast enhancement to irreversible injury, infarct age, and contractile function. Circulation. 1999;100:1992–2002. doi: 10.1161/01.cir.100.19.1992. [DOI] [PubMed] [Google Scholar]
- 9.Rivas-Gotz C, Manolios M, Thohan V, Nagueh SF. Impact of left ventricular ejection fraction on estimation of left ventricular filling pressures using tissue Doppler and flow propagation velocity. Am J Cardiol. 2003;91:780–784. doi: 10.1016/s0002-9149(02)03433-1. [DOI] [PubMed] [Google Scholar]
- 10.Ujino K, Barnes ME, Cha SS, Langins AP, Bailey KR, Seward JB, Tsang TS. Two-dimensional echocardiographic methods for assessment of left atrial volume. Am J Cardiol. 2006;98:1185–1188. doi: 10.1016/j.amjcard.2006.05.040. [DOI] [PubMed] [Google Scholar]
- 11.Abhayaratna WP, Seward JB, Appleton CP, Douglas PS, Oh JK, Tajik AJ, Tsang TS. Left atrial size: physiologic determinants and clinical applications. J Am Coll Cardiol. 2006;47:2357–2363. doi: 10.1016/j.jacc.2006.02.048. [DOI] [PubMed] [Google Scholar]
- 12.Lyne JC, Petryka J, Pennell DJ. Atrial enhancement by cardiovascular magnetic resonance in cardiac amyloidosis. Eur Heart J. 2008;29:212. doi: 10.1093/eurheartj/ehm351. [DOI] [PubMed] [Google Scholar]
- 13.Modesto KM, Dispenzieri A, Cauduro SA, Lacy M, Khandheria BK, Pellikka PA, Belohlavek M, Seward JB, Kyle R, Tajik AJ, Gertz M, Abraham TP. Left atrial myopathy in cardiac amyloidosis: implications of novel echocardiographic techniques. Eur Heart J. 2005;26:173–179. doi: 10.1093/eurheartj/ehi040. [DOI] [PubMed] [Google Scholar]
- 14.Liu D, Hu K, Niemann M, Herrmann S, Cikes M, Stork S, Gaudron PD, Knop S, Ertl G, Bijnens B, Weidemann F. Effect of combined systolic and diastolic functional parameter assessment for differentiation of cardiac amyloidosis from other causes of concentric left ventricular hypertrophy. Circ Cardiovasc Imaging. 2013;6:1066–1072. doi: 10.1161/CIRCIMAGING.113.000683. [DOI] [PubMed] [Google Scholar]
- 15.Sun JP, Stewart WJ, Yang XS, Donnell RO, Leon AR, Felner JM, Thomas JD, Merlino JD. Differentiation of hypertrophic cardiomyopathy and cardiac amyloidosis from other causes of ventricular wall thickening by two-dimensional strain imaging echocardiography. Am J Cardiol. 2009;103:411–415. doi: 10.1016/j.amjcard.2008.09.102. [DOI] [PubMed] [Google Scholar]


