Abstract
Daily rhythmicity in the locomotor activity of laboratory animals has been studied in great detail for many decades, but the daily pattern of locomotor activity has not received as much attention in humans. We collected waist-worn accelerometer data from more than 2,000 individuals from five countries differing in socioeconomic development and conducted a detailed analysis of human locomotor activity. Body mass index was computed from height and weight. Individual activity records lasting 7 days were subjected to cosinor analysis to determine the parameters of the daily activity rhythm: mesor (mean level), amplitude (half the range of excursion), acrophase (time of the peak), and robustness (rhythm strength). The activity records of all individual participants exhibited statistically significant 24-hour rhythmicity, with activity increasing noticeably a few hours after sunrise and dropping off around the time of sunset, with a peak at 1:42 pm on average. The acrophase of the daily rhythm was comparable in men and women in each country but varied by as much as 3 h from country to country. Quantification of the socioeconomic stages of the five countries yielded suggestive evidence that more developed countries have more obese residents, who are less active, and who are active later in the day than residents from less developed countries. These results provide a detailed characterization of the daily activity pattern of individual human beings and reveal similarities and differences among people from five countries differing in socioeconomic development.
Keywords: Circadian rhythms, behavior, actigraphy, human mobility, cross-national comparison
INTRODUCTION
The locomotor activity of laboratory animals has been studied in great detail for many decades. Research has demonstrated that virtually all animal species exhibit daily variation in the amount of activity and that this variation is generated by an endogenous circadian clock and modulated by environmental cycles, principally the light-dark cycle (Dunlap et al., 2004; Koukkari & Sothern, 2006; Refinetti, 2006). Further, detailed descriptions of the distribution of activity over the hours of a day have been provided for many animal species.
In contrast to the extensive literature on activity rhythms in animals, the daily pattern of locomotor activity has not received much attention in humans. Laboratory studies have occasionally examined human locomotion of a few subjects over days or months (Aschoff et al., 1967; Chandrashekaran et al., 1997; Endo et al., 1999; Gander et al., 1986; Kriebel, 1974; Natale, 2002), and use of ambulatory accelerometer technology more recently has made it possible to monitor the activity of individuals living natural lives for a year or longer, but again with a limited number of subjects (Binkley et al., 1990; Yoneyama et al., 1999). Surveys of sleeping habits have been conducted in numerous countries (Giannotti et al., 2002; Hébert et al., 1998; Horne & Östberg, 1977; Jean-Louis et al., 2000; Laberge et al., 2000; Park et al., 1997; Refinetti, 1995; Roenneberg et al., 2003), thus allowing a gross comparison of activity times around the world, but without real-time resolution. Analysis of mobile phone data has concentrated on mobility patterns rather than on temporal organization (González et al., 2008; Schneider et al., 2013; Song et al., 2010). The lack of large scale studies making use of accelerometer technology, with the same methodology in several countries, has prevented a detailed analysis of daily patterns of locomotor activity and comparison across different human populations.
We took advantage of the accelerometer data obtained from more than 2,000 individuals from five countries as part of the Modeling the Epidemiologic Transition Study (Luke et al., 2011) to conduct a detailed analysis of human locomotor activity. Because the five countries vary greatly in socioeconomic development, we were also able to identify differences in the daily pattern of activity associated with socioeconomic development, as defined by the United Nations’ Human Development Index (HDI)(Barro & Lee, 2011). Additionally, we found differences associated with gender, age, and body mass index.
MATERIALS AND METHODS
Participants
Twenty-five hundred adults of African descent (either living in Africa or emigrants to the Americas in the past 400 years), ages 25–45, were enrolled in the Modeling the Epidemiologic Transition Study (METS) between January 2010 and September 2011 (Luke et al., 2011). Five hundred participants, approximately 50% of whom were female, were enrolled in each of five study sites: rural Ghana, urban South Africa, urban Jamaica, the small island state of Seychelles, and suburban United States (Maywood, a suburb of Chicago). The study sites represented a range of socioeconomic development as defined by the United Nations’ Human Development Index (HDI): Ghana is defined as a high HDI-rank (low development) country, South Africa as middle HDI-rank, Jamaica and Seychelles as low HDI-rank, and the United States as a very low HDI-rank country (Barro & Lee, 2011). In all locations, individuals with obvious infectious diseases and pregnant or lactating women were excluded.
Data collection
Physical activity was assessed using the Actical accelerometer (Phillips Respironics, Bend, OR, USA). The monitor, with dimensions of 29 mm × 37 mm × 11 mm and weighing 16 g, was worn at the waist, positioned just behind the right hip. Participants were asked to wear the monitor at all times for 8 days, except while bathing, showering, or swimming. Reliable accelerometer data, recorded continuously for at least a week with 1-min resolution, were obtained from 2,316 men and women (Table 1).
Table 1.
Country and participant characteristics
| Ghana | South Africa | Jamaica | Seychelles | United States | |
|---|---|---|---|---|---|
| HDI Rank | |||||
| 135 | 123 | 80 | 52 | 4 | |
| Latitude | |||||
| 5° N | 34° S | 18° N | 4° S | 42° N | |
| Men | |||||
| Sample size | 187 | 236 | 178 | 202 | 246 |
| Age (years) | 34.9 ± 6.7 | 33.7 ± 5.6 | 34.2 ± 6.1 | 36.5 ± 5.3 | 42.6 ± 2.4 |
| BMI (kg/m2) | 22.4 ± 3.6 | 22.4 ± 4.3 | 23.6 ± 4.7 | 26.3 ± 4.8 | 30.2 ± 8.7 |
| Sleep duration (h) | 7.7 ± 1.5 | 10.3 ± 1.7 | 7.1 ± 1.7 | 7.1 ± 1.3 | 6.7 ± 1.3 |
| Women | |||||
| Sample size | 255 | 260 | 251 | 248 | 253 |
| Age (years) | 34.2 ± 6.7 | 33.1 ± 6.0 | 34.7 ± 6.2 | 35.6 ± 6.2 | 42.6 ± 2.0 |
| BMI (kg/m2) | 25.8 ± 5.6 | 32.4 ± 9.9 | 29.4 ± 6.8 | 27.4 ± 5.9 | 34.6 ± 13.2 |
| Sleep duration (h) | 8.0 ± 1.4 | 10.4 ± 1.7 | 7.5 ± 1.7 | 7.4 ± 1.2 | 6.8 ± 1.4 |
HDI: Human Development Index
BMI: Body mass index
Values for age, BMI and sleep duration are means ± standard deviations
Height and weight were measured at the initial clinic examination. Weight was measured without shoes with the participant dressed in light clothing to the nearest 0.1 kg using the same model standard calibrated balance at all 5 sites (Seca 770, Hamburg, Germany). Height was measured to the nearest 0.1 cm using a stadiometer (Invicta Stadiometer, Invicta, London, UK) without shoes and with the participant’s head held in the Frankfort plane. During the clinic examination, participants were also asked to report how many hours they usually slept at night.
All protocols for METS were approved by the Institutional Review Board or Ethics Committee of all participating institutions. Written informed consent was obtained from all participants in all study sites. All research methods and procedures meet the ethical standards of the journal as outlined in Portaluppi et al. (2010).
Data analysis
Cosinor analysis (Nelson et al., 1979; Refinetti et al., 2007) was conducted for each of the 2,316 data sets. Cosinor analysis provides the parameters of the daily activity rhythm: mesor (mean level), amplitude (half the range of excursion), acrophase (time of the peak), and robustness (how strong the rhythmic pattern is, calculated as the ratio between the variance accounted for by the cosine fit and the total variance). Period (the duration of each cycle) cannot be meaningfully calculated when the subjects are exposed to a light-dark cycle.
Times of sunrise and sunset for each individual were calculated with basis on the date, latitude, and longitude using the algorithm provided by Time and Date AS (www.timeanddate.com). Body mass index (BMI) for each individual was calculated with basis on body mass and height (mass in kilograms divided by the square of height in meters). Standard statistics were used for group comparisons (two-way ANOVA with country and gender as factors) and for correlations between various quantitative variables (Pearson’s correlation coefficient). To maintain the probability of a Type I error below 0.05 for the whole study, the level of significance was set at 0.001 for each statistical test.
RESULTS
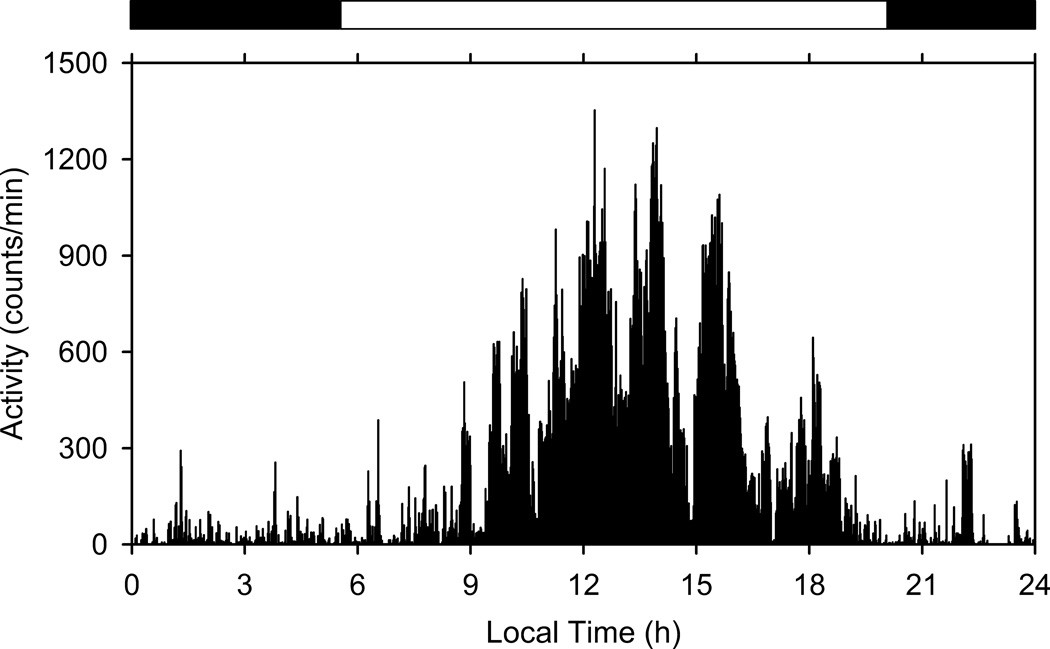
The activity records of all individual participants exhibited statistically significant 24-hour rhythmicity, as determined by cosinor analysis. Typically, activity counts increased noticeably shortly after sunrise and dropped off around the time of sunset (Fig. 1). Rhythm robustness was much greater when the data were analyzed as averaged wave forms (with an individual’s records averaged minute-by-minute over the seven days) than when they were analyzed as raw 7-day records, but significant 24-hour rhythmicity was detected in both cases. The variance associated with the rhythmic component accounted for as little as 1% to as much as 23% of the total variance in raw records but was as large as 81% for averaged wave forms.
Fig. 1.
Sample activity record from a waist-worn sensor of an individual subject from the United States (a suburb of Chicago). The data were averaged minute-by-minute over seven consecutive days to yield an average wave form. The horizontal dark and white bars at the top denote the duration of night and day, respectively. A clear daily pattern of activity is evident, with more activity during the day than during the night. Cosinor analysis of the averaged wave form indicated the presence of significant 24-h rhythmicity (p < 0.000001) with acrophase at 13.5 h (1:30 pm). The cosine pattern accounted for 53% of the total variance.
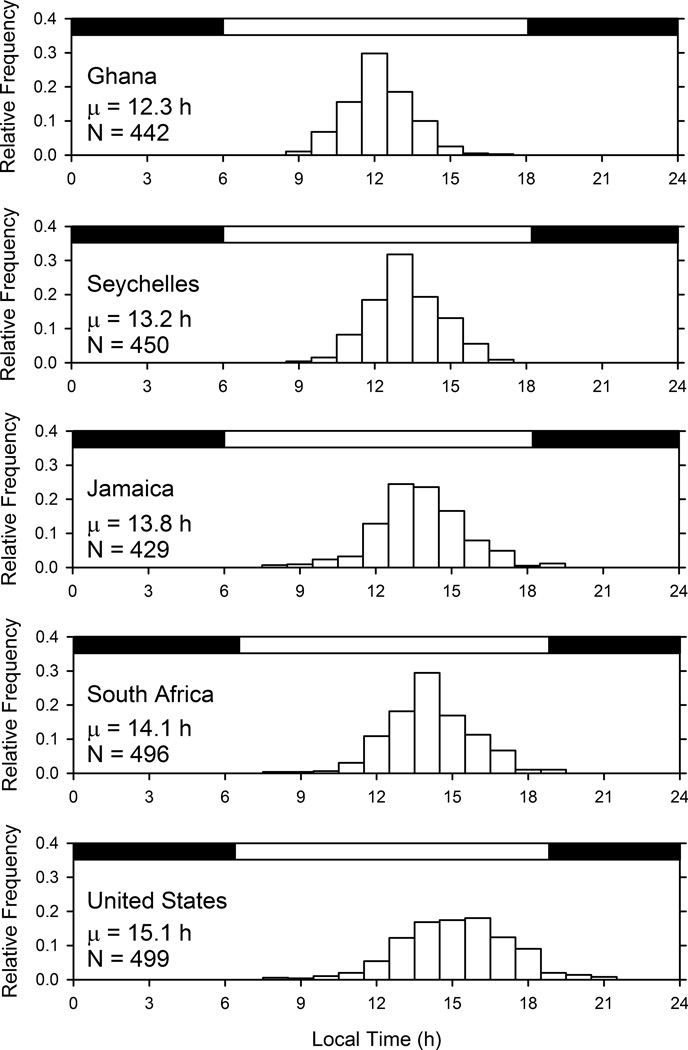
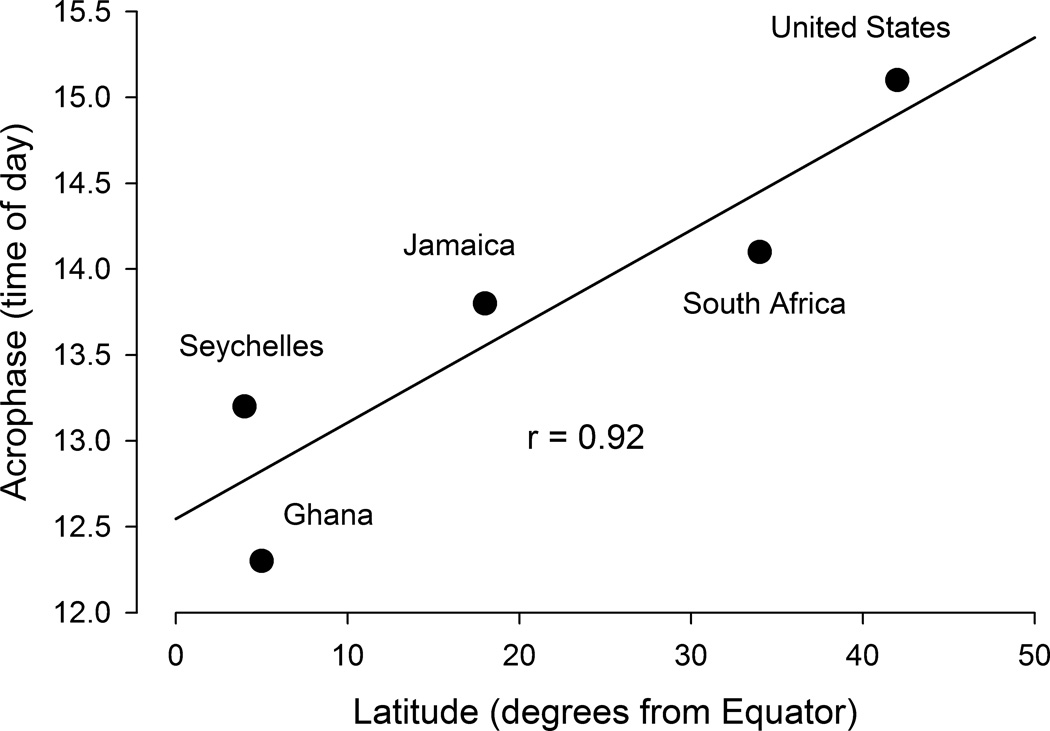
The acrophase of the daily rhythm (i.e., the time of the daily peak in activity) varied significantly from one national group to another (Fig. 2). The activity rhythm peaked progressively earlier in Ghanaians than in citizens of Seychelles, Jamaica, South Africa, and the United States. A two-way ANOVA for acrophase (with country and gender as factors) revealed a strong significant effect of country (F (4, 2306) = 146.28, p < 0.0001), a weaker effect of gender (F (1, 2306) = 6.095, p = 0.014) that was not significant after correction for multiple testing, and no significant interaction between country and gender (F (4, 2306) = 2.059, p = 0.084). The inter-country standard deviation of mean acrophases was 1.1 h, a little smaller than the 1.7 h average intra-country standard deviation of acrophases. The mean acrophase for the countries (in hours) correlated positively with their latitudes (in degrees, discarding whether north or south) (Fig. 3).
Fig. 2.
Relative frequency distributions of acrophases of the activity rhythm (measured with waist-worn accelerometers) in the five countries. Class sizes are 1 hour. The horizontal dark and white bars at the top of each panel denote the average duration of night and day at that location. The mean acrophase for each country (in hours of local time) is shown under the country’s name.
Fig. 3.
Linear regression of acrophase on latitude for the five countries. There is a strong positive correlation between acrophase and latitude (r = 0.915, p = 0.028).
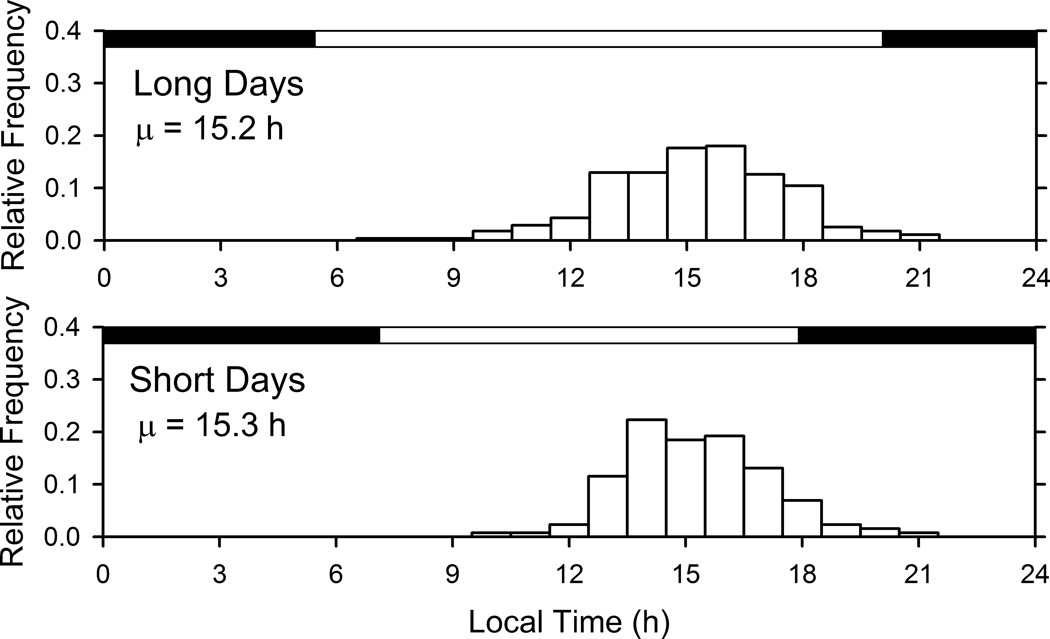
While day length varied an hour or less over the year for residents of Ghana and Seychelles, the variation was greater in Jamaica, South Africa, and the United States. To verify whether variations in day length affected the acrophases of individuals tested at different times of the year, the relative frequency of acrophases in the United States (the country with the greatest summer-winter difference in day length) was compared between long days (late spring, summer, and early autumn) and short days (late autumn, winter, and early spring). The results showed that day length had a negligible effect on the acrophase of the activity rhythm (Fig. 4). This was further confirmed by the computation of correlations between acrophase and sunrise (and between acrophase and sunset) for subjects of each country. The correlations were very small (averaging 0.03) and not statistically significant, despite the high statistical power resulting from the large sample sizes (averaging 463 individuals per country) (Table 2). A similar analysis for a rural population such as that of Ghana was not possible because there is very little seasonal variation in photoperiod in countries close to the Equator.
Fig. 4.
Relative frequency distributions of acrophases of the activity rhythm (measured with waist-worn accelerometers) in the United States during long days of late spring, summer, and early autumn (14.3 hours of light per day, N = 278) and short days of late autumn, winter, and early spring (10.7 hours of light per day, N = 130). The spread of the distributions, and the modal and mean acrophases, are similar despite the difference in day length.
Table 2.
Correlations between various variables in the study.
| Age × Mesor | Age × Amplitude | Age × Acrophase | Age × Robustness | |
| Ghana | 0.032 | 0.050 | −0.270* | 0.107 |
| Jamaica | 0.024 | 0.020 | −0.286* | 0.119 |
| United States | 0.007 | −0.026 | −0.023 | −0.045 |
| South Africa | −0.046 | −0.027 | −0.265* | 0.049 |
| Seychelles | −0.011 | −0.047 | −0.082 | 0.032 |
| BMI × Mesor | BMI × Amplitude | BMI × Acrophase | BMI × Robustness | |
| Ghana | −0.245* | −0.224* | −0.110 | −0.010 |
| Jamaica | −0.205* | −0.197* | −0.088 | −0.004 |
| United States | −0.173* | −0.162* | −0.017 | 0.011 |
| South Africa | −0.263* | −0.256* | −0.004 | 0.043 |
| Seychelles | −0.152* | −0.136* | 0.007 | 0.082 |
| Acrophase × Sunrise |
Acrophase × Sunset |
Sleep Duration × Mesor |
Sleep Duration × BMI |
|
| Ghana | −0.006 | −0.060 | −0.035 | −0.128 |
| Jamaica | 0.014 | −0.004 | −0.018 | −0.020 |
| United States | −0.005 | 0.052 | 0.041 | −0.088 |
| South Africa | 0.125 | −0.109 | −0.086 | −0.102 |
| Seychelles | −0.003 | 0.006 | −0.076 | −0.065 |
All values are Pearson correlation coefficients.
Asterisk denotes p < 0.001.
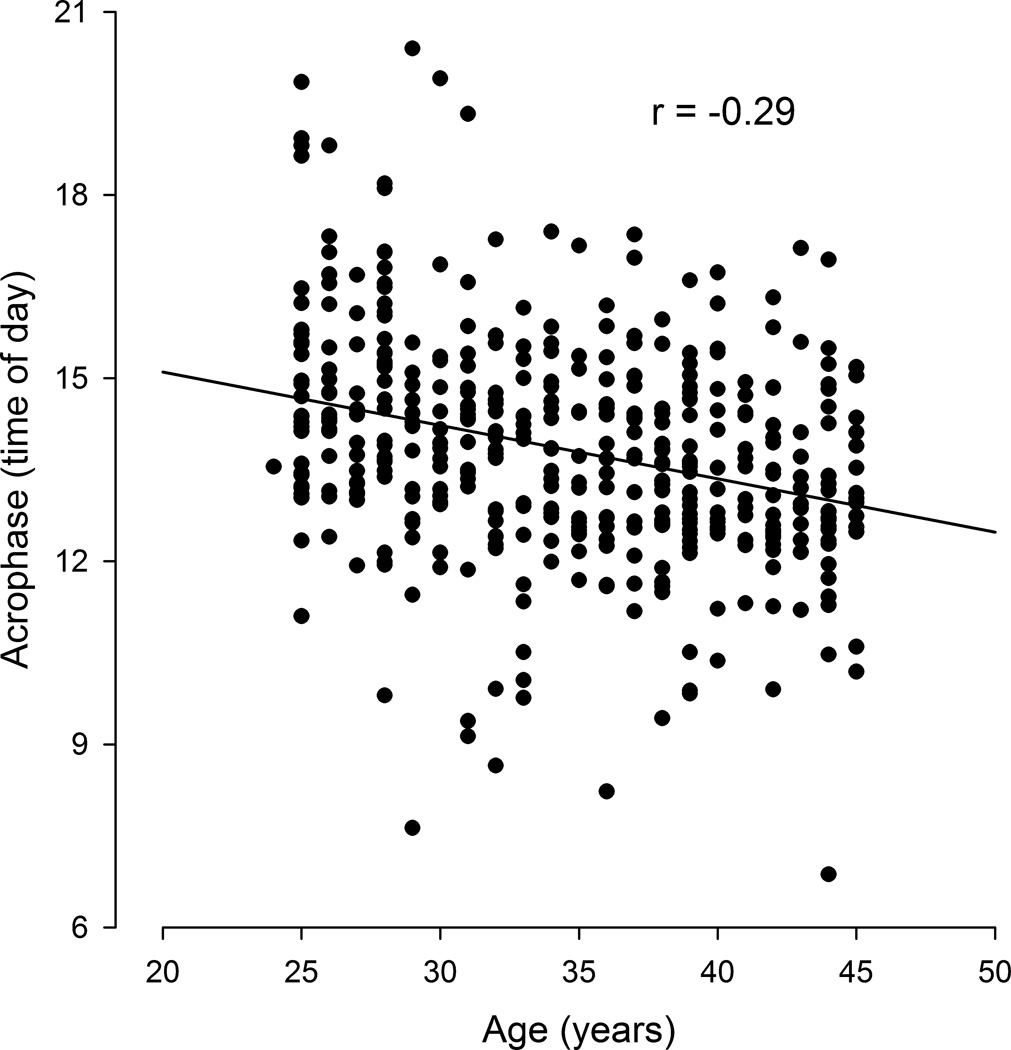
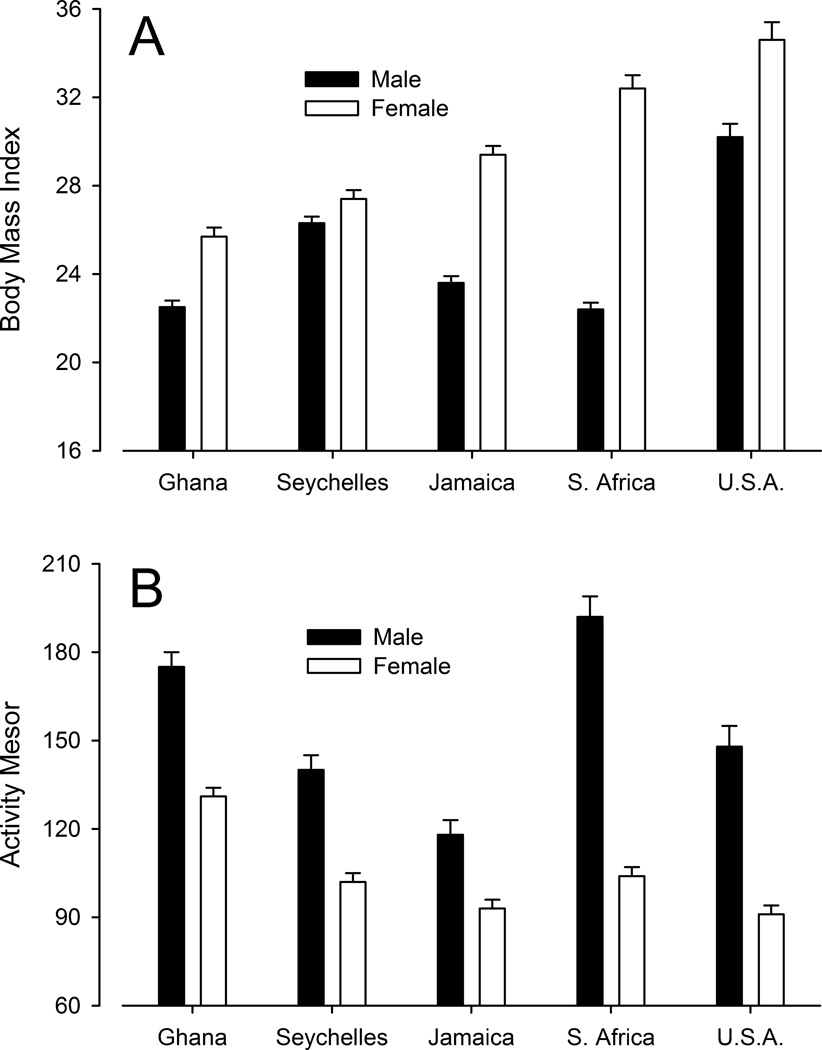
In three of the countries, the acrophase varied with age: older people (within the 25–45 year-old range covered in this study) tended to be active earlier than younger people (Table 2, Fig. 5). In addition to the acrophase, two other variables varied significantly between countries: body mass index and the mean level of activity (activity mesor) (Fig. 6). Men were consistently leaner than women (lower BMI) in the five countries, the difference being particularly noticeable in South Africa. Women were on average overweight (BMI > 25) in all five countries, with women from the United States leading the group and followed by women from South Africa, Jamaica, Seychelles, and Ghana. Men were also consistently more active than women (higher activity mesor) in the five groups, with the most extreme difference being again among South Africans (Fig. 6). The activity mesor varied significantly from group to group, although not in the same order as for BMI. Nonetheless, there was a modest but significant negative correlation between BMI and activity mesor in each country (Table 2). The lower activity mesor in individuals with higher BMI was not associated with shorter sleep time, as self-reported sleep time did not correlate significantly with activity mesor or BMI (Table 2).
Fig. 5.
Linear regression of acrophase on age in Jamaica. There is a moderate but significant negative correlation between acrophase and age (r = −0.29, N = 429, p < 0.001).
Fig. 6.
Mean (± SEM) body mass index (Panel A) and activity mesor (Panel B) for males and females in each of the five countries. A two-way ANOVA for body mass index revealed a significant effect of country (F (4, 2306) = 73.00, p < 0.0001), of gender (F (1, 2306) = 227.19, p < 0.0001), and of their interaction (F (4, 2306) = 30.30, p < 0.0001). Likewise, a two-way ANOVA for activity mesor revealed a significant effect of country (F (4, 2306) = 31.72, p < 0.0001), of gender (F (1, 2306) = 298.44, p < 0.0001), and of their interaction (F (4, 2306) = 13.31, p < 0.0001).
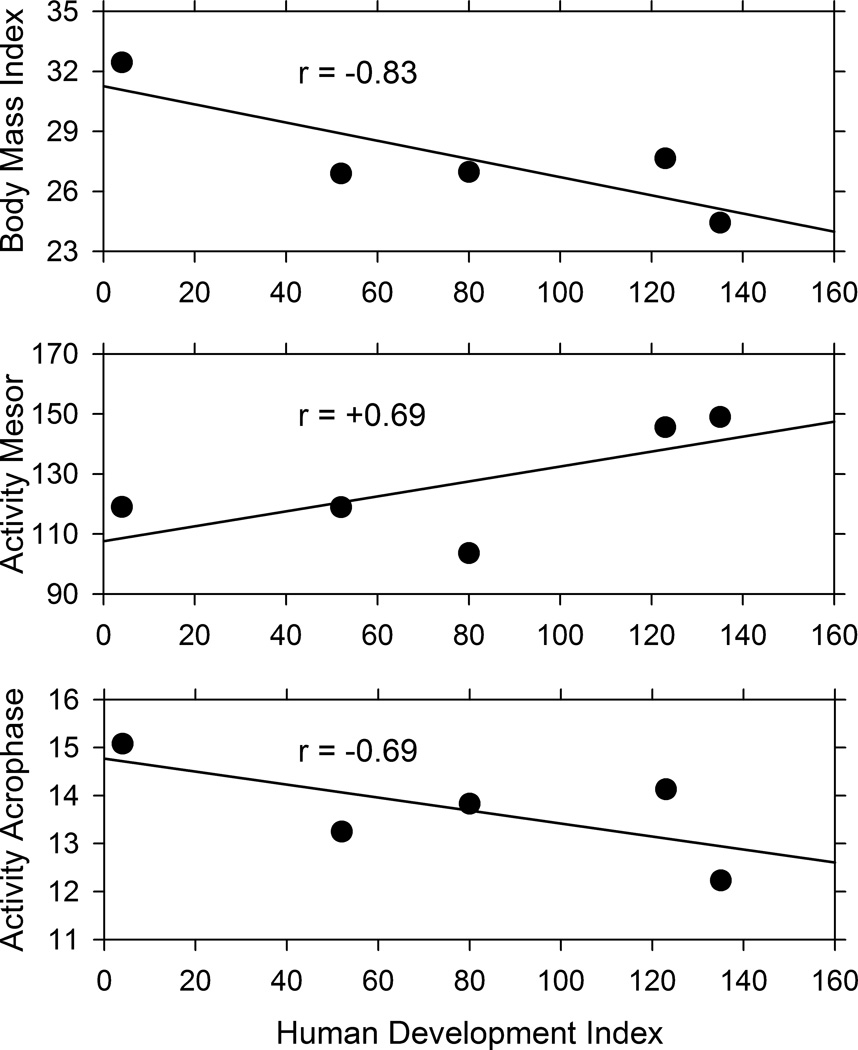
When the five nationalities were arranged by their HDI rankings, suggestive cross-national trends were observed. Particularly noteworthy were a negative correlation between BMI and HDI rank, a positive correlation between activity mesor and HDI rank, and a negative correlation between activity acrophase and HDI rank (Fig. 7). These correlations suggest that more developed countries (with lower HDI ranks) have more obese residents (with higher BMI scores), who are less active (lower activity mesor), and who are active later in the day (later acrophase). Because the correlations involve only five countries, the evidence is only suggestive, as correlation coefficients with five data points must be as extreme as 0.88 to reach statistical significance.
Fig. 7.
Linear regression of body mass index, activity mesor, and activity acrophase on the human development index rank of the five countries represented in this study. The countries, from left to right, are the United States, Seychelles, Jamaica, South Africa, and Ghana.
DISCUSSION
Consistent with the vast literature on animal locomotor activity (Dunlap et al., 2004; Koukkari & Sothern, 2006; Refinetti, 2006), our data from 2,316 men and women document robust daily rhythmicity at the individual level, with higher activity levels during the hours of sunlight. The average acrophase (time of peak activity) was 13.7 h (1:42 pm), with a difference of 2.9 h between Ghana and the United States. The timing of behavior at a given location was determined by social time (local clock time) and was not affected by seasonal variations in the times of sunrise and sunset. Nonetheless, people living farther from the Equator tended to be active later in the day, as has been previously observed in Brazil (Miguel et al., 2014) and part of Russia (Borisenkov, 2011). Differences in acrophase related to latitude and photoperiod may be partly confounded by the fact that people in many countries near the Equator tend to include a majority of persons who time their daily work activities according to sunlight (such as farmers in Ghana), whereas people in countries farther from the Equator are often engaged in time-fixed office or industry occupations (such as urban dwellers in the United States). Another confounding factor may be the admixture of European ancestry with African ancestry in the African-American population. Not only is the United States (Chicago) the northernmost location in this study, but it is also a country where Blacks have approximately 15% European ancestry, which is relevant because Europeans have a slightly longer circadian period than Africans do and, consequently, are expected to have later acrophases (Eastman et al., 2015).
In three of the countries, older people tended to be active earlier than younger people (within the 25–45 year-old range covered in this study). This observation is consistent with findings of survey studies of human chronotypes, in which a gradual advance in wake-up and bed times in older individuals has been repeatedly observed (Roenneberg et al., 2007). It is not evident why the age effect was not observed in residents from the United States and Seychelles, but, because these are the two countries with highest socioeconomic development (lowest HDI ranks), it is possible that aging effects do not become noticeable until later in life in these countries. Also, it is possible that younger people are engaged more often that older people in time-fixed office or industry occupations in countries where a large segment of the workforce is engaged in farming or non-formal occupations (thus contrasting Ghana with the United States and Seychelles).
Differences between nationalities were also found in BMI and activity mesor (mean level of activity). Differences in BMI in this cohort have been previously described (Luke et al., 2014). When activity was quantified with discrete categories applied to waking hours, the relationship between BMI and activity was not consistently identified within each country (Luke et al., 2014), but cosinor analysis in the present study allowed the identification of modest yet significant negative correlations between BMI and activity mesor in all five countries. Of course, the direction of causality cannot be determined from these cross-sectional data. Overweight and obesity may induce a reduction in locomotor activity, or reduced activity may lead to energy conservation and weight gain. Either way, our data indicate that only 4% of the variance in one variable is explained by the other variable.
The large (though not significant) correlations that we found between BMI and HDI rank, between activity mesor and HDI rank, and between activity acrophase and HDI rank across the five national groups suggest that more developed countries have more obese residents, who are less active, and who are active later in the day. The distribution of work types (e.g., farmer vs. office worker) varies in countries with different HDI ranks and may partially account for the observed correlations. The higher incidence of obesity in developed countries has been widely reported in characterizations of the metabolic syndrome (Spalding et al., 2009), and a reduction in physical activity accompanying the progression of the metabolic syndrome has been documented as well (Church et al., 2011). The finding that individuals in more developed countries are phase-delayed compared to individuals in less developed countries is novel, however. The availability of electricity for night-time illumination could be a contributing factor for the later acrophase in more developed countries. In less developed countries such as Ghana, 30% to 40% of the population does not have access to electricity (Energy Information Administration, 2014). Studies involving a larger number of countries across the HDI range would be necessary to confirm the correlation found here and to evaluate possible mechanisms responsible for it. In such studies, attention should be paid to differences in the occupations of the participants (such as farmers versus office workers).
Acknowledgments
MS was supported by a Fulbright Scholar grant from the U.S. Council for International Exchange of Scholars. The Modeling the Epidemiologic Transition Study is funded in part by the National Institutes of Health (1R01DK080763).
Footnotes
DECLARATION OF INTEREST
The authors report no conflicts of interest.
REFERENCES
- Aschoff J, Gerecke U, Wever R. Desynchronization of human circadian rhythms. Jap J Physiol. 1967;17:450–457. doi: 10.2170/jjphysiol.17.450. [DOI] [PubMed] [Google Scholar]
- Barro RJ, Lee JW. The National Bureau of Economic Research; 2011. A New Data Set of Educational Attainment in the World, 1950–2010. Working Paper No. 15902. [Google Scholar]
- Binkley S, Tome MB, Crawford D, Mosher K. Human daily rhythms measured for one year. Physiol Behav. 1990;48:293–298. doi: 10.1016/0031-9384(90)90316-v. [DOI] [PubMed] [Google Scholar]
- Borisenkov MF. The pattern of entrainment of the human sleep-wake rhythm by the natural photoperiod in the North. Chronobiol Int. 2011;28:921–929. doi: 10.3109/07420528.2011.623978. [DOI] [PubMed] [Google Scholar]
- Chandrashekaran MK, Marimuthu G, Geetha L. Correlations between sleep and wake in internally synchronized and desynchronized circadian rhythms in humans under prolonged isolation. J Biol Rhythms. 1997;12:26–33. doi: 10.1177/074873049701200105. [DOI] [PubMed] [Google Scholar]
- Church TS, Thomas DM, Tudor-Locke C, Katzmarzyk PT, Earnest CP, Rodarte RQ, Martin CK, Blair SN, Bouchard C. Trends over 5 decades in U.S. occupation-related physical activity and their associations with obesity. PLoS One. 2011;6:e19657. doi: 10.1371/journal.pone.0019657. [DOI] [PMC free article] [PubMed] [Google Scholar]
- Dunlap JC, Loros JJ, DeCoursey PJ. Chronobiology: Biological Timekeeping. Sunderland, MA: Sinauer; 2004. [Google Scholar]
- Eastman CI, Suh C, Tomaka VA, Crowley SJ. Circadian rhythm phase shifts and endogenous free-running circadian period differ between African-Americans and European-Americans. Sci Rep. 2015;5:8381. doi: 10.1038/srep08381. [DOI] [PMC free article] [PubMed] [Google Scholar]
- Endo T, Honma S, Hashimoto S, Honma K. After-effect of entrainment on the period of human circadian system. Jap J Physiol. 1999;49:425–430. doi: 10.2170/jjphysiol.49.425. [DOI] [PubMed] [Google Scholar]
- Energy Information Administration. Washington, DC: U.S. Department of Energy; 2014. Country Analysis: Ghana. http://www.eia.gov/countries/country-data.cfm?fips=gh. [Google Scholar]
- Gander PH, Connell LJ, Graeber RC. Masking of the circadian rhythm of heart rate and core temperature by the rest-activity cycle in man. J Biol Rhythms. 1986;1:119–135. doi: 10.1177/074873048600100203. [DOI] [PubMed] [Google Scholar]
- Giannotti F, Cortesi F, Sebastiani T, Ottaviano S. Circadian preference, sleep and daytime behaviour in adolescence. J Sleep Res. 2002;11:191–199. doi: 10.1046/j.1365-2869.2002.00302.x. [DOI] [PubMed] [Google Scholar]
- González MC, Hidalgo CA, Barabási AL. Understanding individual human mobility patterns. Nature. 2008;453:779–782. doi: 10.1038/nature06958. [DOI] [PubMed] [Google Scholar]
- Hébert M, Dumont M, Paquet J. Seasonal and diurnal patterns of human illumination under natural conditions. Chronobiol Int. 1998;15:59–70. doi: 10.3109/07420529808998670. [DOI] [PubMed] [Google Scholar]
- Horne JA, Östberg O. Individual differences in human circadian rhythms. Biol Psychol. 1977;5:179–190. doi: 10.1016/0301-0511(77)90001-1. [DOI] [PubMed] [Google Scholar]
- Jean-Louis G, Kripke DF, Ancoli-Israel S, Klauber MR, Sepulveda RS. Sleep duration, illumination, and activity patterns in a population sample: effects of gender and ethnicity. Biol Psychiatry. 2000;47:921–927. doi: 10.1016/s0006-3223(99)00169-9. [DOI] [PubMed] [Google Scholar]
- Koukkari WL, Sothern RB. Introducing Biological Rhythms. New York: Springer; 2006. [Google Scholar]
- Kriebel J. Changes in internal phase relationships during isolation. In: Scheving LE, Halberg F, Pauly JE, editors. Chronobiology. Tokyo: Igaku Shoin; 1974. pp. 451–459. [Google Scholar]
- Laberge L, Carrier J, Lespérance P, Lambert C, Vitaro F, Tremblay RE, Montplaisir J. Sleep and circadian phase characteristics of adolescent and young adult males in a naturalistic summertime condition. Chronobiol Int. 2000;17:489–501. doi: 10.1081/cbi-100101059. [DOI] [PubMed] [Google Scholar]
- Luke A, Bovet P, Forrester TE, Lambert EV, Plange-Rhule J, Schoeller DA, Dugas LR, Durazo-Arvizu RA, Shoham D, Cooper RS, Brage S, Ekelund U, Steyn NP. Protocol for the modeling the epidemiologic transition study: a longitudinal observational study of energy balance and change in body weight, diabetes and cardiovascular disease risk. BMC Public Health. 2011;11:927. doi: 10.1186/1471-2458-11-927. [DOI] [PMC free article] [PubMed] [Google Scholar]
- Luke A, Bovet P, Plange-Rhule J, Forrester TE, Lambert EV, Schoeller DA, Dugas LR, Durazo-Arvizu RA, Shoham DA, Cao G, Brage S, Ekelund U, Cooper RS. A mixed ecologic-cohort comparison of physical activity and weight among young adults from five populations of African origin. BMC Public Health. 2014;14:397. doi: 10.1186/1471-2458-14-397. [DOI] [PMC free article] [PubMed] [Google Scholar]
- Miguel M, Oliveira VC, Pereira D, Pedrazzoli M. Detecting chronotype differences associated to latitude: a comparison between Horne-Östberg and Munich Chronotype questionnaires. Ann Hum Biol. 2014;41:105–108. doi: 10.3109/03014460.2013.832795. [DOI] [PubMed] [Google Scholar]
- Natale V. Circadian motor asymmetries in humans. Neurosci Lett. 2002;320:102–104. doi: 10.1016/s0304-3940(02)00031-9. [DOI] [PubMed] [Google Scholar]
- Nelson W, Tong YL, Lee JK, Halberg F. Methods for cosinor rhythmometry. Chronobiologia. 1979;6:305–323. [PubMed] [Google Scholar]
- Park YM, Matsumoto K, Seo YJ, Shinkoda H. Scores on morningness-eveningness and sleep habits of Korean students, Japanese students, and Japanese workers. Percept Mot Skills. 1997;85:143–154. doi: 10.2466/pms.1997.85.1.143. [DOI] [PubMed] [Google Scholar]
- Portaluppi F, Smolensky MH, Touitou Y. Ethics and methods for biological rhythm research on animals and human beings. Chronobiol Int. 2010;27:1911–1929. doi: 10.3109/07420528.2010.516381. [DOI] [PubMed] [Google Scholar]
- Refinetti R. Persistence of synchronization of the daily rhythms of body temperature and sleep-wake in college students. Biol Rhythm Res. 1995;26:532–540. [Google Scholar]
- Refinetti R. Circadian Physiology. 2nd. Boca Raton, Fla: CRC Press; 2006. [Google Scholar]
- Refinetti R, Cornélissen G, Halberg F. Procedures for numerical analysis of circadian rhythms. Biol Rhythm Res. 2007;38:275–325. doi: 10.1080/09291010600903692. [DOI] [PMC free article] [PubMed] [Google Scholar]
- Roenneberg T, Wirz-Justice A, Merrow M. Life between clocks: daily temporal patterns of human chronotypes. J Biol Rhythms. 2003;18:80–90. doi: 10.1177/0748730402239679. [DOI] [PubMed] [Google Scholar]
- Roenneberg T, Kuehnle T, Juda M, Kantermann T, Allebrandt K, Gordijn M, Merrow M. Epidemiology of the human circadian clock. Sleep Med Rev. 2007;11:429–438. doi: 10.1016/j.smrv.2007.07.005. [DOI] [PubMed] [Google Scholar]
- Schneider CM, Belik V, Couronné T, Smoreda Z, González MC. Unravelling daily human mobility motifs. J R S Interface. 2013;10:20130246. doi: 10.1098/rsif.2013.0246. [DOI] [PMC free article] [PubMed] [Google Scholar]
- Song C, Qu Z, Blumm N, Barabási AL. Limits of predictability in human mobility. Science. 2010;327:1018–1021. doi: 10.1126/science.1177170. [DOI] [PubMed] [Google Scholar]
- Spalding A, Kernan J, Lockette W. The metabolic syndrome: a modern plague spread by modern technology. J Clin Hypertens. 2009;11:755–760. doi: 10.1111/j.1751-7176.2009.00191.x. [DOI] [PMC free article] [PubMed] [Google Scholar]
- Yoneyama S, Hashimoto S, Honma K. Seasonal changes of human circadian rhythms in Antarctica. Am J Physiol Reg Integr Comp Physiol. 1999;277:R1091–R1097. doi: 10.1152/ajpregu.1999.277.4.R1091. [DOI] [PubMed] [Google Scholar]


