Abstract
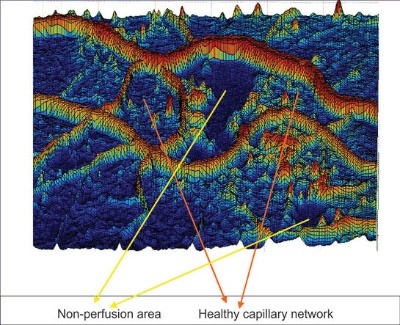
Introduction: Retinal capillary nonperfusion (CNP) is one of the retinal vascular diseases in diabetic retinopathy (DR) patients. As there is no comprehensive detection technique to recognize CNP areas, we proposed a different method for computing detection of ischemic retina, non-perfused (NP) regions, in fundus fluorescein angiogram (FFA) images.
Methods: Whilst major vessels appear as ridges, non-perfused areas are usually observed as ponds that are surrounded by healthy capillaries in FFA images. A new technique using homomorphic filtering to correct light illumination and detect the ponds surrounded in healthy capillaries on FFA images was designed and applied on DR fundus images. These images were acquired from the diabetic patients who had referred to the Nikookari hospital and were diagnosed for diabetic retinopathy during one year. Our strategy was screening the whole image with a fixed window size, which is small enough to enclose areas with identified topographic characteristics. To discard false nominees, we also performed a thresholding operation on the screen and marked images. To validate its performance we applied our detection algorithm on 41 FFA diabetic retinopathy fundus images in which the CNP areas were manually delineated by three clinical experts.
Results: Lesions were found as smooth regions with very high uniformity, low entropy, and small intensity variations in FFA images. The results of automated detection method were compared with manually marked CNP areas so achieved sensitivity of 81%, specificity of 78%, and accuracy of 91%.The result was present as a Receiver operating character (ROC) curve, which has an area under the curve (AUC) of 0.796 with 95% confidence intervals.
Conclusion: This technique introduced a new automated detection algorithm to recognize non-perfusion lesions on FFA. This has potential to assist detecting and managing of ischemic retina and may be incorporated into automated grading diabetic retinopathy structures.
Keywords: Capillary nonperfusion, Ischemic retina, Image processing/analysis, Diabetic retinopathy, Fluorescein angiography, Diagnostic imaging
Introduction
Diabetic retinopathy is a significant reason of blindness amongst adults ages 20 to 74 worldwide.1 Micro-angiopathy of the retina leads to annual blindness of over 10,000 people globally with diabetes mellitus and is the leading cause of legal visual impairment.2 Tissue perfusion is the process of delivery of blood into the retina and capillary nonperfusion occurs when retina does not have the efficient tissue perfusion. Retina is a tissue with high oxygen demand even more than the brain. Since it cannot deposit oxygen within itself, the retina needs continuous and sufficient supply of blood for nourishment until it preserves its function. Non-perfusion areas of the retina are associated with the development of vascular occlusion or capillary closure.1 It is obvious that early detection of small isolated non-perfused areas is crucial.
The clinical procedures for detecting retinal vasculature abnormalities and the non-perfused areas are normally achieved through screening using fundus colour and FFA images by ophthalmologists. This is a difficult job due to the fact that there is a large variation in the overall size, shape, location, and intensity of the retinal pathologiesexist.3-7 With the aim of estimating these retinal pathologies, monitoring is accomplished on fundus images taken by a variety of factors in angiography such as the amount of focus, power of flashes for fundus illumination, opacity of vitreous fluid, pigmentation of the fundus, presence of vasculature abnormalities, age, and colour of the skin. These procedures usually suffer from several drawbacks such as the variable expertise, biases in diagnosis which are also affected by quality of images.3,4,6,7
Computing process of image by means of detection of retinal pathologies in DR patients may aid the clinicians in both treatment and referrals. The identification of CNP in retinal images is one of the signs demonstrating the disease proceeded to a stage needing referral to an ophthalmologist therefore it could be a significant objective in automated analysis.5,6 Automated computer analysis and screening in early diagnosis of vasculature retinal disorders not only provide a fast and consistent approach but also present a cost-effective and reliable methodology compared to analysis performed by clinician observers.8,9 It reduces much of boredom and error-prone works of an ophthalmologist, for instance it can decrease the workload of manual screening by 50%.10
There are many studies on automated detection of retinal pathologies in DR images.3-9 However, there are few published studies which show the automated method to detect the capillary nonperfusion in FFA images. Sivaswamy et al presented a solution for automatically extraction of CNP regions on FFA using modelled CNPs as valleys.4 A research group detected fovea avascular zone using an automated segmentation program in FFA images, taken by a digital confocal scanning laser ophthalmoscope cSLO Heidelberg Retina.7 This program produced reproducible results that were analogous to those made by ophthalmologists. Zheng et al used a texture segmentation framework for segmenting Capillary nonperfusion regions in FA images of ischemic diabetic maculopathy taken by acSLO.8
To our knowledge, there is no comprehensive method to detect CNPs in FFA images taken by conventional fundus camera directly from diabetic retinopathy patients, although previous studies used cSLO images or dataset eye images of ischemic retina. However, these methods still need to be developed getting significant results to assist for detecting and managing of ischemic retina that may be incorporated into automated grading diabetic retinopathy structures.3-8 We applied, for the first time, two classification paths together to detect CNP lesion, dark lesion, in screening FFA image (grey scale image) using four different properties of the image. First, local brightness was employed to compare intensity of a region/or an object to the intensity of residual background and second, the contextual information of the region of interest inform of the variance, uniformity and entropy. This study improved automated detection of CNP in DR FFA taken by a conventional ophthalmoscope in a local university eye clinic. The algorithm successfully detects CNP’s of all sizes in the most of the presented cases.
Materials and methods
A total of 41 Fundus FA images from 80 patients referred to the university eye clinic with different severities of DR were obtained in an approaching observational study. Our strategy consisted of three steps; FA image pre-processing, evaluation of image parameters, and CNP detection orsegmentation step.
Image capturing and preprocessing
In this study we used images acquired from the diabetic patients who have been referred to the Nikookari Hospital and were diagnosed for diabetic retinopathy during one year. Images were taken using fundus camera, TOPCON TRC-50IX Tria functional retinal camera, using ICG infrared fluorescein angiography. The digital camera was set to use the highest quality mode for imaging with a Tiff compression. Images were 1032×1320 pixels, and 8 bit grey-scale. All images had to be checked visually for clarity and field of view alignment which used 50° for monitoring the whole retina. We utilized the MATLABR2011R, a computing software package, for evaluating and preprocessing of FA images as well as developing the detection algorithms on 41 selected DR FFA images.
CNP detection algorithm
The CNP detection algorithm included four image preprocessing and processing steps. At first step, image restoration techniques were used to compensate the damage done by recognized causes. Algorithms of de-blurring and noise removal of interference patterns are classified in this category. On the next step, images were enhanced resulting in improvement of contrast and illumination. Pond detection was subsequently applied to locate the suspicious points by the image segmentation technique for marking specific zones of interest within the image. Finally, morphological opening and closing thresholding was performed to throw away false-positives among the detected CNP candidates in the image.
Noise removal
The unprocessed images with the high level of noise make them unfitting for medical diagnosis. Gaussian noise, one kind of random noise, is typically present in FFA images that are acquired by digital fundus cameras. Random fluctuations in the signal level cause Gaussian noise in image and can be reduced using an alpha-trimmed filter and eliminating pixels with d/2 parameter from maximum and minimum gray-level intensity.11 Consider the following equation:
| (1) |
Where, is a two-dimensional function of image and d is alpha-trimmed degree, in the neighborhood Sxy and gr(s,t) represent the residual (m×n)-d pixels. An alpha-trimmed mean filter is a filter formed by averaging the remaining pixels. The process of image de-noising introduces annoying un-sharpness while removing noise components injected into images during their acquisition photographic phase. Our goal was to identify details such as miniature capillaries in the given images. Given the thickness of the thinnest capillaries of 4-5 pixels, we applied the de-noising algorithm with the proposed window size of 3×3 pixels and setting d=4 as alpha-trimmed degree to maximally preserve the sharpness in the vasculature network.
Illumination correction
Acquiring high quality ocular fundus images without shortcoming is difficult. Illumination is not always uniform due to a number of factors affecting the image quality: media opacities defocus or presence of artifacts, convexity of the surface of retina can be named as a few.8,12,13 Also the macula reflection is normally lower than other parts of the retina and the patient eyes are not usually stable when photographed. In this study, the most challenging pre-processing task we encountered was the normalization of the illumination process. The high intensity flash bulb in the fundus camera results in bright regions in the middle of the image while leaving the surrounding edges dark. Image enhancement techniques are therefore needed to assist clinicians and image analysts. One such method corrects the illumination deficiencies, compensates for the intensity variations, and also improves the texture uniformity of a given image.14
We proposed a homomorphic filtering function to modify the variation of illumination in FFA images based on previous works of Gonzales & Woods.11 The homomorphic filtering is used for improving the appearance of an image and correcting the variation in intensity by simultaneously compressing the intensity range and enhancing the contrast. An image function, D(x,y), may be stated as the product of components of illumination and reflectance denoted by:
D(x,y)=i(x,y)×r(x,y) (2)
The component of illumination is generally characterized by slow spatial differences, while the component of reflectance has a tendency to vary sharply, mainly at the junctions of different objects. Although these relations are coarse approximations, they may be applied to provide image enhancements. The following diagram in Fig.1 depicts the procedure of homomorphic filtering function for illumination correction. In the illumination correction stage, H(u,v), a designed filter, can be approximated using the basic form of any of the ideal high-pass filters. For example, an adapted form of the Gaussian high-pass filter was implemented for illumination correction in FFA images as shown in Eq. (3).
Fig. 1 .

Procedure for implementing the homomorphic filtering function.11
H (u, v) = (γ H – γ L ) [1-exp [-c(D2 (u, v)/D02 )]] + γL (3)
The procedure of implementing the homomorphic filtering function is also illustrated in Fig.1 where f(x,y) denotes the illumination corrected image function:
The application of the homomorphic filter function for illumination correction in a sample FFA image is represented in Fig. 2. The homomorphic filter which was designed for this study is shown in the bottom of the Fig. 2.
Fig. 2 .
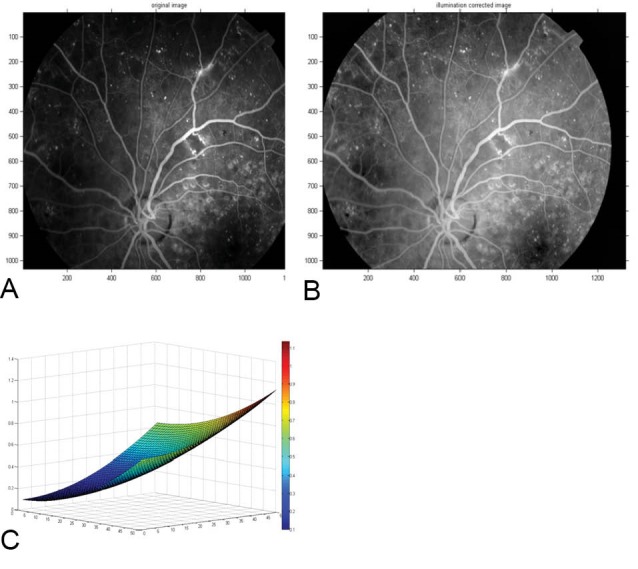
A sample (A) FFA image and (B) Illumination corrected FFA image, (C) 3-D surf of the homomorphic filter which was designed for illumination correction of images.
Modelling of non-perfused detection algorithm
A 3-D view of an FFA image with non-perfused areas surrounded with healthy vasculature network is shown in Fig. 3.
Fig. 3 .
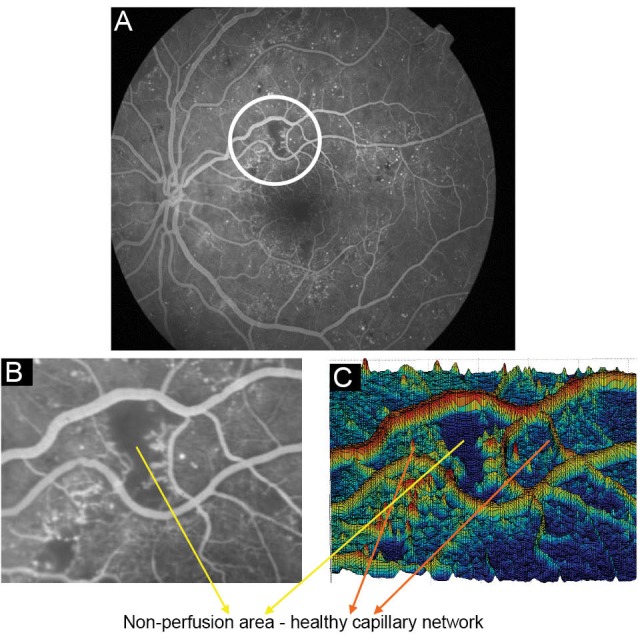
(A) A Sample FFA image with non-perfused regions, (B) A crop of the image from non-perfused area, (C) Surface of 3-D shape of non-perfusion region in the image.
Considering the retinal capillary closure surrounded in the non-perfused regions, these lesions could only be seen by the fluorescence of choriocapillaris. Non-perfusion regions have specific topographic characteristics; they were smoothed regions by low entropy, low variances in intensity, and high uniformity. Since we have modeled non-perfused regions as ponds, ponds detection algorithm was needed to segment the suspicious sections. The strategy we have adopted is to screen the whole image by a fixed window size, small enough to enclose areas with desired characteristics.15 Finally, thresholding operation of morphological opening and closing is performed to discard false positives among the detected nominees. In order to select a suitable threshold level for statistical momentum characteristics, we selected a total of five images and five corresponding patches. From this set, 2 patches in each image were related to non-perfused areas while the rest were related to other parts of the image where there was no indication of capillary non-perfusion areas. Care was taken to ensure that the patch sizes remained identical. Parameters were measured in 10 non-perfused and 15 patches belonging to the image in total. Fig. 4A and 4B show sample patches used. Note that the first row is extracted from the non-perfused areas while the second row demonstrates the other parts of the image.
Fig. 4 .
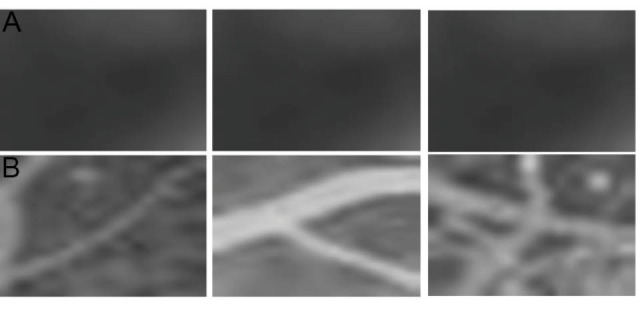
(A) Patches of non-perfused areas, (B) Patches of other parts of the image.
Results
We implemented the proposed CNP detection algorithm as following stages. A constant parameter (c) was introduced in the illumination correction stage, as a controller for the sharpness of the filter function slop so it changes between γL and γH levels. In our analysis, we chose c=0.1, γL=0.4, and γH=1.4 by trial and error. D0 is the cutoff frequency; it controls the separation of illumination and reflectance. At times, the two values overlapped each other, and in such scenarios, determination of the cutoff frequency became complex. Appropriate choice of D0 is hence best achieved experimentally. We have chosen D0=Q, where Q represents a dimension of the input image (input image size is [P×Q]). A sample result after application of this algorithm is also shown in Fig. 5.
Fig. 5 .
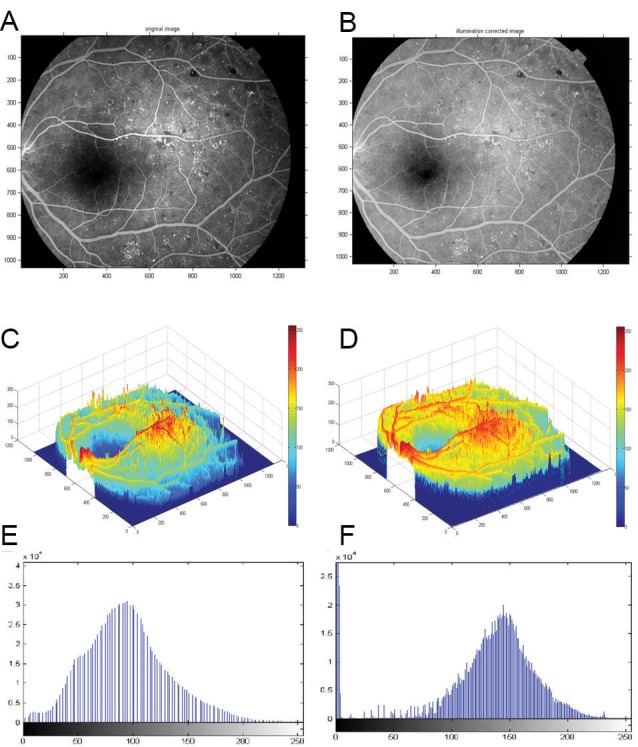
(A) Sample FFA image. (B) Illumination corrected image by the homomorphic technique. (C) Histogram of PDF of unprocessed image. (D) Histogram of PDF of processed image with homomorphic filtering function. (E) 3-D surface presents variation of intensity in the sample image. (F) 3-D surface presents uniformity of intensity in the corrected image using the homomorphic filter.
The resulting image was screened with a window size of 5×5 pixles and the NP detection algorithm was applied (see Fig. 6). Monitoring for the presence of candidates for non-perfused regions was achieved with the aid of four statistical image moments. We identified that the non-perfused areas have the following properties:
Fig. 6 .
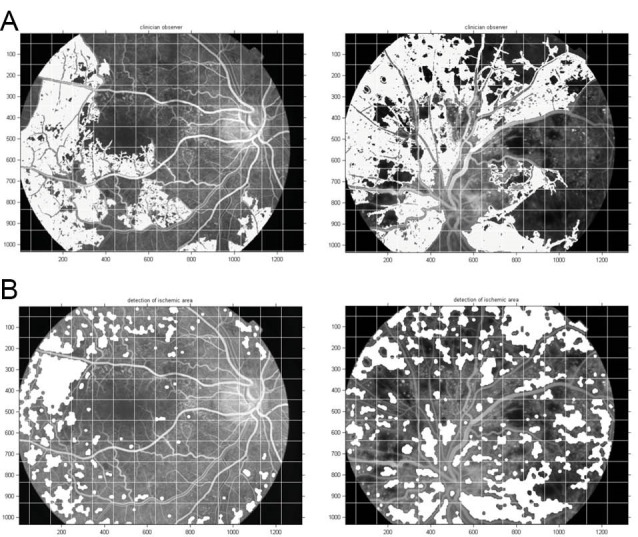
(A) Corresponding opinion certainty shown in white, (B) Segmented results with NP detection algorithm shown in white.
I. Mean intensity of image <Gray level<135 in gray scale level
II. Variance<=11
III. Entropy<4
IV. Uniformity>0.2
The proposed NP detection algorithm was applied on 41 FFA images which contained many non-perfused areas in different morphological characteristics. Some images had a lower resolution compared to images acquired using the digital cSLO of Heidelberg Retina Angiograph in a similar study conducted by Sivaswamy et al in 2009.4 The resulting images by NP detection algorithm compared with the opinion certainty were prepared manually by a retinal ophthalmologist (an advisor to the study). The images were partitioned into square sizes of 50×50 pixels to calculate the sensitivity and true positive predictable fraction (see Fig. 6). Every square which manually marked more than 500 pixels of its area, has been counted as CNP categories. In some images, the NP detection algorithm was unsuccessful to perform precisely, however large CNP areas were present. This remarkable issue was only observed in images where vast formation of neovascularization had been visually observed. Formation of neovascularization disturbs the smoothness of non-perfused areas, which are covered by tiny and very fragile vessels. In addition, development of vascular permeability results in intensity enhancements of non-perfused areas exceeding the upper bound selected for image thresholding. This problem creates an obstacle for the detection of non-perfused categories. The following image in Fig. 7 illustrates this problem;
Fig. 7 .
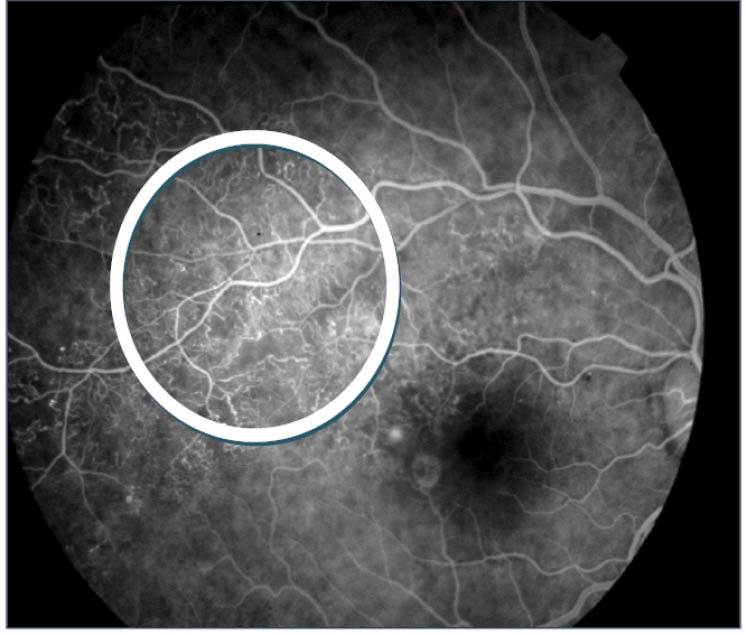
FFA image in presence of neovascularization and vascular permeability.
A quantitative assessment of the performance of the algorithm was conducted. Comparing to manually marked clinical reference, images containing non-perfused areas were detected with 81% sensitivity, 78% specificity and 91% accuracy. The obtained ROC curve, using threshold levels had an area under the curve (AUC) of 0.796 with 95% confidence intervals shown in Fig. 8 by the statistical software of EPI-STAT.
Fig. 8 .
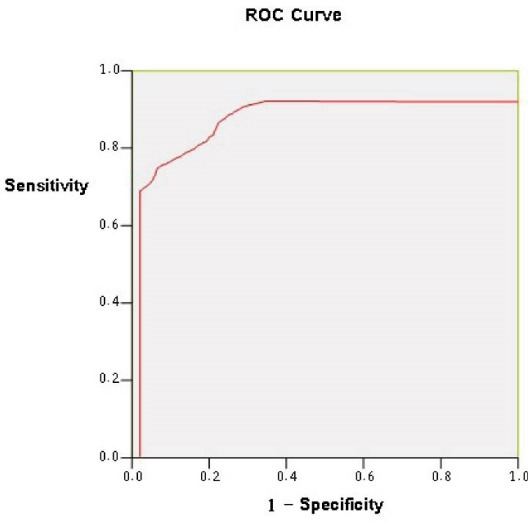
ROC plot comparingthe result of computing detection method with the manual clinical reference.
Discussion
In this study, we introduced a novel computerized automated detection technique that was especially designed for the retinal CNP in FFA images which were taken using a conventional fundus camera in a local university eye clinic (Nikookari Hospital, Tabriz, Iran). The strategy consists of three significant steps consequently; pre-processing of FFA images, evaluation of image parameters of CNP regions and unsupervised detection or segmentation step. The high points of this study are first, using homomorphic filtering to enhance the CNP as ponds surrounded in healthy capillaries on FFA images and second, detecting the candidate CNP regions was completed with the aid of four statistical image moments and properties, intensity, variance, entropy and uniformity, in an unsupervised algorithm using a window size of 5×5 pixels.
We applied the designed algorithm to FFA images of DR patients diagnosed with CNP reigns to validate the feasibility of technique. The image dataset were over four hundred consecutive FFA images from DR patients. Images with poor clarity, unusual appearance, or where patients with proliferative diabetic retinopathy did not demonstrate any CNP regions were excluded from the dataset. The proposed technique demonstrated good potential with 91% accuracy, and 81% sensitivity and 78% specificity on 41 FFA images from DR patients that have been taken by a fundus camera. This study is one of the first studies that used a conventional fundus camera to collect a large number of FFA images of DR patients to address this interesting issue. A new perception to this medical imaging issue has been offered by this result. The clinical progression of DR disease and relationship with systematic complications may be followed using calculation size of CNP reigns and their distribution patterns by this technique.
Although automated investigation of retinal images is a significant research topic12 because of fast growing of blindness among adults worldwide,2 the major highlighting has been on examination of color fundus images. Therefore investigation of FFA image to detect CNP region in retina is still comparatively new area. To our knowledge, there are only three previous works conducted in this area of research. Jasiobedzi et al in 199313 reported automated analysis of retinal images to detect NP in FFA images using region merging and wide morphological operations. They used, into primary regions, a preliminary tessellation of the image using detecting linear structures. A set of features derivative from the original image describe and label these boundaries using statistical classification. However they did not address any sensitivity, specificity, and accuracy of their method.13 Another work was performed by Sivaswamy et al in 2009;4 they introduced a unsupervised method by variance-based region growing to automated detection and segmentation of CNP on 40 scanning laser ophthalmoscope FFA images. This method was pixel by pixel evaluation on the FFA images and they reported an AUC of 0.842 with a sensitivity of 0.9 and specificity of 0.36 using their ROC. In the recent work by Zheng et al in 2014,8 to evaluate the level of CNP in retina FA images, they proposed a texture segmentation framework including pre-processing, unsupervised, and supervised segmentation steps. A multiphase entire variation texture segmentation model was employed in their method enhanced by terms of new kernel based region. The method was performed on two different malarial retinopathy and diabetic maculopathy, and dataset wascompared to a manual marking out as standard reference. They announced sensitivity of 70.6%, specificity of 82.1%, and an accuracy of 80.8%, for the dataset of 10 FFA diabetic maculopathy images taken by scanning laser ophthalmoscope. Although these two recent studies reported accuracy and sensitivity, and their method and our method achieved satisfactory sensitivity of 81%, specificity of 78%, and accuracy of 91% because of different methodology, dataset, imaging modalities, and quality of FFA images, it is not possible to perform significant benchmarking and compare performance against these proposed detection methods directly.
Achieving a high automated detection of CNP in FFA images is very problematic performance. Our studies and others proved that many factors across image could affect the detection performance such as extensive variations in illumination, intensity, contrast, uniformity etc. of image appearance. This causes it difficult having universal benchmarks to describe CNP regions either in manual or automated method so a detected region as CNP in an image may not be marked as CNP in another image. The preprocessing step for image enhancement and illumination correction enabled more accurate CNP detection to produce satisfactory results on the FFA image. We propose two different methods for correcting the illumination in FFA images (i) dividing method, (ii) homomorphic filtering function. The first preprocessing method has been previously reported in literature, Chrástek et al,19 Spencer et al,20 and Cree et al.16 In this method we suggest a two-dimensional image f(x,y) which by definition is the result of illumination reflected on an object surface. Homomorphic filtering function removed most variations in intensity within retinal FA images by eliminating the illumination frequencies and reversing the reflectance frequencies. Image uniformity arisen 85.7% is satisfactory compared to original image. Homomorphic filtering function is a novel and more efficient tool in medical image processing. We obtained significantly improved results by application of this method to FA images with very dark borders. The results are far superior as compared to the results obtained by the application of the dividing method. We therefore suggest application of homomorphic to obtain global uniformity in the entire image. This approach results in a more efficient application of NP detection algorithm.
There are many variables that compromise photography and angiography of the human eye. Amongst the independent variables, the most important ones are the opacity of vitreous fluid, pigmentation of the fundus, hemorrhage, presence of vasculature abnormality, age, and color of the skin.3,9,16-18 Dependent variables such as field of view and power of flashes are the other contributors to imaging. Moreover, it is a complex task to threshold the images and assign appropriate signal levels for extracting the non-perfused areas.4,5 By considering such large number of variables, an effective method to overcome this obstacle is to develop a large databank of angiographic images whose non-perfused areas have been positively identified by an expert clinician. Using such databank, image parameters and corresponding threshold levels can be assigned by simple comparison metrics.
To maximize detecting non-perfused areas, grey-level thresholds have been adjusted at an enough low level on processed images, although to exclude of large number of false background features the thresholds should be high enough. This approach has caused in the unavoidable disagreement between the requirements of low thresholds for high sensitivity, and of relatively high thresholds for high specificity. Hence, maximizing sensitivity, threshold levels were invariably selected. In an attempt, the grey-level intensities with fourth and fifth statistical moments, uniformity and entropy, determine variances being used to increase the specificity. Illustrative characteristics of non-perfused areas, mostly present in the vicinity of healthy vascular network, were identified as a good tool to set threshold levels.13,14
The incorporation of macula zone in retinal analysis that may tend to incorrectly detect the zone as a CNP region in FFA images was a limitation of study. The uneven illumination of retina and its curved surface as well as other artifacts may also cause different appearance of CNP regions in different location of FFA images. The regions in peripheral retina because of locating in edge of field of view, getting different illumination, and unfocused may appear as CNP region. Future works may overcome these shortcomings for greater performance. To make automated retinal features detection for DR screening, Fleming et al at 2005 and 2007 in two studies6,9 included more than thousand successive images from a retinal screening program, so a dynamic and multi-scale threshold setting method was used to detect candidates. Some studies6,21-24 used local features such as color, brightness, contrast, sharpness etc. in color fundus images to classify each area as having lesion potential. We applied two classification paths together to detect CNP lesion, dark lesion, in screening FFA image (greyscale image) using four different properties of the image. First, local brightness was employed to compare intensity of a region /or an object to the intensity of residual background and second, the contextual information of the region of interest in form of the variance, uniformity, and entropy. However we suggest in further works using large independent dataset of clinical FFA images, taken by conventional ophthalmoscope or cSLO, could make significant improvement in the result of unsupervised CNP detection algorithm.
Conclusion
We developed a new algorithm to detect the CNP areas for diabetic retinopathy or referable retinopathy imagery in this study. The effectiveness of NP detection algorithm for automated recognition of non-perfused areas was demonstrated in FFA images. The algorithm successfully detects CNP’s of all sizes in most of the presented cases. The detection results are good as indicated by the sensitivity of 81%, specificity of 78%, and accuracy of 91%. The ultimate goal of this study was to assist physicists and clinicians by developing a set of algorithms that would positively identify non-perfused areas and eventually assist professional clinicians with control and prevention of eye-related diseases. It is obvious that such contribution to the field of medical imaging is helpful technical aid to follow diabetic patients. We concluded that as a part of an automated detection system this method may be used to categorize images screening either DR or referable DR.
Acknowledgements
The authors acknowledge invaluable comments received from Dr. Hadi Seyedarabi and Dr. Sima Salarirad. The authors also are thankful to all participated patients in the study and assistants of the university eye clinic.
Ethical issues
Informed consent was obtained from each subject. An ethical approval was obtained from Tabriz University of Medical Sciences.
Competing interests
Authors declare no conflict of interests.
Research Highlights
What is current knowledge?
√ Diabetic retinopathy that launches retinal vasculature abnormalities and ischemic retina is a significant cause of blindness amongst adults’ ages worldwide.
√ The clinical procedures for detecting the abnormalities are normally achieved through screening using fundus color and FFA images by ophthalmologists.
√ It is obvious that early detection of small CNP areas is crucial. This is a complex task due to the fact that a large variation in the overall size, shape, location, and intensity of the retinal pathologies exist.
√ Automated computer analysis and screening vascular retinal disorders as a cost-effective method not only reduce much of boredom and error-prone works of an ophthalmologist, but also decrease the work load of manual screening by 50%.
√ There are many studies on automated detection of retinal pathologies in DR images, however there are few studies having published the automated method to detect the CNP in FFA images.
What is new here?
√ Using homomorphic filtering to enhance the CNP as ponds surrounded in healthy capillaries on FFA images.
√ Four statistical image moments and properties; intensity, variance, entropy and uniformity, used in an unsupervised algorithm to detect CNPs with a window size of 5x5 pixels.
√ A new detection technique using some image processing features to improve automated detection of CNP in DR FFA taken by a conventional ophthalmoscope in the university eye clinic.
√ The algorithm successfully detects CNP’s of all sizes in the most of the presented cases.
√ Such contribution to the field of medical imaging is helpful technical aid to follow diabetic patients.
References
- 1. Ryan SJ. Retina, Vol II. 3rd ed. Singapore; 2001.
- 2.Esteves J, Kramer C, Azevedo M, Stolz A, Roggia M, Miozzo L. et al. Prevalence of diabetic retinopathy in patients with type 1diabetes mellitus. Rev Assoc Med Bras. 2009;55:268–273. doi: 10.1590/s0104-42302009000300017. [DOI] [PubMed] [Google Scholar]
- 3.Rasta SH, Partovi ME, Seyedarabi H, Javadzadeh A. A Comparative Study on Preprocessing Techniques in Diabetic Retinopathy Retinal Images: Illumination Correction and Contrast Enhancement. J Med Sign Sence. 2015;5:40–48. [PMC free article] [PubMed] [Google Scholar]
- 4.Sivaswamy J, Agarwal A, Chawla M, Rani A, Das T. Extraction of capillary non-perfusion from fundus fluorescein angiogram. Commun Comput Inf Sci. 2009;25:176–188. [Google Scholar]
- 5.Rasta SH, Manivannan A, Sharp PF. Spectral imaging technique for retinal perfusion detection using confocal scanning laser ophthalmoscopy. J Biomed Opt. 2012;17:116005. doi: 10.1117/1.JBO.17.11.116005. [DOI] [PubMed] [Google Scholar]
- 6.Fleming AD, Philip S, Goatman KA, Williams GJ, Olson JA, Sharp PF. Automated detection of exudates for diabetic retinopathy screening. Phys Med Biol. 2007;52:7385–7396. doi: 10.1088/0031-9155/52/24/012. [DOI] [PubMed] [Google Scholar]
- 7.Zheng Y, Gandhi JS, Stangos AN, Campa C, Broadbent DM, Harding SP. Automated segmentation of foveal avascular zone in fundus fluorescein angiography. Invest Ophthalmol Vis Sci. 2010;51:3653–3659. doi: 10.1167/iovs.09-4935. [DOI] [PubMed] [Google Scholar]
- 8.Zheng Y, Kwong MT, MacCormick IJ, Beare NA, Harding SP. A comprehensive texture segmentation framework for segmentation of capillary, non-perfusion regions in fundus fluorescein angiograms. PLoS One. 2014;9:e93624. doi: 10.1371/journal.pone.0093624. [DOI] [PMC free article] [PubMed] [Google Scholar]
- 9.Fleming AD, Philip S, Gouatman KA, Olson JA, Sharp PF. Automated assessment of diabetic retinal image quality based on clarity and field definition. Investigate of Ophthalmology and Visual Science. 2006;47:1120–1125. doi: 10.1167/iovs.05-1155. [DOI] [PubMed] [Google Scholar]
- 10.Lee CS, Lee TE, Kingsley RM, Wang Y, Russell D, Klein R. et al. Comparison of diagnosis of early retinal lesions of diabetic retinopathy between a computer system and human experts. Arch Ophtalmol. 2001;119:509–515. doi: 10.1001/archopht.119.4.509. [DOI] [PubMed] [Google Scholar]
- 11. Gonzeles RC, Woods RE. Digital image processing. 3rd ed. USA; 2008.
- 12.Patton N, Aslamc TM, MacGillivray T, Deary I, Dhillon B, Eikelboom R. et al. Retinal image analysis: concepts, applications and potential. Prog Retin Eye Res. 2006;25:99–127. doi: 10.1016/j.preteyeres.2005.07.001. [DOI] [PubMed] [Google Scholar]
- 13.Jasiobedzki P, Talor JC. Automated analysis of retinal images. Image Vis Comput. 1991;11:139–144. doi: 10.5244/C.5.35. [DOI] [Google Scholar]
- 14.Marrugo AG, Millan MS. Retinal image analysis: preprocessing and feature extraction. J Phys. 2011;274:1–8. [Google Scholar]
- 15.Rasta SH, Manivannan A, Sharp PF. Spectroscopic imaging of the retinal vessels using a new dual-wavelength. Proc SPIE. 2009;7368:1–11. doi: 10.1117/12.831635. [DOI] [Google Scholar]
- 16.Cree JM, Olson JA, Mac Hardy KC, Sharp PF, Forrester JV. The preprocessing of retinal images for the detection of fluorescein leakage. Phys Med Biol. 1999;44:293–308. doi: 10.1088/0031-9155/44/1/021. [DOI] [PubMed] [Google Scholar]
- 17.Mengko TR, Handayani A, Valindria V, Hadi S, Sovani I. Image processing in Retinal Angiography: Extracting Angiographical Features Without the Requirement of Contrast Agents. IAPR Conference on Machine Vision Application. 2009:451–454. [Google Scholar]
- 18.Alipour SHM, Rabbani H, Akhlaghi M. A new combined method based on curvelet transform and morphological operators for automatic detection of foveal avascular zone. Signal Image and Video Processing. 2014;8:205–222. [Google Scholar]
- 19.Chrástek R, Wolf M, Donath K, Niemann H, Paulus D, Hothorn T. Automated segmentation of the optic nerve head for diagnosis of glaucoma. Med Image Anal. 2005;29:297–314. doi: 10.1016/j.media.2004.12.004. [DOI] [PubMed] [Google Scholar]
- 20.Spencer T, Olson JA, Mchrdy CK, Sharp FP, Forrester J. An image processing strategy for the segmentation and quantification of microaneurysems in fluorescein angiograms of the ocular fundus. Comput Biomed Res. 1999;29:284–302. doi: 10.1006/cbmr.1996.0021. [DOI] [PubMed] [Google Scholar]
- 21.Niemeijer M, Abramoff MD, van Ginneken B. Segmentation of the Optic Disc, Macula and Vascular Arch in Fundus Photographs. Medical Imaging IEEE Transactions. 2007;26:116–127. doi: 10.1109/TMI.2006.885336. [DOI] [PubMed] [Google Scholar]
- 22.Ege BM, Hejlesen OK, Larsen OV, Møller K, Jennings B, Kerr D. et al. Screening for diabetic retinopathy using computer based image analysis and statistical classification. Comput Method Prog Biomed. 2000;62:165–175. doi: 10.1016/s0169-2607(00)00065-1. [DOI] [PubMed] [Google Scholar]
- 23.Osareh A, Shadgar B, Markham R. A computational-intelligence-based approach for detection of exudates in diabetic retinopathy images. IEEE Trans Inform Techn Biomed. 2009;13:535–545. doi: 10.1109/TITB.2008.2007493. [DOI] [PubMed] [Google Scholar]
- 24.Wang H, Hsu W, Goh KG, Lee ML. An effective approach to detect lesions in color retinal images. Proc IEEE Conf Comput Vis Pattern Recogn. 2000;2:181–186. [Google Scholar]


