

SUMMARY
Most transcription factor families contain highly related paralogs generated by gene duplication and functional divergence is generally accomplished by activation of distinct sets of genes by each member. Here we compare the molecular functions of Myf5 and MyoD, two highly related bHLH transcription factors that regulate skeletal muscle specification and differentiation. We find that MyoD and Myf5 bind the same sites genome-wide but have distinct functions: Myf5 induces histone acetylation without Pol II recruitment or robust gene activation, whereas MyoD induces histone acetylation, recruits Pol II and robustly activates gene transcription. Therefore, the initial specification of the muscle lineage by Myf5 occurs without significant induction of gene transcription. Transcription of the skeletal muscle program is then achieved by the subsequent expression of MyoD, which binds to the same sites as Myf5, indicating that each factor regulates distinct steps in gene initiation and transcription at a shared set of binding sites.
INTRODUCTION
Many transcription factors belong to larger families of highly related paralogs that bind to a similar DNA sequence motif. Functional divergence among related transcription factors within a family is commonly achieved through divergence of the factor DNA binding domain. For example, while many of the ETS family members bind to a shared set of sequences to activate a shared transcriptional program, each factor also binds a factor-specific set of sites that have diverged from the shared sequence motifs to achieve factor-specific gene activation (Hollenhorst et al., 2007, 2009). Similarly, different members of the NF-κB family bind the same consensus motifs, but single nucleotide differences determine which co-activators will form productive interactions with the bound factors at individual sites, thus achieving factor-specific gene activation in the context of a largely overlapping set of binding sites (Leung et al., 2004). In both cases, functional diversity within the family is driven by the divergence of the DNA binding domain and the bound sequence motif. A similar model has been proposed for the hormone receptors, where the binding site sequence induces an allosteric regulation of the transcriptional activity of glucocorticoid receptors (Meijsing et al., 2009) and in the non-steroid hormone receptor family where the spacing between motifs determines which family members can regulate specific genes (Rastinejad, 2001). Thus, in these examples, functional divergence within transcription factor families is achieved by factor-specific binding site divergence to allow the regulation of a factor-specific set of genes. Alternatively, some families have paralogs that bind to the same set of sites but have different functions. For example, the opposite repressor and activator functions of the ETS factors Yan and pntPI on a common set of genes during Drosophila development (Gabay et al., 1996), or the E2F family members sequentially recruited to the same genes to variably activate or repress transcription (Stevaux and Dyson, 2002; Takahashi et al., 2000).
The basic-helix-loop-helix (bHLH) transcription factor family binds to an E-box motif (CANNTG) and has ~110 members in humans (Gray et al., 2015) generated by multiple rounds of gene duplication and functional divergence (Simionato et al., 2007; Skinner et al., 2010). For MyoD and NeuroD2, two members of the bHLH family that regulate myogenesis and neurogenesis respectively, functional specificity is determined largely by divergence in binding site preference. While both factors bind to a shared E-box sequence (CAGCTG), NeuroD2 and MyoD also bind distinct, or “private,” E-box sequences (CAGATG and CAGGTG, respectively), and these private binding sites are more strongly associated with lineage-specific gene transcription (Fong et al., 2012). For NeuroD2, the greater transcriptional activity at the private binding sites correlated with a slower off-rate compared with the shared site. Swapping bHLH regions was sufficient to redirect MyoD to NeuroD2 private binding sites and convert MyoD into a neurogenic transcription factor (Fong et al., 2015). Therefore, functional divergence between two sub-families of bHLH factors that specify distinct cell lineages again appears to be driven by factor-specific binding site divergence, rather than differences in the inherent function of the factor.
It is less clear how functional divergence is established within a subgroup of factors that have sequential roles in the specification and differentiation of a single cell lineage. The specification and differentiation of skeletal muscle cells is determined by the sequential expression of four myogenic bHLH proteins: Myf5, MyoD, Myog, and Mrf4. Initial genetic studies suggested that Myf5 and MyoD were redundant regarding the specification of the skeletal muscle lineage (Braun et al., 1992, 1994; Kablar et al., 1997), however, subsequent studies showed satellite cell differentiation was impaired in MyoD−/− mice despite expression of Myf5 in these cells (Megeney et al., 1996; Sabourin et al., 1999; Yablonka-Reuveni et al., 1999). Together with the observations that some muscles have delayed differentiation during development in MyoD−/− mice and that Myf5 failed to compensate for MyoD when knocked into the MyoD locus in Myf5−/− mice (Haldar et al., 2014; Kablar et al., 1997), these studies suggest that MyoD and Myf5 might have some distinct functions in muscle specification and differentiation. In this regard, some studies suggested that MyoD and Myf5 each established a separate muscle lineage and had only partially overlapping binding sites (Gensch et al., 2008; Haldar et al., 2008; Kablar et al., 1997; Soleimani et al., 2012). These findings are consistent with the general model of functional divergence established through factor-specific binding site divergence and gene activation. However more recent studies support a single muscle lineage with the sequential expression of Myf5 and MyoD acting to specify and initiate skeletal muscle differentiation (Comai et al., 2014); yet in this model the specific functions for each factor remain unknown.
In the current study, we compared the binding and factor-specific activity of Myf5 and MyoD. We found that the myogenic bHLH family appears to have maintained the same binding site specificity but instead achieved functional divergence by segregating specific steps in transcriptional activation among factors sequentially expressed during the specification and differentiation of skeletal muscle cells. Specifically, we show that Myf5, the first factor to specify the skeletal muscle lineage, modifies the chromatin at its binding sites but does not robustly recruit Pol II or activate gene transcription, whereas MyoD binds the same sites but robustly recruits Pol II and activates gene transcription. Our results indicate that Myf5 and MyoD have achieved functional divergence at a shared set of binding sites by segregating specific steps in gene initiation and transcription. In addition, this identifies an early role in lineage specification for transcription factors that induce regional histone modification but do not robustly induce transcriptional activation.
RESULTS
Myf5 Is a Weak Transcriptional Activator
To compare the direct effects of MyoD and Myf5 on the expression of myogenic target genes, we expressed each factor at equivalent and physiologically relevant levels in mouse embryonic fibroblasts lacking endogenous MyoD and Myf5 (M&M MEFs). For simplicity, we have designated the amount of lenti-MyoD required to match endogenous MyoD levels in C2C12 muscle cells as “1x” (Figure S1). 1x lenti-Myf5 is the amount of lenti-Myf5 virus needed to express the Myf5 protein at the same level as the endogenous MyoD protein (Figure S2). To do this, we compared MyoD and Myf5 protein levels from transduced M&M MEFs to Flag-tagged standards using quantitative western blots (Figure S2). This approach normalized for differences in antibody affinity, allowing a direct relationship between MyoD and Myf5 protein levels to be inferred (see Experimental Procedures and Figure S2 for additional details). We also ensured that we were not underexpressing Myf5 relative to endogenous levels by comparing Myf5-transduced M&M MEFs to cycling and differentiating C2C12s (Figure S1).
To compare the relative ability of MyoD or Myf5 to induce muscle cell differentiation, we transduced M&M MEFs with 1x of either lenti-MyoD or lenti-Myf5, and then switched them to differentiation media (DM). After 3 days in DM, we observed a large number of differentiating myocytes and myotubes in the cells transduced with lenti-MyoD (Figure 1A, top panel) but none in control cells transduced with lenti-GFP (Figure 1A, bottom panel). Although we observed a few elongated myocytes in the Myf5-transduced cells, no multinucleated myotubes were visible and the cells generally resembled the GFP-transduced M&M MEFS (Figure 1A, middle panel). Overexpressing Myf5 4-fold or more induced some increase in muscle cell formation, but still not as robustly as lower levels of MyoD (Figure S3).
Figure 1. Myf5 Has Weak Transcriptional Activity Compared with MyoD.
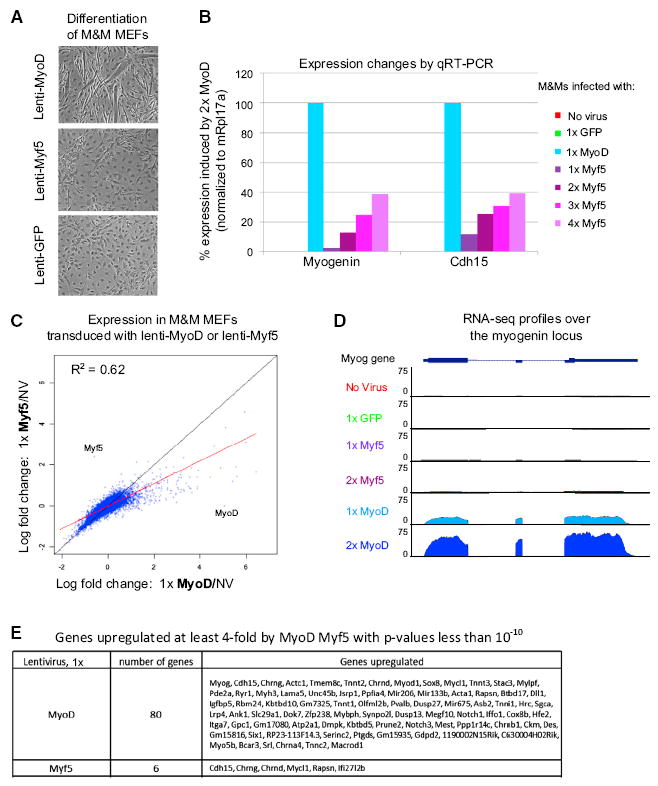
(A) Phase contrast images of M&M MEFs transduced with either 1x lenti-MyoD or 1x lenti-Myf5 for 1 day and then switched to DM for 3 days.
(B) M&M MEFs were transduced with a range of lenti-MyoD or lenti-Myf5 titers for 24 hr then switched to DM for 20 hr. Expression of Myog and Cdh15 was assayed by RT-qPCR, using mRpl17a as an internal control.
(C) RNA-Seq data from M&M MEFs transduced with either 1x lenti-MyoD or 1x lenti-Myf5 for 24 hr then switched to DM for 20 hr. Data points depict the log2 fold change over non-transduced cells. Genes showing a dose-response to increasing amounts of lenti-GFP were removed from the analysis to eliminate confounding viral-response effects. The red line represents the fitted trend line comparing MyoD and Myf5 while the black line represents a slope of 1.
(D) RNA-seq reads over the myogenin locus. All tracks have the same scale.
(E) Genes upregulated at least 4-fold by MyoD Myf5 with p values less than 10−10. Genes identified as “viral response” (Figure S3) have been removed from the analysis. See also Figures S1–S3.
To assay gene expression changes induced by MyoD and Myf5, we performed RT-qPCR on M&M MEFS transduced with 1x lenti-MyoD or lenti-Myf5. After transduction for 18 hr, the cells were recovered in growth media for 6 hr and then switched into DM. To focus the assay on direct effects of MyoD and Myf5, we assayed gene expression changes after only 20 hr in DM, a time when Myog mRNA becomes detectable but myogenin protein levels are still very low (data not shown). We observed dramatic increases in the expression of Myog and Chd15 in response to MyoD (Figure 1B). In contrast, these genes were only weakly induced by Myf5 under the same conditions (Figure 1B).
We next considered that Myf5 levels might be just under some threshold necessary for induction. Increasing the amount of Myf5 in M&M MEFs up to 4-fold did result in increased expression of target genes, however, 4x Myf5 resulted in only approximately 30%–40% of Myog and Cdh15 mRNA compared with cells expressing 1x MyoD (Figure 1B). We validated that increasing the amount of lenti-Myf5 did indeed increase the amount of Myf5 protein expressed in the cells by quantitative western blot (Figure S2B). These data, combined with the poor differentiation of M&M MEFs transduced with Myf5, suggested that either Myf5 was a relatively poor transcription factor, requiring substantial overexpression for differentiation, or that Myf5 induced a distinct set of myogenic genes not assayed in our RT-qPCR experiments.
To determine whether Myf5 more strongly induced a distinct set of genes, or a subset of the MyoD regulated genes, we performed RNA-seq on M&M MEFs transduced with 1x lenti-MyoD or 1x lenti-Myf5. To control for changes in gene expression due to viral transduction, we transduced M&M MEFs with a range of lenti-GFP and all genes that displayed a dose-response to lenti-GFP transduction were excluded from the analysis (Figures S3D–S3G). When we examined the scatterplots of the RNA-seq data, we found that both MyoD and Myf5 upregulated a similar set of genes, however, Myf5 upregulated these genes very weakly (Figures 1C–1E). Thus we conclude that Myf5 does not induce a distinct subset of genes compared with MyoD, but rather weakly induces expression of the same genes more robustly activated by MyoD.
MyoD and Myf5 Bind the Same Genomic Locations
MyoD and Myf5 both bind DNA motifs containing the core E-box consensus sequence CANNTG. To determine whether MyoD and Myf5 bound the same set of E-boxes genome-wide, we used chromatin immunoprecipitation coupled with high-throughput sequencing (ChIP-seq), using the same lentiviral expression system in M&M MEFs as in the RNA-seq study above. We found that in DM conditions MyoD and Myf5 peaks looked quite similar (Figure 2A) and were highly correlated genome-wide (R2 of 0.86) (Figure 2B).
Figure 2. MyoD and Myf5 Bind the Same Subset of E-Boxes.
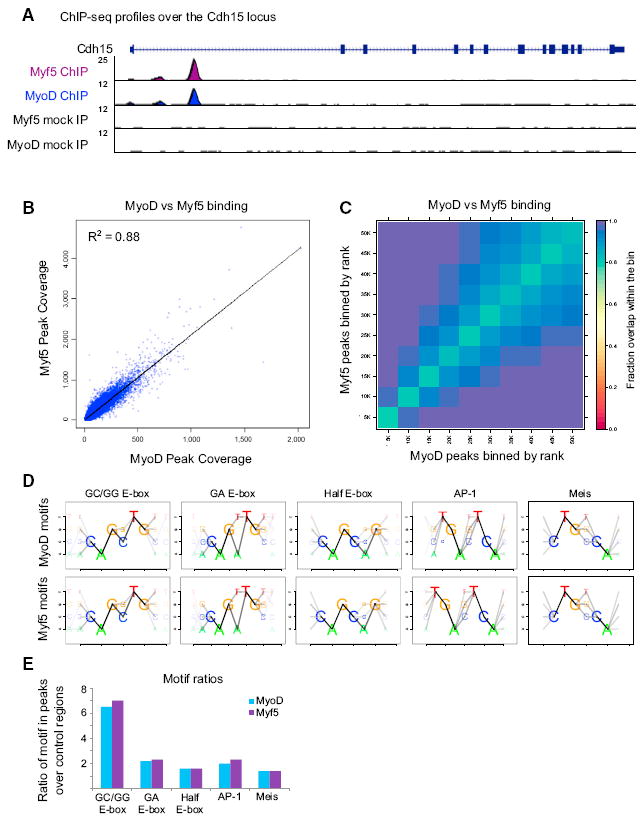
(A) ChIP-seq reads over the Cdh15 promoter. The mock ChIP samples are from cells transduced with lenti-GFP and immunoprecipitated with antibodies against Myf5 or MyoD. The tracks scales have been normalized using the average peak height to account for differences in the two antibody efficiencies.
(B) Overlap of MyoD and Myf5 ChIP-seq peaks plotted by peak coverage.
(C) Rank comparison of the top 50,000 MyoD and Myf5 peaks. Each box in the plot represents the overlap of two ranked peak lists. The bins are ordered from the origin as follows: top 5,000 peaks, top 10,000 peaks, etc. The color scale indicates the fraction of loci in the bin bound by both MyoD and Myf5.
(D) Motifs enriched under MyoD or Myf5 peaks.
(E) The ratio of the number of peaks containing the motif compared with the number of control regions containing the motif.
A direct comparison of peaks from the MyoD and Myf5 ChIP-seq datasets is inherently challenging due to the differential affinities of each antibody, and any threshold chosen is likely to include peaks in one dataset that narrowly miss the cut-off in the other. To avoid the problem of thresholding when determining peak overlap, we used a rank-based approach to compare the peak lists. For this analysis we ranked peaks according to their p values, then grouped the peaks into bins based on their rank and plotted the degree of overlap within the corresponding bins as a heatmap (Figure 2C). Overall there is a near perfect concordance of binding sites between MyoD and Myf5. Motif analysis of the regions bound by MyoD or Myf5 also identified the same E-box motifs (Figures 2D and 2E). Thus we conclude that while Myf5 only weakly induces myogenic targets, it binds to the same sites as MyoD, suggesting the low gene induction is not due to a difference in the E-box sequence preference and/or a difference in the genomic sites bound.
Myf5 Induces Regional Histone H4 Acetylation around Its Binding Sites
In addition to activating target genes, MyoD induces chromatin remodeling and histone acetylation at its binding sites (Cao et al., 2006, 2010; de la Serna et al., 2001; Gerber et al., 1997). To determine whether Myf5 induced chromatin modifications, we transduced M&M MEFs with 1x lenti-MyoD or lenti-Myf5, and then assayed global patterns of H4 acetylation (H4Ac) by ChIP-seq using a pan-H4Ac antibody. Active genes that are not targets of either MyoD or Myf5, such as Fn1, have strong peaks of H4Ac in all samples providing a positive control for each ChIP dataset (Figure 3A). In accordance with previous studies of MyoD (Cao et al., 2010), we found widespread increases in H4Ac adjacent to MyoD binding sites in MyoD-transduced M&M MEFS (Figures 3B and 3C). Transduction with lenti-Myf5 also increased H4Ac around Myf5 bound sites to the same degree as MyoD (Figures 3B–3D), whether we used the sites that met the cut-off criteria as bound by MyoD or bound by Myf5 (Figures 3C and 3D).
Figure 3. MyoD and Myf5 Induce Comparable Levels of Local Histone H4 Acetylation.
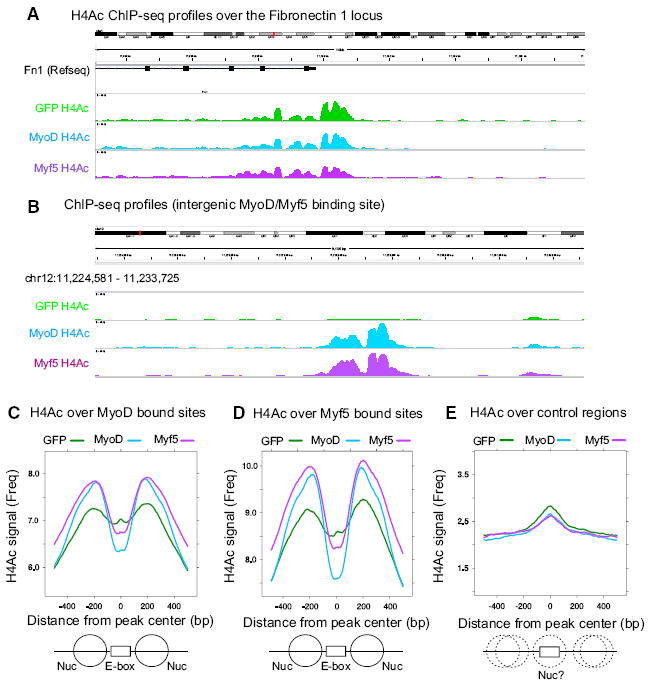
(A and B) H4Ac ChIP-seq reads at the Fibronectin-1 promoter (positive control locus) (A), and an intergenic region of Chr12 surrounding a common MyoD/Myf5 peak (B). M&M MEFs were transduced for 24 hr and then switched into DM for an additional 20 hr.
(C–E) Average H4Ac around MyoD (C), Myf5 (D), or control (E) peak lists from M&M MEFs transduced with lenti-GFP, lenti-MyoD, or lenti-Myf5. “0” denotes the center of the MyoD or Myf5 meta-peaks and the plots extend 500 bp to either side. Control E-boxes are E-boxes bound by MyoD in P19 cells but not in MEFs. The graphic below represents theoretical locations of positioned (solid lines) and non-positioned nucleosomes (dotted lines) surrounding E-box binding sites.
As a control for the specificity of the H4Ac changes we examined H4Ac changes around the set of E-boxes not bound by MyoD or Myf5 in M&M MEFs. We chose E-boxes that are capable of being bound by MyoD in P19 cells, but are not bound by MyoD in M&M MEFs due to occlusion of these E-boxes by nucleosomes (Fong et al., 2012). We find these E-boxes have small peaks of H4Ac in all three samples directly over the E-boxes, indicating that these E-boxes are indeed occluded by nucleosomes in M&M MEFs and are neither bound by, nor have increased H4Ac in response to MyoD or Myf5 (Figure 3E). Taken together, these data indicate that Myf5 and MyoD induce similar levels of local H4Ac at the same genomic sites, despite the relatively poor transcriptional activity of Myf5.
Myf5 Stably Binds E-Boxes but Lacks a Strong Activation Domain
Our previous studies on the neurogenic bHLH transcription factor NeuroD2 identified binding affinity to different E-box sequences as a determinant of whether NeuroD2 would induce both transcription and H4Ac, or only induce H4Ac (Fong et al., 2012, 2015). Although MyoD and Myf5 bind the same sites, it is possible that Myf5 binding is less stable, allowing H4Ac but not transcription. To compare the relative stability of MyoD and Myf5, we used in vitro gel shift assays with probes containing either single or paired E-boxes, similar to the assay used to compare NeuroD2’s relative stability on different sequences (Fong et al., 2015). To determine the off-rates, cold competitor was added to the binding reaction at time = 0 and samples were incubated for a range of times and then loaded onto a running gel (see Experimental Procedures). The decreasing intensity of the shifted probe allows the off-rates between the protein complexes and DNA to be compared. The off-rates from either a single E-box (Figures 4A and 4C) or a paired E-box (Figures 4B and 4D) were similar between MyoD and Myf5. In addition, we tested the binding kinetics of a chimeric protein created by fusing the N-terminal activation domain of MyoD to the N terminus of Myf5 (described below). We found the off-rates for this chimera were nearly identical to MyoD and very similar to Myf5 for both single and paired E-boxes. Based on these in vitro binding assays, we conclude that binding affinity, as indirectly measured by the off-rate, is unlikely to account for the transcriptional difference between MyoD and Myf5.
Figure 4. MyoD and Myf5 Have Similar Binding Kinetics.
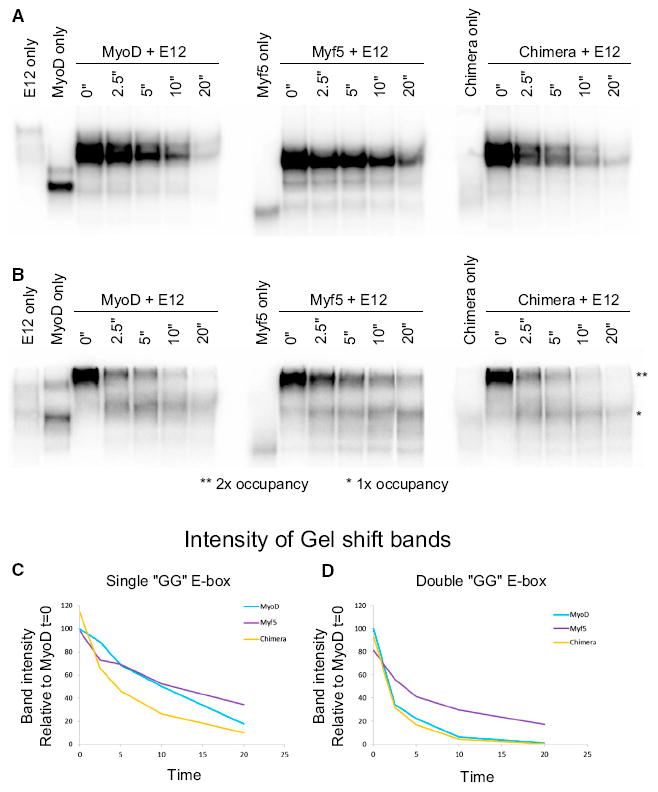
(A and B) EMSA: in vitro translated MyoD, Myf5, or Chimera was mixed with E12 and hot probes containing a single GG E-box (A), or a pair of GG E-boxes (B). The cold competitor is the same sequence as the hot probe.
(C and D) EMSA band intensity is plotted as a function of the time incubated with the cold competitor.
The low induction of myogenic genes coupled with the genome-wide binding data led us to ask whether Myf5 lacks a strong activation domain. We directly compared the activation strength of the non-bHLH domains of MyoD and Myf5 in vivo by fusing portions of each protein to the Gal4 DNA binding domain (Figure 5A). These fusions were co-transfected into C2C12 myoblasts together with a plasmid containing a luciferase gene with four Gal4 binding sites near its promoter. As expected, the previously characterized N-terminal activation domain of MyoD induced robust reporter gene expression (Weintraub, 1990), whereas neither the N-terminal nor C-terminal domain of Myf5 had comparable reporter gene activation (Figure 5B). The MyoD N-terminal activation domain was approximately 11-fold more potent at reporter gene induction than either of the potential activation domains of Myf5. We repeated this experiment in fibroblasts to rule out any muscle-specific MyoD or Myf5 cofactors, with the same result (Figure S4A). Because Myf5 has previously been shown to have two domains that exhibit enhanced transcriptional activity when combined (Braun et al., 1990; Winter et al., 1992), we also replaced the bHLH domains of MyoD and Myf5 with the Gal4 DBD, leaving both the N- and C-terminal regions of MyoD and Myf5 intact in the same fusion protein. Indeed, this showed a slight improvement in the transcriptional activity of the Myf5 fusion protein, but the MyoD fusion protein demonstrated more than a 5-fold higher transcriptional activity (Figure 5B). These results suggested that the relatively weak induction of muscle genes by Myf5 in vivo was due to the absence of a strong activation domain, and that it might be possible to “rescue” the transcriptional activity of Myf5 by adding a stronger activation domain.
Figure 5. Addition of a Strong Acidic Activation Domain to the N Terminus Imbues Myf5 with Robust Gene Activation Potential.
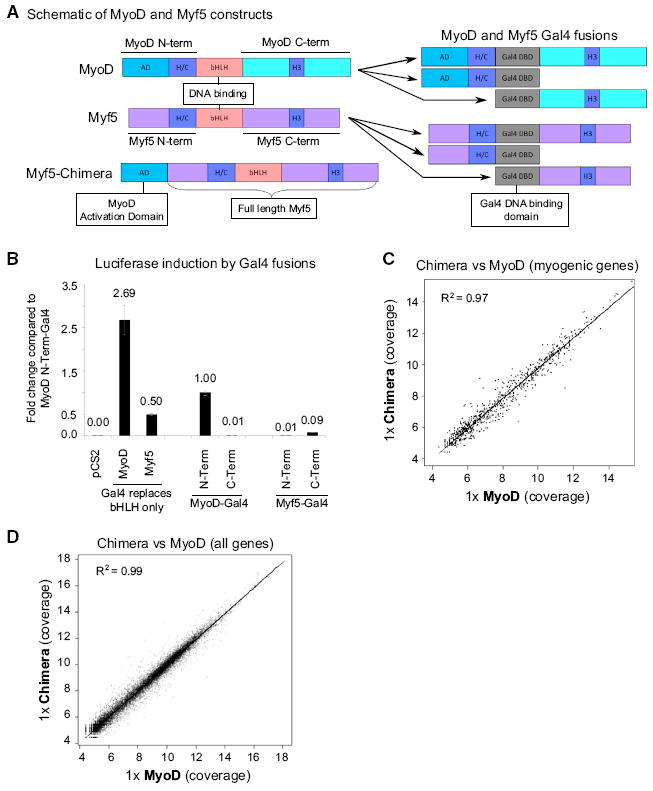
(A) Schematics depicting MyoD and Myf5 domains, the Myf5-Chimera, and the Gal4 fusion constructs. AD, activation domain; H/C, HisCys region (required for interaction with Pbx); H3, helix 3.
(B) Myod- or Myf5-Gal4 fusion constructs were co-expressed in differentiating C2C12s with a Gal4-Luc reporter. The data represent the average of three biological replicates and the error bars represent the SD from the mean.
(C and D) RNA-Seq data from M&M MEFs transduced with either lenti-MyoD or lenti-Chimera for 24 hr and then switched to DM for an additional 20 hr. Genes showing a dose-response to increasing amounts of lenti-GFP were removed from the analysis. The black line indicates a linear trend line fitted to the data. Genes that were induced 2-fold or more (log fold change of 1) by MyoD (C) or all genes (D) are displayed. See also Figure S4.
To test “rescue” of Myf5-induced transcription we fused the N-terminal activation domain of MyoD to the N terminus of Myf5 (Myf5-Chimera) (Figure 5A). In vitro binding assays showed that the Myf5-Chimera bound to MyoD/Myf5 E-boxes with kinetics similar to MyoD and Myf5 (see Figure 4). Lentiviral transduction of M&M MEFs with Myf5, MyoD, and the Myf5-Chimera at equivalent levels showed that the chimera activated endogenous gene expression equivalently to MyoD, based on RT-qPCR of the target genes Myog and Cdh15 (Figure S4B). A comparison of RNA-seq profiles from cells transduced with either MyoD or the Myf5-Chimera demonstrated equivalent genome-wide transcriptional activation after 20 hr in DM (Figures 5C and 5D). Furthermore, equivalent gene induction and morphological changes were observed after 48–72 hr in DM (Figures S4C–S4E), demonstrating that the relatively inefficient transcriptional activation by Myf5 can be complemented by the addition of the MyoD acidic activation domain. Conversely, a chimera that replaced the Myf5 bHLH domain with the bHLH domain of MyoD (Myf5-MDbHLH) lacked the ability to robustly induce gene expression, but was capable of inducing histone H4 acetylation (Figures S4F–S4G). It is interesting to note that a MyoD mutant lacking its N-terminal acidic activation domain maintained the ability to induce H4 acetylation (Figure S4G), indicating that for both Myf5 and MyoD the regions necessary for HAT recruitment function independently from transcriptional activation. Together these results indicate that Myf5 has weaker transcriptional activation domains when compared with MyoD.
Myf5 Does Not Efficiently Recruit Pol II to Myogenic Promoters
Most transactivation domains both recruit Pol II and promote Pol II release. To determine whether the relatively poor transcriptional activity of Myf5 was due to poor recruitment and elongation of Pol II, we examined levels of total Pol II (N-20), unphosphorylated Pol II (8WG16), and elongating Pol II (phosphorylated on Ser2) at myogenic loci following transduction with lenti-GFP, -MyoD, or -Myf5. Inspection of the 5′ and 3′ ends of Myog and Chrng by qPCR of the chromatin immunoprecipitation (ChIP) material demonstrated a robust recruitment of total and unphosphorylated Pol II at the 5′ ends, and elongating Pol II at the 3′ ends in MyoD expressing cells. However, occupancy of all three forms of Pol II was substantially lower following Myf5 transduction (Figures 6A and 6B). This suggested that Myf5 did not efficiently recruit Pol II, as opposed to recruiting Pol II that would remain paused at the promoter. To test if low Pol II recruitment was indeed dependent on the activation domain we repeated the ChIPs for Pol II (using the 8WG16 Ab) and included the Myf5-Chimera in the assay. In accordance with our previous findings, Pol II recruitment to the 5′ end of genes was significantly lower in cells expressing Myf5 (Figures 6C and 6D). In contrast, the chimera recruited Pol II as well as or better than MyoD (Figures 6C and 6D). To ensure our ChIPs were working in each sample, we also assayed a region of ch7 devoid of transcription (negative control) (Figure 6E) and the 5′ region of the highly expressed Fn1 gene (positive control) (Figure 6F). This suggests that the primary reason for poor expression of target genes by Myf5 is inefficient recruitment of Pol II by a strong activation domain. Interestingly, however, co-expression of Myf5 and MyoD in M&M MEFs resulted in target gene expression levels that were greater than the sum achieved by either factor expressed alone, indicating Myf5 is not acting as a repressor or competitive antagonist, but rather might have a positive function in gene regulation that enhances the activity of MyoD (Figure S5).
Figure 6. Pol II Recruitment to Myogenic Loci by MyoD, Myf5, and the Chimera.
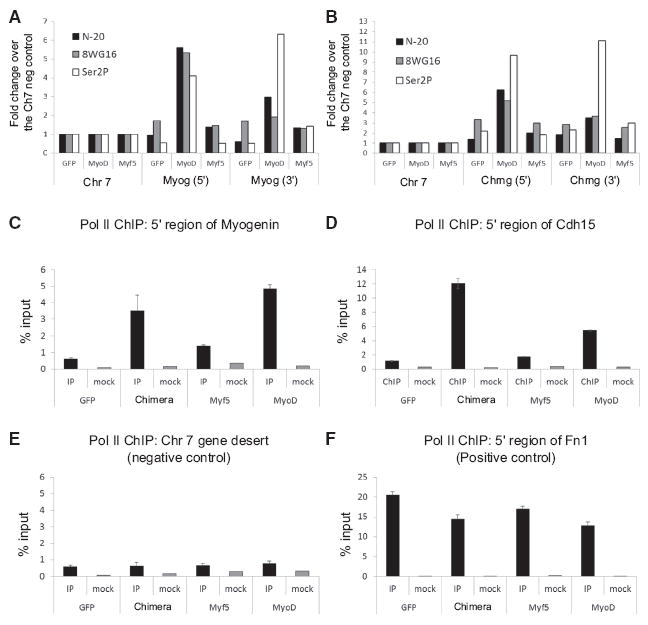
(A and B) Total Pol II (N-20), unphosphorylated Pol II (8WG16), and elongating Pol II (Ser2P) occupancy at the 5′ and 3′ ends of the Myog gene (A), and the Chrng gene (B). A single biological replicate was done for each ChIP and data are represented as the fold change over the Ch7 negative control region to minimize technical differences between the three antibodies.
(C–F) Triplicate ChIPs from each sample using the 8WG16 antibody. Error bars represent the SD of the three ChIPs. A region of chromosome 7 with no annotated genes or transcribed retroelements was used as a negative control (E), and the 5′ end of the Fn1 gene was used as a positive control (F). See also Figure S5.
DISCUSSION
This study demonstrates that the major difference between Myf5 and MyoD is a divergence of transcriptional activity rather than a divergence of binding site/sequence preference. Using balanced MyoD and Myf5 levels we found the binding profiles of MyoD and Myf5 were identical genome-wide; yet robust induction of transcription from myogenic genes was not seen in cells expressing Myf5, a deficiency that was due to a lack of Pol II recruitment by Myf5 rather than a difference in binding stability. However, we found Myf5 is capable of altering chromatin structure by inducing the acetylation of histone H4 around its binding sites. This chromatin remodeling function, together with the evolutionary conservation of Myf5, are consistent with a hierarchical model where the early specification factor works largely through chromatin-based mechanisms and later factors bind to the same sites and drive differentiation through transcriptional activation of the previously chromatin remodeled genes.
Different Efficiencies of Myf5-Driven Muscle Differentiation during Development
Consistent with our findings, the differentiation of muscle satellite cells in adult MyoD-null mice is impaired despite increased expression of Myf5, indicating that Myf5 does not efficiently substitute for MyoD in these cells (Megeney et al., 1996; Sabourin et al., 1999; Yablonka-Reuveni et al., 1999). During embryonic development of MyoD-null mice, differentiation of skeletal muscle occurs in the absence of MyoD (although it is delayed in several muscle groups), and it is thought that the increased levels of Myf5 are sufficient to overcome the lack of MyoD (Kablar et al., 1997; Rudnicki et al., 1992). This phenotype is also consistent with our observation that 4-fold higher levels of Myf5 will partially activate Myog expression and induce MEF differentiation (see Figures S3A–S3C). It is interesting to note, however, that some skeletal muscle forms in the embryo prior to MyoD expression. This muscle formation is delayed in Myf5-null mice (Braun et al., 1992; Ott et al., 1991; Sassoon et al., 1989) and Mrf4-null mice (Patapoutian et al., 1995), and it is likely that this early muscle formation is driven by Myf5 and Mrf4 rather than by MyoD and Myog (Bober et al., 1991; Cusella-De Angelis et al., 1992; Summerbell et al., 2002). In fact, some early myogenesis occurs in Myf5-null mice that is driven by early expression of Mrf4 (Kassar-Duchossoy et al., 2004), suggesting that Mrf4 might substitute for the role of MyoD in some of the early somitic muscle cells. In addition, the different relative dependencies of muscle cells on MyoD for terminal differentiation, such as the ability of elevated levels of Myf5 to drive primary skeletal muscle differentiation in MyoD-null mice but not satellite cell differentiation during muscle regeneration in these mice, suggest that other factors might also influence the transcriptional potency of Myf5, whether through global effects on the efficiency of transcription genome-wide, such as concentrations of mediator factors, or cofactors that specifically interact with Myf5 and other bHLH transcription factors. Future studies focusing on these developmental differences, possibly aided by mice engineered with chimeric myogenic bHLH factors, might be able to determine the basis for the apparently different efficiencies of bHLH driven muscle differentiation in different cells at different developmental stages.
Myf5 Binds the Same Sites Bound by MyoD
Although MyoD/Myog/Mrf4-null mice have reduced body mass, many muscle forming regions, such as the tongue, have comparable numbers of cells as wild-type animals, indicating myoblasts were specified and proliferated but could not differentiate into myofibers (Valdez et al., 2000). Because Myf5 is the first gene to be activated, and because myoblasts were specified in mice with only Myf5, it was suggested that each of the related myogenic bHLH proteins had evolved both specific and redundant functions and that each factor would bind a unique set of E-boxes as well as a set common to more than one family member (Valdez et al., 2000).
A previous study using TAP-tagged MyoD and Myf5 suggested there was limited overlap between the binding of these two proteins (~30%), which could have explained the evolutionary selection to retain both genes (Soleimani et al., 2012). However, we discovered that a C-terminal TAP-tag, like the one used by Soleimani et al., disrupted Myf5 function and blocked normal differentiation when expressed in C2C12 myoblasts (M.L.C., unpublished data). When we investigated the binding patterns of MyoD and Myf5 using untagged versions of the proteins and physiologically relevant expression levels, we found no difference between MyoD and Myf5, indicating a distinct function rather than a difference in binding site preference. Our ChIP-seq studies were performed in M&M MEFs, i.e., MEFs with knockouts of both MyoD and Myf5, to prevent the complication of cross- and auto-activation. Previously we showed that MyoD binds the same sites in these MEFs as in C2C12 cells and primary muscle cells (Cao et al., 2010), indicating that these are an appropriate cell type for the comparison of MyoD and Myf5 binding.
MyoD and Myf5 Have Distinct Roles in Specifying the Muscle Lineage
In mice, Myf5 protein levels become detectable at embryonic day E8 during early muscle commitment, prior to differentiation, while MyoD protein levels are not apparent until day E10 during skeletal muscle differentiation. Both MyoD-null and Myf5-null mice are capable of generating skeletal muscle, indicating a level of redundancy between Myf5 and MyoD. Early experiments using lineage tracing approaches in mice suggested a population of MyoD positive myogenic cells that had never expressed Myf5 (Gensch et al., 2008; Haldar et al., 2008). This led the authors to conclude that perhaps skeletal muscle was really two distinct lineages, one that required Myf5 and one that required MyoD. More recent experiments from Comai et al. (2014) demonstrated that the Myf5 locus does not drive lineage tracing markers with perfect penetrance, leading to cells that express Myf5 but are not marked. In their experiments using the long-lived LacZ as a lineage marker, they found all skeletal muscle cells expressed Myf5 and concluded that skeletal muscle is one lineage and that Myf5 is expressed in all muscle progenitor cells (Comai et al., 2014). Consistent with this conclusion, we found that Myf5 and MyoD have distinct molecular functions at a shared set of binding sites. Given their temporal expression patterns during development, our data suggest that Myf5 and MyoD act sequentially within the same muscle lineage. Our data demonstrating that Myf5 is a weak transcription factor that binds the same sites as MyoD might also explain the lack of muscle in Myf5-knockout mice with Myf5 knocked into the MyoD locus (Haldar et al., 2014).
Lack of Pol II Recruitment Rather Than Unstable Binding Distinguishes Myf5 from MyoD
We considered that the lack of Pol II recruitment and transcriptional activity displayed by Myf5 could be due to unstable binding, and that the formaldehyde crosslinking used in our ChIPs was perhaps trapping relatively transient Myf5 binding events. We compared MyoD and Myf5 binding in vitro by comparing their dissociation rates from target DNA sequences. Because the addition of the N terminus of MyoD to Myf5 rescued the transcriptional defect of Myf5, if the transcriptional defect of Myf5 was due to decreased residency time, we would expect the chimera to have a slower off-rate than Myf5 and to have dissociation kinetics similar to MyoD. However, we discovered very little difference between the off rates of the three on single or paired E-boxes, indicating no inherent difference in binding kinetics or cooperative stability.
Although we saw no difference in the DNA binding stability between MyoD and Myf5, the electrophoretic mobility shift assay (EMSA) experiments were an in vitro measurement of DNA binding. To determine whether a lack of binding stability in vivo might account for the poor activation potential of Myf5, we substituted a Gal4 binding domain for the native bHLH domain and assayed expression of a Gal4 reporter in vivo. Replacing the bHLH binding domain with the Gal4 DNA binding domain demonstrated that the intrinsic activation potential of the MyoD activation domain was much greater than any of the Myf5 activation domains (singly or in combination), again indicating that the defect in transcriptional activation is not due to reduced binding stability. In addition, replacement of the Myf5 bHLH domain with the MyoD bHLH domain demonstrated that the weaker transcriptional activity of Myf5 was not secondary to weaker DNA binding.
Myf5 Induces Chromatin Modification
Histone H4 acetylation is considered a general marker of “open” chromatin and is enriched in both enhancers and promoters (Heintzman et al., 2007). Previously, MyoD binding was demonstrated to induce H4Ac when expressed in fibroblasts (Cao et al., 2010), presumably via interactions with PCAF and P300 (Puri et al., 1997). If Myf5 functions to specify muscle progenitors, then it is likely that Myf5 has a largely chromatin based function. Indeed, we find that Myf5 induces local H4Ac, despite its lack of transcriptional induction. This indicates that Myf5 might functionally precede MyoD during lineage specification by reorganizing chromatin prior to robust transcription of differentiation specific genes. Together with our prior studies showing that Myog binds to the same sites as MyoD but lacks the ability to access genes in native chromatin and initiate chromatin modifications (Bergstrom and Tapscott, 2001; Cao et al., 2006), these studies demonstrate that each of these three bHLH factors has a specific molecular function in the initiation, activation, and maintenance of muscle gene transcription.
Lineage Specification through Chromatin Modification
Our data support a stepwise model where Myf5 has greater activity as a chromatin modifier than a transcriptional activator, MyoD has both functions, and Myog is predominantly a transcriptional activator. In this model, the chromatin modifying activity of Myf5 might facilitate future muscle gene activation by MyoD and Myog, however, it is also interesting to speculate that this activity might also prevent the activation of alternative fates by preventing the expression of those programs. Given that myoblasts originate in the dermomyotome alongside other lineages, such as chondroblasts, Myf5 may be important for preventing non-myogenic fates in the cells that express it. Indeed, in Myf5 null mice, LacZ staining indicates that cells destined to become muscle undergo the correct epithelial-to-mesenchymal transition in the developing somite, but can migrate aberrantly and adopt alternative fates. These cells express the cartilage marker scleraxis, and the multi-tissue (but non-myogenic) gene Twist2 (aka Dermo-1), indicating incorrect specification of portions of the dermomyotome (Tajbakhsh et al., 1996). Taken together, these data suggest Myf5 might not only set up a genome-wide chromatin structure that is permissive for myogenesis but is also refractory to chondrogenesis. One clear conclusion, however, is that the initial specification of the skeletal muscle lineage by Myf5 is not accomplished by robust transcription of the gene networks associated with skeletal muscle differentiation and likely acts via lineage-specific chromatin modifications.
EXPERIMENTAL PROCEDURES
qPCR Primers and EMSA Oligos
Antibodies
Plasmids
Cell Culture
M&M MEFs were maintained in Dulbecco’s modified Eagle’s medium (DMEM) supplemented with 10% fetal bovine serum and 1% penicillin-streptomycin (Gibco). Murine C2C12 myoblasts were collected and cultured as has been previously described in DMEM + FBS (Cao et al., 2006). Low-serum DM consisted of DMEM with 1% horse serum, 1% penicillin-streptomycin, and 10 μg/ml each insulin and transferrin.
Determination of Endogenous MyoD and Myf5 Levels
MyoD and Myf5 protein and RNA were isolated from M&M MEFs transduced with a range of lenti-MyoD or lenti-Myf5 infection titers and compared with protein and RNA isolated from differentiating C2C12 myoblasts. See Supplemental Experimental Procedures for additional information.
Balancing MyoD and Myf5 Protein Levels
To determine that MyoD and Myf5 were expressed at equivalent protein levels, we devised a way to compare them with Flag-tagged standards using quantitative western blots. See Figure S2 and Supplemental Experimental Procedures for additional information.
Immunofluorescence
Cells were fixed for 7 min in 2% paraformaldehyde. Fixation was quenched with glycine (final concentration of 10 mM). Cells were permeabilized with PBS containing 0.5% Triton X-100 for 10 min and then blocked with 2% BSA for 1 hr. Cells were probed overnight at 4°C with the anti-MHC antibody MF-20.
RNA-Seq
RNA-seq and gene expression profiles were compared using the Bio-conductor package edgeR as done previously by Fong et al. (2012). See Supplemental Experimental Procedures for additional information.
xChIP-Seq for MyoD and Myf5
Cross-linked ChIP was performed as previously described (Cao et al., 2010). See Supplemental Experimental Procedures for additional information.
mxChIP-Seq for Pol II
Cross-linked ChIP coupled with MNase digestion was performed as described in Skene and Henikoff (2015) with two modifications: decreased MNase concentration (15 U of Worthington MNase incubated at 37°C for 15 min) and greater sonication intensity (4 pulses at 30% amplitude, 15 s per pulse with 1 min rest between pulses). Pol II antibodies were pre-bound to Protein G Dynabeads according to the manufacturer’s directions. Beads were washed and DNA was isolated according to the Skene and Henikoff protocol.
nChIP-Seq for H4AC
Native ChIP for histone acetylation was performed by combining the nuclei isolation protocol from Gerber et al. (1997) and the MNase digestion and chromatin extraction method from Cao et al. (2010). See Supplemental Experimental Procedures for additional information.
ChIP Peak Calling
We used a peak calling and comparison approach previously used by Fong et al. (2012). See Supplemental Experimental Procedures for additional information.
ChIP-Seq Sample Comparison
Because it is unclear how to set up a fair comparison baseline due to the differences in the antibodies, total number of reads, and foreground/background read distribution, we adopted a rank-based paradigm to compare ChIP-seq samples of different transcription factors while still taking the peak p value significance into account, as previously described in Fong et al. (2012). We ranked all peaks by their p values and grouped them by their ranks into bins of 5,000 (i.e., the top 5K peaks, then the top 10K peaks, etc). Then we computed the fraction of top x peaks in one sample that overlap with the top y peaks in another sample, where x and y vary from 5K to 50K, and y is equal to or greater than x.
Motif Enrichment Analysis
We used a discriminative de novo motif discovery tool described previously (Cao et al., 2010; Palii et al., 2011) to find motifs that distinguish foreground and background sequence datasets. See Supplemental Experimental Procedures for additional information.
Luciferase Assays Using Gal4 Reporters
MyoD and Myf5 domains fused to the GAL4 DNA binding domain were assayed for activation of a Gal4-dependent luciferase reporter. C2C12s were transfected with effector plasmids (Gal4 DNA binding domain fused to portions of MyoD or Myf5) and the pGal4 reporter plasmid. Cells were grown for 24 hr after transfection and then assayed as above using the Promega Dual-Luciferase Reporter system. For these luciferase assays we normalized the Luc/Ren values for each sample to the average Luc/Ren signal for MyoD-NTerm-Gal4 effector plasmid samples.
Gel Shifts
Proteins were translated in rabbit reticulocyte lysate using the Promega TNT quick-coupled translation kit according to the manufacturer’s directions. 32P-labeled oligos were incubated with their reverse complements and then allowed to slow cool overnight to form duplex DNA probes. For each gel shift reaction, 1.75 μl of each in vitro translated protein was combined in a 30 μl reaction containing: 20 mM HEPES [pH 7.6], 50 mM KCl, 1.5 mM MgCl2, 10 mM DTT, and 1 mM EDTA, and then incubated at 37°C for 20 min to allow complexes to form. 1 ng of hot probe was added to each reaction and they were incubated at room temperature for 15 min to reach equilibrium binding. Cold competitor was added at various times such that all reactions were assayed at the same time. At time = 0, all samples were placed on ice and then loaded onto a running gel (200 V) as quickly as possible. Samples were run on non-denaturing, 6% Tris-borate-EDTA acrylamide gels. Signal was assayed using phosphoimager screens and the bands were quantified using Amersham’s ImageQuant software.
Supplementary Material
Highlights.
Myf5 and MyoD bind a nearly identical set of sites genome-wide
Myf5 and MyoD induce comparable levels of H4 acetylation around their binding sites
Myf5 lacks a strong activation domain and does not induce robust transcription
MyoD and Myf5 have diverged in function rather than DNA motif binding specificity
Acknowledgments
We would like to thank Chao-Jen Wong for assistance with R graphics and motif analysis and members of the Tapscott and Groudine laboratories for critical reading of the manuscript and valuable advice over the course of this project. This work was supported by NIH NIAMS R01AR045113 (SJT), NIH R37 DK44746 and R01 HL65440 (MG), Cardiovascular Pathology Training Grant NIH T32 HL007312 (MLC), and NIH U54 DK106829 Cooperative Center of Excellence in Hematology Grant to support the FHCRC viral production core.
Footnotes
AUTHOR CONTRIBUTIONS
Overall experimental design and manuscript preparation was performed by M.L.C., M.G., and S.J.T. M.L.C performed the majority of the experiments and data analysis. The RNA-seq and ChIP-seq computational analyses were performed by Z.Y., and the luciferase study was performed by J.Z.
ACCESSION NUMBERS
The accession number for the ChIP-seq and RNA-seq data reported here is Gene Expression Omnibus (GEO) database GEO: GSE75370.
SUPPLEMENTAL INFORMATION
Supplemental Information includes Supplemental Experimental Procedures and five figures and can be found with this article online at http://dx.doi.org/10.1016/j.devcel.2016.01.021.
References
- Bergstrom DA, Tapscott SJ. Molecular distinction between specification and differentiation in the myogenic basic helix-loop-helix transcription factor family. Mol Cell Biol. 2001;21:2404–2412. doi: 10.1128/MCB.21.7.2404-2412.2001. [DOI] [PMC free article] [PubMed] [Google Scholar]
- Bober E, Lyons GE, Braun T, Cossu G, Buckingham M, Arnold HH. The muscle regulatory gene, Myf-6, has a biphasic pattern of expression during early mouse development. J Cell Biol. 1991;113:1255–1265. doi: 10.1083/jcb.113.6.1255. [DOI] [PMC free article] [PubMed] [Google Scholar]
- Braun T, Winter B, Bober E, Arnold HH. Transcriptional activation domain of the muscle-specific gene-regulatory protein myf5. Nature. 1990;346:663–665. doi: 10.1038/346663a0. [DOI] [PubMed] [Google Scholar]
- Barun T, Rudnicki MA, Arnold HH, Jaenisch R. Targeted inactivation of the muscle regulatory gene Myf-5 results in abnormal rib development and perinatal death. Cell. 1992;71:369–382. doi: 10.1016/0092-8674(92)90507-9. [DOI] [PubMed] [Google Scholar]
- Braun T, Bober E, Rudnicki MA, Jaenisch R, Arnold HH. MyoD expression marks the onset of skeletal myogenesis in Myf-5 mutant mice. Development. 1994;120:3083–3092. doi: 10.1242/dev.120.11.3083. [DOI] [PubMed] [Google Scholar]
- Cao Y, Kumar RM, Penn BH, Berkes CA, Kooperberg C, Boyer LA, Young RA, Tapscott SJ. Global and gene-specific analyses show distinct roles for Myod and Myog at a common set of promoters. EMBO J. 2006;25:502–511. doi: 10.1038/sj.emboj.7600958. [DOI] [PMC free article] [PubMed] [Google Scholar]
- Cao Y, Yao Z, Sarkar D, Lawrence M, Sanchez GJ, Parker MH, MacQuarrie KL, Davison J, Morgan MT, Ruzzo WL, et al. Genome-wide MyoD binding in skeletal muscle cells: a potential for broad cellular reprogramming. Dev Cell. 2010;18:662–674. doi: 10.1016/j.devcel.2010.02.014. [DOI] [PMC free article] [PubMed] [Google Scholar]
- Comai G, Sambasivan R, Gopalakrishnan S, Tajbakhsh S. Variations in the efficiency of lineage marking and ablation confound distinctions between myogenic cell populations. Dev Cell. 2014;31:654–667. doi: 10.1016/j.devcel.2014.11.005. [DOI] [PubMed] [Google Scholar]
- Cusella-De Angelis MG, Lyons G, Sonnino C, De Angelis L, Vivarelli E, Farmer K, Wright WE, Molinaro M, Bouche M, Buckingham M, et al. MyoD, myogenin independent differentiation of primordial myoblasts in mouse somites. J Cell Biol. 1992;116:1243–1255. doi: 10.1083/jcb.116.5.1243. [DOI] [PMC free article] [PubMed] [Google Scholar]
- de la Serna IL, Roy K, Carlson KA, Imbalzano AN. MyoD can induce cell cycle arrest but not muscle differentiation in the presence of dominant negative SWI/SNF chromatin remodeling enzymes. J Biol Chem. 2001;276:41486–41491. doi: 10.1074/jbc.M107281200. [DOI] [PubMed] [Google Scholar]
- Fong AP, Yao Z, Zhong JW, Cao Y, Ruzzo WL, Gentleman RC, Tapscott SJ. Genetic and epigenetic determinants of neurogenesis and myogenesis. Dev Cell. 2012;22:721–735. doi: 10.1016/j.devcel.2012.01.015. [DOI] [PMC free article] [PubMed] [Google Scholar]
- Fong AP, Yao Z, Zhong JW, Johnson NM, Farr GH, Maves L, Tapscott SJ. Conversion of MyoD to a neurogenic factor: binding site specificity determines lineage. Cell Rep. 2015;10:1937–1946. doi: 10.1016/j.celrep.2015.02.055. [DOI] [PMC free article] [PubMed] [Google Scholar]
- Gabay L, Scholz H, Golembo M, Klaes A, Shilo BZ, Klambt C. EGF receptor signaling induces pointed P1 transcription and inactivates Yan protein in the Drosophila embryonic ventral ectoderm. Development. 1996;122:3355–3362. doi: 10.1242/dev.122.11.3355. [DOI] [PubMed] [Google Scholar]
- Gensch N, Borchardt T, Schneider A, Riethmacher D, Braun T. Different autonomous myogenic cell populations revealed by ablation of Myf5-expressing cells during mouse embryogenesis. Development. 2008;135:1597–1604. doi: 10.1242/dev.019331. [DOI] [PubMed] [Google Scholar]
- Gerber AN, Klesert TR, Bergstrom DA, Tapscott SJ. Two domains of MyoD mediate transcriptional activation of genes in repressive chromatin: a mechanism for lineage determination in myogenesis. Genes Dev. 1997;11:436–450. doi: 10.1101/gad.11.4.436. [DOI] [PubMed] [Google Scholar]
- Gray KA, Yates B, Seal RL, Wright MW, Bruford EA. Genenames.org: the HGNC resources in 2015. Nucleic Acids Res. 2015;43:D1079–D1085. doi: 10.1093/nar/gku1071. [DOI] [PMC free article] [PubMed] [Google Scholar]
- Haldar M, Karan G, Tvrdik P, Capecchi MR. Two cell lineages, myf5 and myf5-independent, participate in mouse skeletal myogenesis. Dev Cell. 2008;14:437–445. doi: 10.1016/j.devcel.2008.01.002. [DOI] [PMC free article] [PubMed] [Google Scholar]
- Haldar M, Karan G, Watanabe S, Guenther S, Braun T, Capecchi Mario R. Response: contributions of the Myf5-independent lineage to myogenesis. Dev Cell. 2014;31:539–541. doi: 10.1016/j.devcel.2014.11.010. [DOI] [PMC free article] [PubMed] [Google Scholar]
- Heintzman ND, Stuart RK, Hon G, Fu Y, Ching CW, Hawkins RD, Barrera LO, Van Calcar S, Qu C, Ching KA, et al. Distinct and predictive chromatin signatures of transcriptional promoters and enhancers in the human genome. Nat Genet. 2007;39:311–318. doi: 10.1038/ng1966. [DOI] [PubMed] [Google Scholar]
- Hollenhorst PC, Shah AA, Hopkins C, Graves BJ. Genome-wide analyses reveal properties of redundant and specific promoter occupancy within the ETS gene family. Genes Dev. 2007;21:1882–1894. doi: 10.1101/gad.1561707. [DOI] [PMC free article] [PubMed] [Google Scholar]
- Hollenhorst PC, Chandler KJ, Poulsen RL, Johnson WE, Speck NA, Graves BJ. DNA specificity determinants associate with distinct transcription factor functions. PLoS Genet. 2009;5:e1000778. doi: 10.1371/journal.pgen.1000778. [DOI] [PMC free article] [PubMed] [Google Scholar]
- Kablar B, Krastel K, Ying C, Asakura A, Tapscott SJ, Rudnicki MA. MyoD and Myf-5 differentially regulate the development of limb versus trunk skeletal muscle. Development. 1997;124:4729–4738. doi: 10.1242/dev.124.23.4729. [DOI] [PubMed] [Google Scholar]
- Kassar-Duchossoy L, Gayraud-Morel B, Gomes D, Rocancourt D, Buckingham M, Shinin V, Tajbakhsh S. Mrf4 determines skeletal muscle identity in Myf5:Myod double-mutant mice. Nature. 2004;431:466–471. doi: 10.1038/nature02876. [DOI] [PubMed] [Google Scholar]
- Leung TH, Hoffmann A, Baltimore D. One nucleotide in a κB site can determine cofactor specificity for NF-κB dimers. Cell. 2004;118:453–464. doi: 10.1016/j.cell.2004.08.007. [DOI] [PubMed] [Google Scholar]
- Megeney LA, Kablar B, Garrett K, Anderson JE, Rudnicki MA. MyoD is required for myogenic stem cell function in adult skeletal muscle. Genes Dev. 1996;10:1173–1183. doi: 10.1101/gad.10.10.1173. [DOI] [PubMed] [Google Scholar]
- Meijsing SH, Pufall MA, So AY, Bates DL, Chen L, Yamamoto KR. DNA binding site sequence directs glucocorticoid receptor structure and activity. Science. 2009;324:407–410. doi: 10.1126/science.1164265. [DOI] [PMC free article] [PubMed] [Google Scholar]
- Ott MO, Bober E, Lyons G, Arnold H, Buckingham M. Early expression of the myogenic regulatory gene, myf-5, in precursor cells of skeletal muscle in the mouse embryo. Development. 1991;111:1097–1107. doi: 10.1242/dev.111.4.1097. [DOI] [PubMed] [Google Scholar]
- Palii CG, Perez-Iratxeta C, Yao Z, Cao Y, Dai F, Davison J, Atkins H, Allan D, Dilworth FJ, Gentleman R. Differential genomic targeting of the transcription factor TAL1 in alternate haematopoietic lineages. EMBO J. 2011;30:494–509. doi: 10.1038/emboj.2010.342. [DOI] [PMC free article] [PubMed] [Google Scholar]
- Patapoutian A, Yoon JK, Miner JH, Wang S, Stark K, Wold B. Disruption of the mouse MRF4 gene identifies multiple waves of myogenesis in the myotome. Development. 1995;121:3347–3358. doi: 10.1242/dev.121.10.3347. [DOI] [PubMed] [Google Scholar]
- Puri PL, Sartorelli V, Yang X-J, Hamamori Y, Ogryzko VV, Howard BH, Kedes L, Wang JYJ, Graessmann A, Nakatani Y, et al. Differential roles of p300 and PCAF acetyltransferases in muscle differentiation. Mol Cell. 1997;1:35–45. doi: 10.1016/s1097-2765(00)80005-2. [DOI] [PubMed] [Google Scholar]
- Rastinejad F. Retinoid X receptor and its partners in the nuclear receptor family. Curr Opin Struct Biol. 2001;11:33–38. doi: 10.1016/s0959-440x(00)00165-2. [DOI] [PubMed] [Google Scholar]
- Rudnicki MA, Braun T, Hinuma S, Jaenisch R. Inactivation of MyoD in mice leads to up-regulation of the myogenic HLH gene Myf-5 and results in apparently normal muscle development. Cell. 1992;71:383–390. doi: 10.1016/0092-8674(92)90508-a. [DOI] [PubMed] [Google Scholar]
- Sabourin LA, Girgis-Gabardo A, Seale P, Asakura A, Rudnicki MA. Reduced differentiation potential of primary MyoD-/- myogenic cells derived from adult skeletal muscle. J Cell Biol. 1999;144:631–643. doi: 10.1083/jcb.144.4.631. [DOI] [PMC free article] [PubMed] [Google Scholar]
- Sassoon D, Lyons G, Wright WE, Lin V, Lassar A, Weintraub H, Buckingham M. Expression of two myogenic regulatory factors myogenin and MyoDl during mouse embryogenesis. Nature. 1989;341:303–307. doi: 10.1038/341303a0. [DOI] [PubMed] [Google Scholar]
- Simionato E, Ledent V, Richards G, Thomas-Chollier M, Kerner P, Coornaert D, Degnan B, Vervoort M. Origin and diversification of the basic helix-loop-helix gene family in metazoans: insights from comparative genomics. BMC Evol Biol. 2007;7:33. doi: 10.1186/1471-2148-7-33. [DOI] [PMC free article] [PubMed] [Google Scholar]
- Skene PJ, Henikoff S. A simple method for generating high-resolution maps of genome wide protein binding. Elife. 2015;4:e09225. doi: 10.7554/eLife.09225. [DOI] [PMC free article] [PubMed] [Google Scholar]
- Skinner MK, Rawls A, Wilson-Rawls J, Roalson EH. Basic helix-loop-helix transcription factor gene family phylogenetics and nomenclature. Differentiation. 2010;80:1–8. doi: 10.1016/j.diff.2010.02.003. [DOI] [PMC free article] [PubMed] [Google Scholar]
- Soleimani VD, Yin H, Jahani-Asl A, Ming H, Kockx CE, van Ijcken WF, Grosveld F, Rudnicki MA. Snail regulates MyoD binding-site occupancy to direct enhancer switching and differentiation-specific transcription in myogenesis. Mol Cell. 2012;47:457–468. doi: 10.1016/j.molcel.2012.05.046. [DOI] [PMC free article] [PubMed] [Google Scholar]
- Stevaux O, Dyson NJ. A revised picture of the E2F transcriptional network and RB function. Curr Opin Cell Biol. 2002;14:684–691. doi: 10.1016/s0955-0674(02)00388-5. [DOI] [PubMed] [Google Scholar]
- Summerbell D, Halai C, Rigby PW. Expression of the myogenic regulatory factor Mrf4 precedes or is contemporaneous with that of Myf5 in the somitic bud. Mech Dev. 2002;117:331–335. doi: 10.1016/s0925-4773(02)00208-3. [DOI] [PubMed] [Google Scholar]
- Tajbakhsh S, Rocancourt D, Buckingham M. Muscle progenitor cells failing to respond to positional cues adopt non-myogenic fates in myf-5 null mice. Nature. 1996;384:266–270. doi: 10.1038/384266a0. [DOI] [PubMed] [Google Scholar]
- Takahashi Y, Rayman JB, Dynlacht BD. Analysis of promoter binding by the E2F and pRB families in vivo: distinct E2F proteins mediate activation and repression. Genes Dev. 2000;14:804–816. [PMC free article] [PubMed] [Google Scholar]
- Valdez MR, Richardson JA, Klein WH, Olson EN. Failure of Myf5 to support myogenic differentiation without myogenin, MyoD, and MRF4. Dev Biol. 2000;219:287–298. doi: 10.1006/dbio.2000.9621. [DOI] [PubMed] [Google Scholar]
- Weintraub H, Dwarki VJ, Verma I, Davis R, Hollenberg S, Snider L, Lassar A, Tapscott SJ. Muscle-specific transcriptional activation by MyoD. Genes Dev. 1991;5:1377–1386. doi: 10.1101/gad.5.8.1377. [DOI] [PubMed] [Google Scholar]
- Winter B, Braun T, Arnold HH. Co-operativity of functional domains in the muscle-specific transcription factor Myf-5. EMBO J. 1992;11:1843–1855. doi: 10.1002/j.1460-2075.1992.tb05236.x. [DOI] [PMC free article] [PubMed] [Google Scholar]
- Yablonka-Reuveni Z, Rudnicki MA, Rivera AJ, Primig M, Anderson JE, Natanson P. The transition from proliferation to differentiation is delayed in satellite cells from mice lacking MyoD. Dev Biol. 1999;210:440–455. doi: 10.1006/dbio.1999.9284. [DOI] [PMC free article] [PubMed] [Google Scholar]
Associated Data
This section collects any data citations, data availability statements, or supplementary materials included in this article.