Introduction
Major structural birth defects collectively affect 3 to 5% of births in the United States and contribute substantially to mortality and morbidity (CDC, 2008; TDSHS, 2015). Since 2000, the National Birth Defects Prevention Network (NBDPN) has annually published state-specific data for selected major birth defects affecting a range of organ systems, including central nervous, eye, ear, cardiovascular, orofacial, gastrointestinal, genitourinary, and musculoskeletal, as well as chromosomal and other conditions, such as amniotic bands. While the NBPDN list of birth defects had remained relatively unchanged for two decades, it was recently revised and released with the 2014 NBDPN Annual Report (Mai et al., 2014). Several factors necessitated an in-depth examination of the list of conditions: (1) development of national data quality standards for birth defects surveillance in the United States; (2) transition of the diagnostic coding system from the International Classification of Diseases, 9th Revision, Clinical Modification (ICD-9-CM) to ICD-10-CM; and (3) inclusion of newborn screening for critical congenital heart defects (CCHD), with 12 primary and secondary CCHD targets, on the national Recommended Uniform Screening Panel. The revision process included a review of each condition in relation to its public health importance, state of current knowledge, and clinical factors, such as accuracy of diagnosis within a child’s first year of life. Table 1 presents the revised list of birth defects and their diagnostic codes [ICD-9-CM and Centers for Disease Control and Prevention/British Pediatric Association Classification of Diseases (CDC/BPA)].
TABLE 1.
National Birth Defects Prevention Network (NBDPN) List of Reported Birth Defects by Disease Classification Codes
| Birth defects | Disease classification codes | |
|---|---|---|
| International Classification of Diseases, 9th Revision, Clinical Modification (ICD-9-CM) | Centers for Disease Control and Prevention/British Pediatric Association Classification of Diseases (CDC/BPA) | |
| Central nervous system | ||
| Anencephaly | 740.0 – 740.1 | 740.00 – 740.10 |
| Spina bifida without anencephaly | 741.0, 741.9 without 740.0 – 740.1 |
741.00 – 741.99 without 740.00 – 740.10 |
| Encephalocele | 742.0 | 742.00 – 742.09 |
| Holoprosencephaly | 742.2 | 742.26 |
| Eye | ||
| Anophthalmia/microphthalmia | 743.0, 743.1 | 743.00 – 743.10 |
| Congenital cataract | 743.30 – 743.34 | 743.32 |
| Ear | ||
| Anotia/microtia | 744.01, 744.23 | 744.01, 744.21 |
| Cardiovascular | ||
| Common truncus (truncus arteriosus) | 745.0 | 745.00 (excluding 745.01) |
| Transposition of the great arteries (TGA) | 745.10, .12, .19 | 745.10 – 745.12, 745.18 – 745.19 |
| dextro-Transposition of great arteries (d-TGA) – for CCHD screeninga | 745.10 | 745.10, 745.11,745.19 |
| Tetralogy of Fallot | 745.2 | 745.20 – 745.21, 747.31 |
| Ventricular septal defect | 745.4 | 745.40 – 745.49 (excluding 745.487, 745.498) |
| Atrial septal defect | 745.5 | 745.51 – 745.59 |
| Atrioventricular septal defect (endocardial cushion defect) | 745.60, .61, .69 | 745.60 – 745.69, 745.487 |
| Pulmonary valve atresia and stenosis | 746.01, 746.02 | 746.00, 746.01 |
| Pulmonary valve atresia – or CCHD screeninga | 746.01 | 746.00 |
| Tricuspid valve atresia and stenosis | 746.1 | 746.100, 746.106 (excluding 746.105) |
| Tricuspid valve atresia– for CCHD screeninga | 746.1 | 746.100 |
| Ebstein anomaly | 746.2 | 746.20 |
| Aortic valve stenosis | 746.3 | 746.30 |
| Hypoplastic left heart syndrome | 746.7 | 746.70 |
| Coarctation of aorta | 747.10 | 747.10 – 747.19 |
| Total anomalous pulmonary venous connection | 747.41 | 747.42 |
| Single ventricle | 745.3 | 745.3 |
| Interrupted aortic arch | 747.11 | 747.215 – 747.217 |
| Double outlet right ventricle | 745.11 | 745.13 – 745.15 |
| Orofacial | ||
| Cleft palate alone (without cleft lip) | 749.0 | 749.00 – 749.09 |
| Cleft lip alone (without cleft palate) | 749.1 | 749.10 – 749.19 |
| Cleft lip with cleft palate | 749.20–749.25 | 749.20 – 749.29 |
| Choanal atresia | 748.0 | 748.00 |
| Gastrointestinal | ||
| Esophageal atresia/tracheoesophageal fistula | 750.3 | 750.30 – 750.35 |
| Rectal and large intestinal atresia/stenosis | 751.2 | 751.20 – 751.24 |
| Biliary atresia | 751.61 | 751.65 |
| Small intestinal atresia/stenosis | 751.1 | 751.10 – 751.19 |
| Genitourinary | ||
| Renal agenesis/hypoplasia | 753.0 | 753.00 – 753.01 |
| Bladder exstrophy | 753.5 | 753.50 |
| Hypospadias | 752.61 | 752.60 – 752.62 (excluding 752.61 and 752.621) |
| Congenital posterior urethral valves | 753.6 | 753.60 |
| Cloacal exstrophy | 751.5 | 751.555 |
| Musculoskeletal | ||
| Gastroschisis | 756.73 (as of 10/1/09) | 756.71 |
| Omphalocele | 756.72 (as of 10/1/09) | 756.70 |
| Diaphragmatic hernia | 756.6 | 756.610 – 756.617 |
| Limb deficiencies (reduction defects) | 755.2 – 755.4 | 755.20 – 755.49 |
| Craniosynostosis | No specific code | 756.00 – 756.03 |
| Clubfoot | 754.51, 754.70 | 754.50, 754.73 (excluding 754.735) |
| Chromosomal | ||
| Trisomy 13 | 758.1 | 758.10 – 758.19 |
| Trisomy 21 (Down syndrome) | 758.0 | 758.00 – 758.09 |
| Trisomy 18 | 758.2 | 758.20 – 758.29 |
| Turner syndrome | 758.6 | 758.60 – 758.69 |
| Deletion 22q11.2 | 758.32 | 758.37 |
The primary targets for CCHD screening include seven conditions: hypoplastic left heart syndrome, pulmonary atresia with intact septum, tetralogy of Fallot, total anomalous pulmonary venous connection, dextro-transposition of great arteries (d-TGA), tricuspid atresia, and truncus arteriosus. The NBDPN traditionally monitors all TGA, and both atresia and stenosis for pulmonary and tricuspid valve conditions; however, for CCHD screening reporting purpose, these conditions are also reported as d-TGA, pulmonary valve atresia, and tricuspid valve atresia.
CCHD, critical congenital heart defect.
The data component of the 2015 NBDPN Annual Report comprises: (1) state-specific data from 41 population-based birth defects surveillance programs for the 47 major birth defects listed in Table 1; (2) a directory of state birth defects surveillance programs, which details data collection, surveillance methodology, and birth defects contacts; and (3) a descriptive data brief further highlighting the variability in prevalence estimates across population-based birth defects programs.
State-Specific Data Collection and Presentation of 47 Major Birth Defects
Starting in February 2015, the NBDPN Data Committee, in collaboration with CDC, reviewed and refined the data collection process. This included updating the data dictionary and determining the focus of the data brief. A call for data was then issued in April 2015 to population-based birth defects surveillance programs in the United States. Programs were asked to submit data using templates provided in Excel or SAS (SAS Institute, Inc., Cary, NC). CDC performed data quality checks, and state programs validated their data and approved final data table presentation.
Participating birth defects surveillance programs submitted case counts of the reportable birth defects shown in Table 1 and the number of live births occurring from January 1, 2008 through December 31, 2012. These cases were stratified by U.S. Census maternal racial/ethnic groups: non-Hispanic white, non-Hispanic black, Hispanic, non-Hispanic Asian/Pacific Islander, non-Hispanic American Indian/Alaska Native, and other/unknown. Additionally, as maternal age is strongly associated with selected trisomies and gastroschisis, case counts for these defects were submitted stratified by maternal age at delivery in six categories: less than 20 years, 20 to 24 years, 25 to 29 years, 30 to 34 years, 35 to 39 years, and 40 + years.
STATE-SPECIFIC DATA PRESENTATION
State-specific data from 41 population-based birth defects surveillance programs for 2008 to 2012 are shown electronically at Supporting Information. The data are presented in two tables for each state program. The first table shows birth defect counts and prevalence per 10,000 live births by maternal racial/ethnic categories. The second table presents counts and prevalence for trisomies and gastroschisis by two maternal age categories (less than 35 years, 35 + years). The prevalence is calculated by dividing the number of birth defect cases for any pregnancy outcome by the total number of live births for the reported years and then multiplying by 10,000 (Mason et al., 2005). The denominator used to calculate the prevalence for all birth defects is total live births except for hypospadias and Turner syndrome, which are calculated using total male live births and total female live births, respectively.
State-specific notes and clarifications about the data, such as methodologic changes and inclusion of probable/possible diagnoses, are included in the data tables. Additional information about each state program methodology is available in the accompanying birth defects program directory.
Descriptive Data Brief on Observed Variability in Prevalence Estimates Across Population-Based Birth Defects Programs
This descriptive data brief includes prevalence-based summaries for birth defects listed in Table 1 from 38 of the 41 population-based birth defects surveillance programs contributing data to this report (three programs were excluded in the data brief due to their level of data aggregation). State programs were grouped by their case-finding approach (active or passive). The 15 programs in the active case-finding category were: Arizona, Arkansas, Delaware, Georgia (metropolitan Atlanta), Iowa, Louisiana, Massachusetts, Minnesota, New Hampshire, North Carolina, Oklahoma, Puerto Rico, South Carolina, Texas, and Utah; 23 programs in the passive case-finding category were: Colorado, Florida, Illinois, Indiana, Kansas, Kentucky, Maine, Maryland, Michigan, Mississippi, Missouri, Nebraska, Nevada, New Jersey, New Mexico, New York, Oregon, Rhode Island, Tennessee, Vermont, Virginia, West Virginia, and Wisconsin.
The defects are displayed by organ system (Tables 2A: central nervous; 2B: ear and eye; 2C: cardiovascular; 2D: orofacial; 2E: gastrointestinal; 2F: genitourinary; 2G: musculoskeletal; and 2H: chromosomal). Within each organ system, the conditions are then presented, when possible, in order by the magnitude of the distribution of the prevalence estimates submitted from the 38 birth defects surveillance programs.
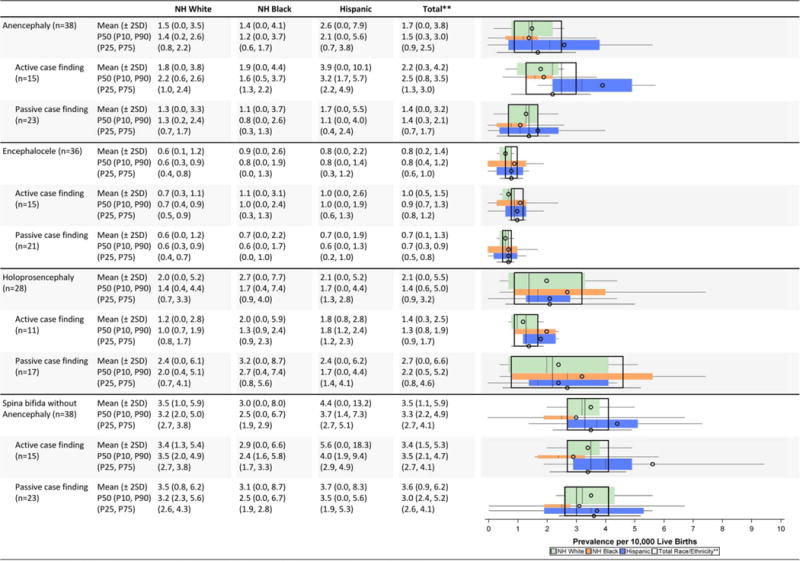
TABLE 2A.
Central Nervous System Defects Prevalence Estimates (Prevalence Per 10,000 Live Births): Measures of Central Tendency and Dispersion by Case-Finding Methodology and Maternal Race/ethnicity, 2008–2012.
|
Total also includes Asian and Pacific Islander, American Indian/Alaska Native and other/unknown race/ethnicity.
NH=Non-Hispanic; n=number of state programs; Chebyshev interval=Mean ± 2 Standard Deviations (SD); P10=10th percentile; P25=25th percentile; P75=75th percentile; P90=90tb percentile
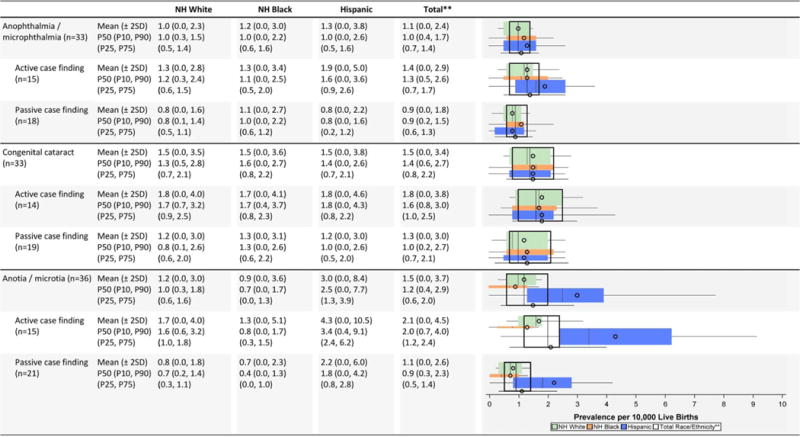
TABLE 2B.
Eye and Ear Defects Prevalence Estimates (Prevalence Per 10,000 Live Births): Measures of Central Tendency and Dispersion by Case-Finding Methodology and Maternal Race/ethnicity, 2008–2012.
|
Total also includes Asian and Pacific Islander, American Indian/Alaska Native and other/unknown race/ethnicity.
NH=Non-Hispanic; n=number of state programs; Chebyshev interval=Mean ± 2 Standard Deviations (SD); P10=10th percentile; P25=25th percentile; P75=75th percentile; P90=90th percentile
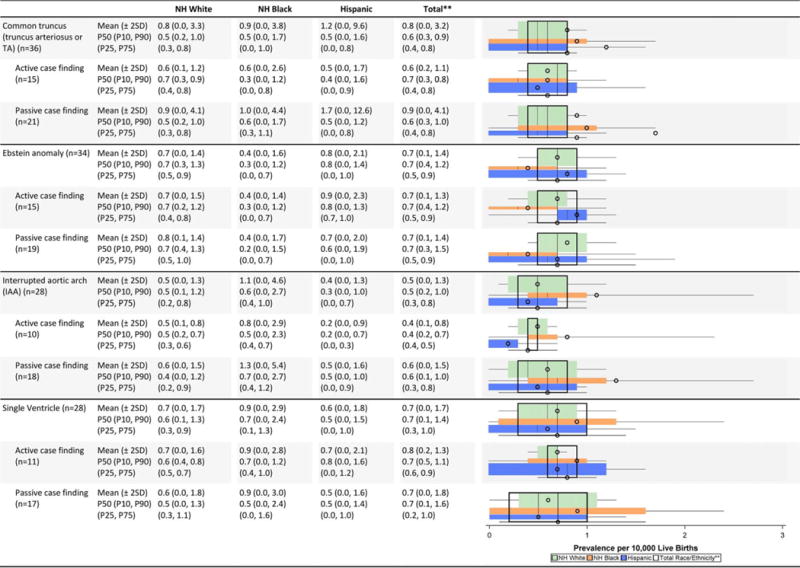
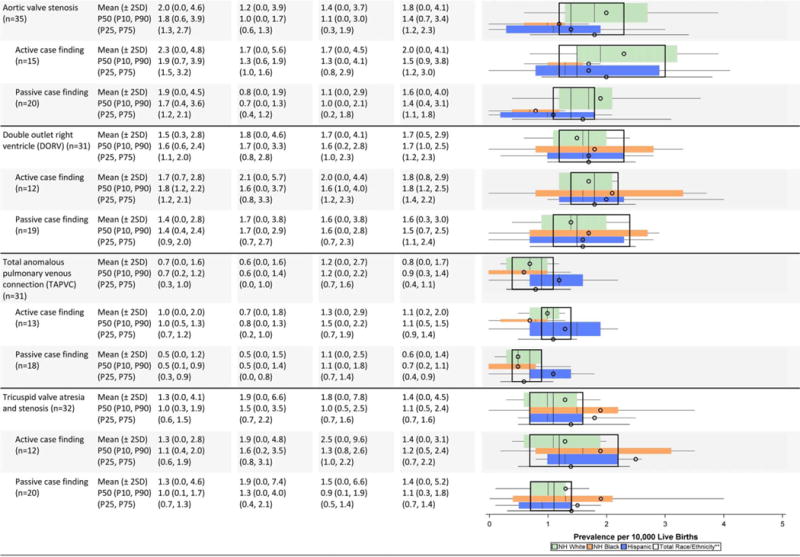
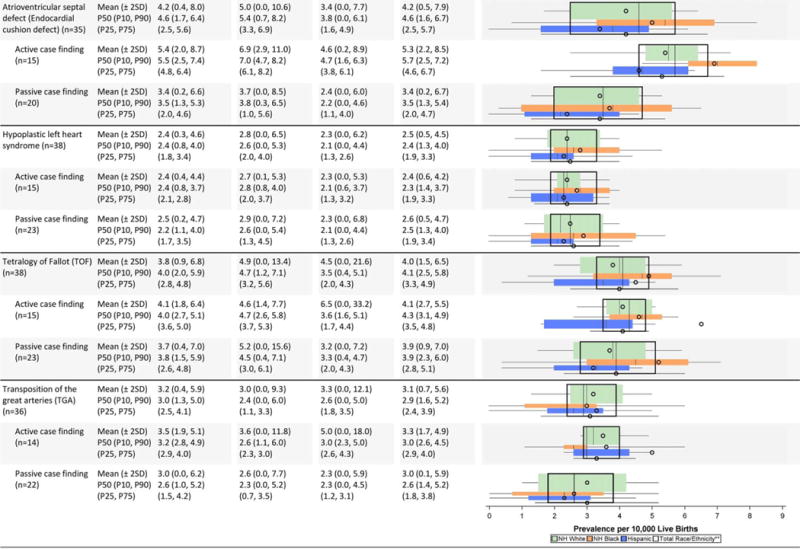
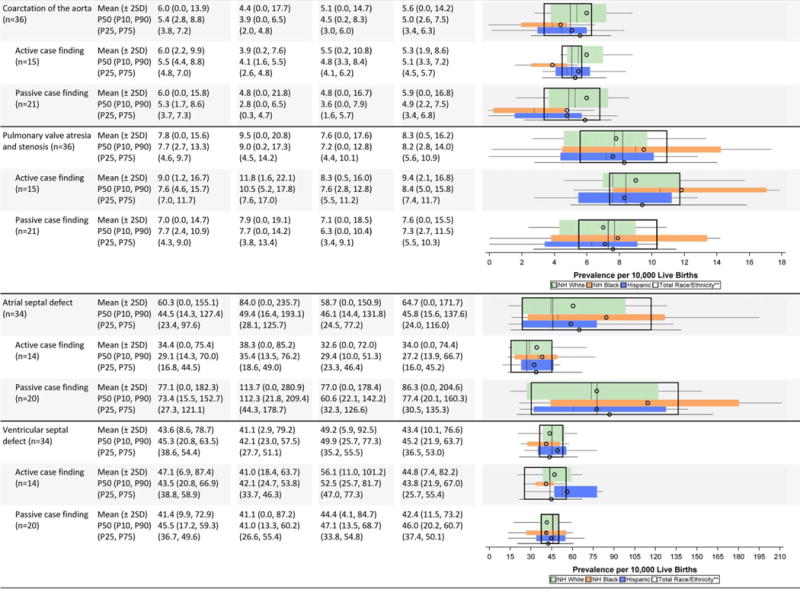
TABLE 2C.
Cardiovascular Defects Prevalence Estimates (Prevalence Per 10,000 Live Births): Measures of Central Tendency and Dispersion by Case-Finding Methodology and Maternal Race/ethnicity, 2008–2012.
|
|
|
|
Total also includes Asian and Pacific Islander, American Indian/Alaska Native and other/unknown race/ethnicity.
NH=Non-Hispanic; n=number of state programs; Chebyshev interval=Mean ± 2 Standard Deviations (SD); P10=10th percentile; P25=25th percentile; P7S=75th percentile; P90=90th percentile
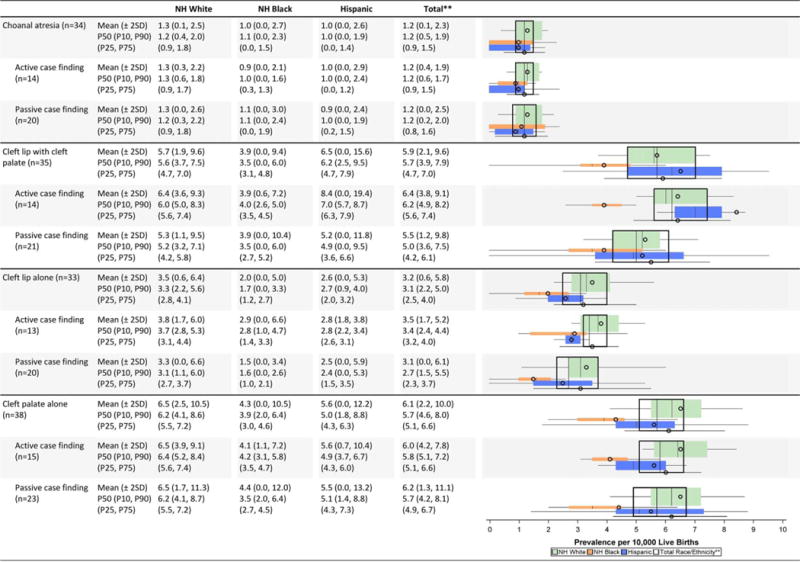
TABLE 2D.
Orofacial Defects Prevalence Estimates (Prevalence per 10,000 Live Births): Measures of Central Tendency and Dispersion by Case-finding Methodology and Maternal Race/Ethnicity, 2008–2012.
|
Total also includes Asian and Pacific Islander, American Indian/Alaska Native and other/unknown race/ethnicity.
NH=Non-Hispanic; n=number of state programs; Chebyshev interval=Mean ± 2 Standard Deviations (SD); P10=10th percentile; P25=25th percentile; P75=75th percentile; P90=90th percentile
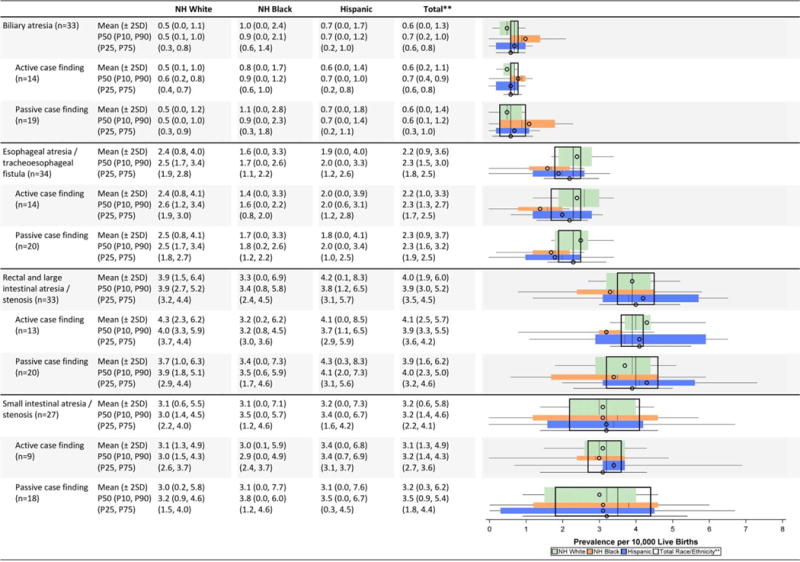
TABLE 2E.
Gastrointestinal Defects Prevalence Estimates (Prevalence per 10,000 Live Births): Measures of Central Tendency and Dispersion by Case-finding Methodology & Maternal Race/Ethnicity 2008–2012.
|
Total also includes Asian and Pacific Islander, American Indian/Alaska Native and other/unknown race/ethnicity.
NH=Non-Hispanic; n=number of state programs; Chebyshev interval=Mean ± 2 Standard Deviations (SD); P10=10th percentile; P25=25th percentiEe; P75=75th percentile; P90=90th percentile
TABLE 2F.
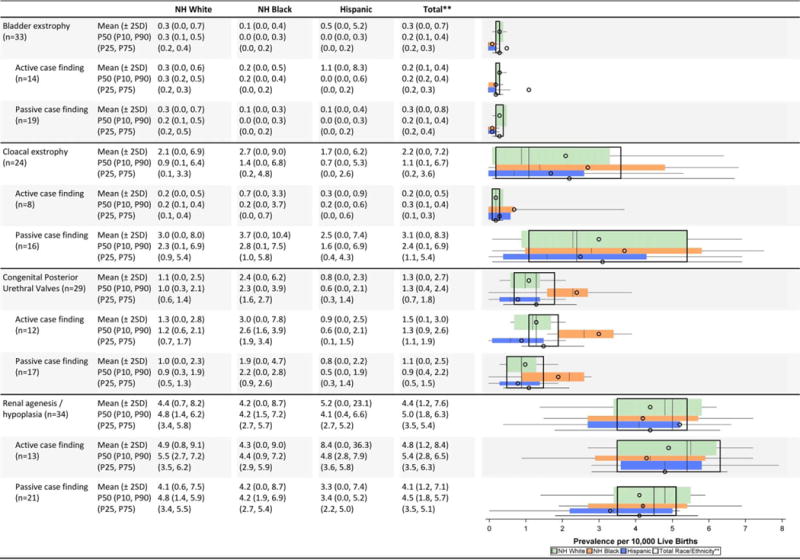
Genitourinary Defects Prevalence Estimates (Prevalence per 10,000 Live Births): Measures of Central Tendency and Dispersion by Case-finding Methodology and Maternal Race/Ethnicity 2008–2012.
|

|
Hypospadias prevalence per 10,000 male live births.
Total also includes Asian and Pacific Islander, American Indian/Alaska Native and other/unknown race/ethnicity.
NH=Non-Hispanic; n=number of state programs; Chebyshev interval=Mean ± 2 Standard Deviations (SO); P10=10th percentile; P25=25th percentile; P75=75th percentile; P9D=90th percentile
TABLE 2G.
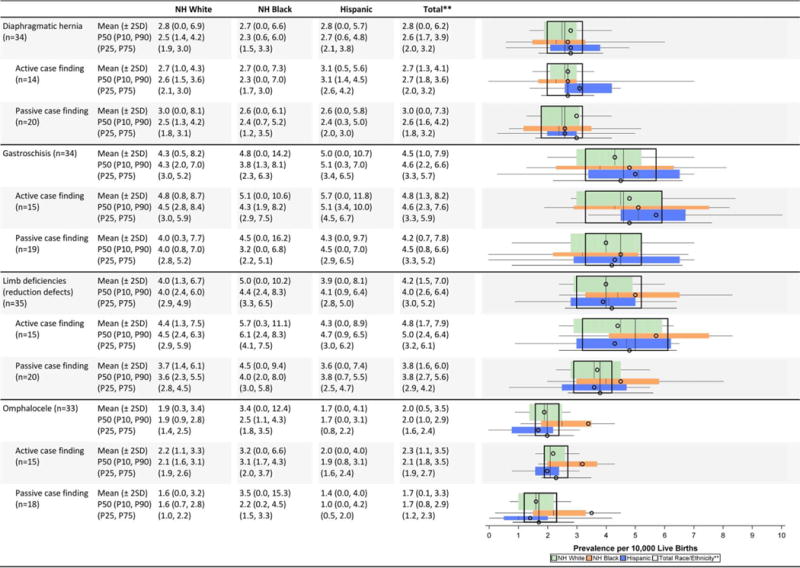
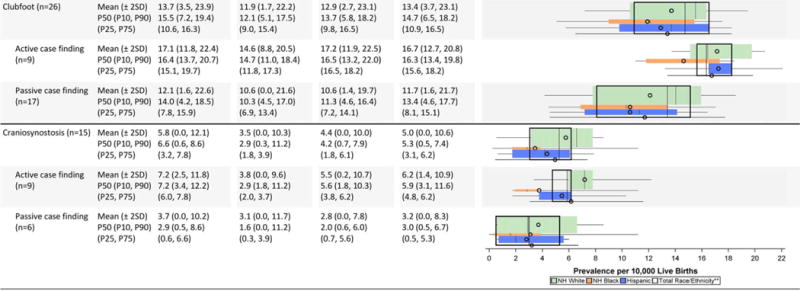
Musculoskeletal Defects Prevalence Estimates (Prevalence per 10,000 Live Births): Measures of Central Tendency and Dispersion by Case-finding Methodology and Maternal Race/Ethnicity, 2008–2012.
|
|
Total also includes Asian and Pacific Islander, American Indian/Alaska Native and other/unknown race/ethnicity.
NH=Non-Hispanic; n=number of state programs; Chebvshev interval=Mean ± 2 Standard Deviations (SD); P10=10th percentile; P25=25th percentile; P75=75th percentile; P90=90th percentile
TABLE 2H.
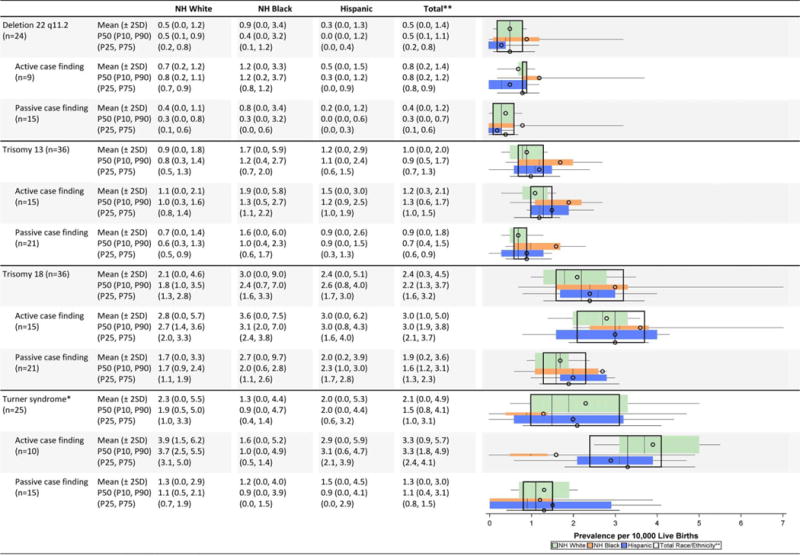
Chromosomal Defects Prevalence Estimates (Prevalence per 10,000 Live Births): Measures of Central Tendency and Dispersion by Case-finding Methodology and Maternal Race/Ethnicity, 2008–2012
|

|
Total also includes Asian and Pacific Islander, American Indian/Alaska Native and other/unknown race/ethnicity.
NH=Non-Hispanic; n=number of state programs; Chebyshev interval=Mean ± 2 Standard Deviations (SD); P10=10th percentile; P25=25th percentile; P75=75th percentile; P90=90th percentile
For each of the 47 defects, we present prevalence-based summary statistics by case-finding approach (total, active, passive) and by maternal race/ethnicity groups (white non-Hispanic, black non-Hispanic, Hispanic, and all race/ethnicity combined). Of note, for these analyses the state-specific data are not pooled across state programs. The mean prevalence is calculated as the mean of the individual state prevalences, with each state weighted equally, regardless of population size. We describe the range of state-specific prevalence estimates by presenting the mean, Chebyshev interval (mean ± two standard deviations) (Berenson et al., 2012), median (P50), inter-decile interval [10th percentile (P10), 90th percentile (P90)], and inter-quartile interval [25th percentile (P25), 75th percentile (P75)]. The mean and median describe the central tendency of the set of state-specific prevalence estimates, and the intervals describe the variation of the set of state-specific prevalence estimates. Specifically, the Chebyshev interval, a useful metric for non-normal distributions, captures at least 75% of its state-specific prevalence estimates. Each inter-quartile interval captures approximately 50% of the state-specific prevalence estimates, and the inter-decile interval captures approximately 80% of the state-specific prevalence estimates. While the inter-quartile interval is more familiar, the inter-decile interval is a better companion to the Chebyshev interval because they capture similar proportions of the state-specific prevalence estimates; thus both interval measures were included in the data tables. For example, 38 state programs contributed data for anencephaly with a mean prevalence estimate of 1.7 cases/10,000 live births (LB), with at least 75% of these 38 program prevalence estimates between 0.0 and 3.8 cases/10,000 LB (Chebyshev interval). The overall median is 1.5 cases/10,000 LB, and approximately 80% of these 38 estimates are between 0.3 and 3.0 cases/10,000 LB (inter-decile percentile interval). With respect to the inter-quartile percentile interval, approximately 50% of the 38 estimates are between 0.9 and 2.5 cases/10,000 LB.
The data tables include corresponding boxplots whose vertical widths are weighted to correspond to the race/ethnicity distribution of birth defects cases for non-Hispanic white, non-Hispanic black, and Hispanic (displayed from top to bottom, respectively). Figure 1 details the components of the boxplots.
FIGURE 1.
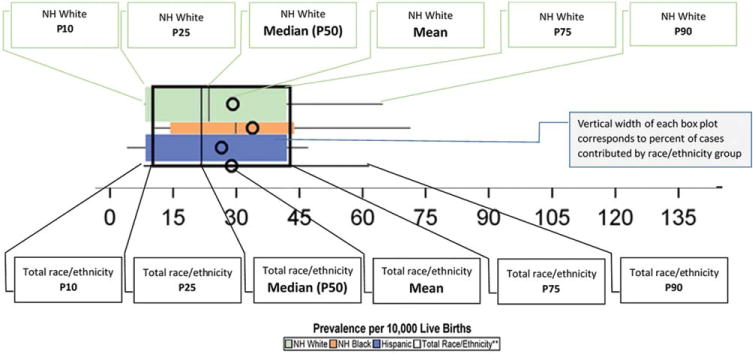
Legend for the graphs in the data tables.
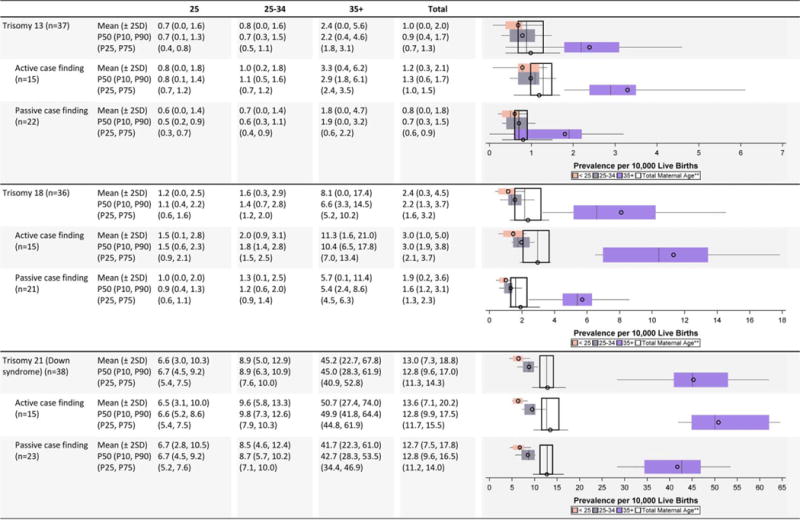
Additional data presentations are included for trisomies and gastroschisis by three maternal age categories (<25 years, 25–34 years, and 35 ± years) in Tables 3A and 3B, respectively. These tables use the same descriptive measures for central tendency and dispersion as the maternal race/ethnicity tables (i.e., mean, Chebyshev interval, median, inter-decile interval, and inter-quartile interval).
TABLE 3A.
Trisomy Prevalence Estimates (Prevalence Per 10,000 Live Births): Measures of Central Tendency and Dispersion by Case-Finding Methodology and Maternal Age, 2008–2012.
|
Total also includes unknown maternal age.
n=number of state programs; Chebyshev interval=Mean ± 2 Standard Deviations (SD); P10=10th percentile; P25=25th percentile; P75=75th percentile; P90=90th percentile
TABLE 3B.
Gastrochisis Prevalence Estimates (Prevalence Per 10,000 Live Births): Measures of Central Tendency and Dispersion by Case-Finding Methodology and Maternal Age, 2008–2012.

|
Total also includes unknown maternal age.
n=number of state programs; Chebyshev interval=Mean ± 2 Standard Deviations (SD); P10=10th percentile; P25=25th percentile; P75=75th percentile; P90=90th percentile
SELECTED HIGHLIGHTS OF BIRTH DEFECTS-SPECIFIC VARIABILITY
Central nervous system defects (Table 2A)
While the average (mean or median) prevalence estimates of anencephaly and spina bifida were highest among Hispanics across all programs, more variability was observed for this group compared with non-Hispanic whites and non-Hispanic blacks. For anencephaly, the Chebyshev interval for His-panics was 0.0 to 7.9 cases/10,000 LB while the interval was 0.0 to 3.5 cases/10,000 LB for non-Hispanic whites and 0.0 to 4.1 cases/10,000 for non-Hispanic blacks. Anencephaly also exhibited higher overall prevalence and greater variability among programs with active case-finding compared with passive case-finding. In contrast, the case-finding approach appeared to have little impact on both average prevalence and variability of spina bifida.
Passive case-finding programs generally had higher prevalence estimates than active case-finding programs for holoprosencephaly, but the dispersion in these estimates was much wider (Chebyshev interval 0.0–6.6 cases/10,000 LB) for the passive compared with active case-finding programs (0.3–2.5 cases/10,000 LB).
Eye and ear defects (Table 2B)
The average prevalence and dispersion for the eye defects, anophthalmia/microphthalmia and congenital cataract, were relatively similar across the racial/ethnic groups (non-Hispanic whites, Hispanics, and non-Hispanic blacks). However, the active-case finding programs reported somewhat higher average prevalence estimates. Less dispersion in the prevalence estimates was observed for anophthalmia/microphthalmia than for congenital cataract.
The state prevalence estimates for anotia/microtia among Hispanics showed much more variability than other race/ethnicity groups (Chebyshev interval 0.0–8.4 cases/10,000 LB for Hispanics compared with 0.0–3.0 and 0.0–3.6 cases/10,000 LB for non-Hispanic whites and non-Hispanic blacks, respectively). While active case-finding programs reported approximately 50% higher prevalence estimates, this was accompanied by a wider dispersion around the mean and median values.
Cardiovascular defects (Table 2C)
The mean prevalence estimates reported were highest among non-Hispanic blacks for several cardiac conditions (interrupted aortic arch, atrioventricular septal defect [AVSD], tetralogy of Fallot); however, some of the higher observed differences were attenuated when examining the median values. For example, the prevalence estimate for interrupted aortic arch among non-Hispanic blacks shifted from a mean of 0.8 cases/10,000 LB to a median of 0.5 cases/10,000 LB, which was closer to the estimates for the other groups. Other birth defects (e.g., single ventricle, tricuspid valve atresia and stenosis, pulmonary valve atresia and stenosis) also seemed to have higher mean prevalence estimates among non-Hispanic blacks, but had wide overlapping inter-quartile ranges. Higher average prevalence among non-Hispanic whites was observed for aortic valve stenosis and coarctation of the aorta, and higher average prevalence among Hispanics for total anomalous pulmonary venous return.
Active case-finding programs reported relatively similar or higher average prevalence estimates for most cardiac conditions on the NBDPN birth defects list except for atrial septal defect. The average prevalence estimates for this condition were higher for passive case-finding programs, and this was accompanied by wide dispersion. For example, the Chebyshev interval for atrial septal defect was 0.0 to 204.6 cases/10,000 LB for passive case-finding programs compared with 0.0 to 74.4 cases/10,000 LB. A similar pattern did not emerge for ventricular septal defect. For AVSD, active case-finding programs had substantially higher average prevalence across all three racial/ethnic groups than passive case-finding programs, with barely any overlap in the inter-quartile ranges. However, the dispersion was similar between active and passive programs.
Orofacial defects (Table 2D)
Little variation was observed in the average prevalence for choanal atresia across case-finding programs or racial/ethnic groups. Among clefts, non-Hispanic blacks consistently showed the lowest average prevalence for all types of orofacial clefts (cleft lip alone, cleft lip with cleft palate, and cleft palate alone). The case-finding approach did not appear to impact the average prevalence of orofacial conditions or the spread of state prevalence values.
Gastrointestinal defects (Table 2E)
Even with relatively wide dispersions, the average prevalence estimates were similar among racial/ethnic groups except among non-Hispanic blacks. Among this group, slightly higher average prevalence for biliary atresia and lower average prevalence for rectal and large intestinal atresia/stenosis, were noted.
While the prevalence estimates observed for the four gastrointestinal defects on the NBDPN list were similar across case-finding programs, the inter-quartile intervals from active case-finding programs were narrower than those of passive case-finding programs.
Genitourinary defects (Table 2F)
Compared with non-Hispanic whites and blacks, Hispanics had a higher prevalence of bladder exstrophy and renal agenesis/hypoplasia (in the active case-finding programs). However, the dispersion in the prevalence estimates was relatively wide. In fact, for the estimates for renal agenesis/hypoplasia among Hispanics, the Chebyshev interval was five times higher for active case-finding programs (0–36.3 cases/10,000 LB) compared with passive case-finding programs (0–7.4 cases/10,000 LB). The average prevalence of congenital posterior urethral valves was higher among non-Hispanic blacks. Hispanics appeared to have a consistently lower prevalence of hypospadias.
The reported average prevalence for hypospadias and cloacal exstrophy were higher among states with passive case-finding ascertainment, but much of this was driven by a large dispersion. For example, the Chebyshev interval for cloacal exstrophy was 16 times wider for passive case-finding programs (0.0–8.3 cases/10,000 LB) compared with active case-finding programs (0.0–0.5 cases/10,000 LB).
Musculoskeletal defects (Table 2G)
In general, average prevalence was similar across race/ethnic groups with the exception of omphalocele, which appeared to be higher among non-Hispanic blacks. Active case-finding programs reported higher average prevalence for clubfoot and omphalocele. For clubfoot, active case-finding programs not only reported higher prevalence estimates, but also less variability (mean of 16.7 cases/10,000 LB and Chebyshev interval of 12.7–20.8 cases/10,000 LB) compared with passive case-finding programs (mean of 11.7 cases/10,000LB and Chebyshev interval of 1.6–21.7 cases/10,000 LB).
As one of the new conditions added to the NBDPN list, craniosynostosis was reported by only 15 programs for this data brief. Active case-finding programs had much higher prevalence estimates across all three racial/ethnic groups, especially for non-Hispanic whites, with only a slight overlap in the inter-quartile ranges. The variations observed in the prevalence estimates appeared to be sensitive to extreme values (wide dispersion observed using the Chebyshev intervals but with tighter inter-quartile ranges).
Chromosomal conditions (Table 2H)
Hispanics seemed to have slightly higher average prevalence of trisomy 21; non-Hispanic blacks seemed to have slightly higher average prevalence of trisomies 13 and 18. The variability in the race-ethnicity specific estimates, however, is substantial, especially for trisomy 18, both between active and passive case-finding programs and within the group of states conducting active ascertainment. Active case-finding programs generally reported higher average prevalence for chromosomal conditions, but showed a wider inter-quartile dispersion except for deletion 22 q11.2, where the range was extremely narrow (0.8–0.9 cases/10,000 LB).
Maternal age (Tables 3A and 3B)
The prevalence estimates for all three trisomy conditions were slightly higher among active case-finding programs, with a pronounced jump in prevalence estimates for older mothers (≥35 years), especially for Down syndrome. The variability in the prevalence estimates for trisomies 13 and 18 was markedly larger among the programs with active case-finding than programs with passive case-finding.
For gastroschisis, the average prevalence estimates were highest among young mothers (<25 years), with the overall magnitude of and variability in prevalence estimates relatively consistent across surveillance case-finding approaches.
Discussion
Population-based birth defects surveillance systems in the United States are generally established at the state level. The NBDPN has published state-specific birth defects counts and prevalence estimates for a range of major birth defects for almost two decades, but has increasingly focused its efforts on multi-state collaborative projects using pooled data to characterize the prevalence and public health burden, survival, and health outcomes of affected populations. The expanded utility of state-based birth defects data warrants a closer examination of the variability behind prevalence estimates for specific birth defects across programs. This report attempts to broadly describe variations observed in birth defects data across 38 population-based surveillance systems by examining two measures of central tendency (mean and median) and the accompanying dispersion measures (standard deviations around the mean values and inter-quartile and inter-decile intervals around median values). Much of the variability observed can likely be explained by (1) clinical practice and coding and (2) surveillance ascertainment methodology.
CLINICAL PRACTICE AND CODING
Population-based birth defects surveillance data are largely removed from direct medical care. Clinical practice and patient access to health care can affect how information is recorded in medical records. Prenatal care may be immediate, delayed, or absent which impacts the health of the pregnancy and whether (and when) a birth defect is identified and recorded. After delivery, differences in the level of hospital care, screening practices, and diagnostic capabilities among birthing facilities could affect which birth defects are detected and documented in medical records.
The quantity and quality of information ascertained from medical records and how diagnostic case information is coded can greatly affect the variations in prevalence estimates observed for several birth defects. For example, the wide dispersion observed in the average prevalence estimates for atrial septal defects among passive case-finding programs is likely driven by those programs’ reliance on administrative datasets to ascertain cases using an imprecise ICD-9-CM code that often times include other conditions, such as patent foramen ovale.
Other issues such as diagnostic certainty of conditions, and whether a program can definitively confirm cases, can affect observed variations. Salemi et al. (2012) compared the passive case ascertainment methodology used by the Florida Birth Defects Registry with an enhanced system that used hospital medical record review, and concluded that for epidemiologic or clinical studies, the program should implement a more comprehensive case ascertainment strategy that includes case confirmation.
SURVEILLANCE ASCERTAINMENT METHODOLOGY
Surveillance ascertainment methodology, specifically how programs find cases, which pregnancy outcomes are included, and the type of data sources accessed, are critical drivers of variability of prevalence estimates. Hobbs et al. (2001) noted several potential sources of variability in case ascertainment methods, data sources, case inclusion criteria, inclusion of elective terminations and stillbirths, age limit, and diagnostic confirmation and precision.
The ability of birth defects surveillance programs to capture cases from all pregnancy outcomes is important, but capturing this data can be challenging. Whereas most systems capture both live births and fetal deaths, only approximately 40% are able to capture terminations of pregnancy (Mai et al., 2015). For some conditions, the lack of other pregnancy outcomes can greatly affect data completeness. Cragan and Gilboa (2009) found that adding prenatal sources from perinatologists’ offices to their data sources increased the total defect prevalence by approximately 7% (28 per 1000 to 30 per 1000). The increase was most pronounced for lethal conditions, such as anencephaly. In general, active case-finding programs report higher average prevalence estimates, but this is most likely driven by inclusion of all pregnancy outcomes.
Wide variations can be observed for rare events within a small population size. The occurrence of some individual types of birth defects can be considered rare, and when the counts are stratified further into subgroups, such as maternal race/ethnicity, some extreme variations are observed. For example, among active case-finding programs, the mean prevalence estimate for tetralogy of Fallot among Hispanics is almost twice the median prevalence estimate, due to extreme right skewness (Chebyshev interval 0.0–33.2 cases/10,000 LB). This result is driven by one program that ascertained a few cases from a small Hispanic LB population (less than 1000 LB over a 5-year period).
Pooling data from multiple state programs for epidemiologic and etiologic studies assists in reducing certain extreme-values challenges. Examples of studies using pooled data include the NBDPN national estimates project and the National Birth Defects Prevention Study. The NBDPN developed national estimates using pooled data from programs that could confirm 100% of the cases (Canfield et al., 2006; Parker et al., 2010). Likewise, the National Birth Defects Prevention Study, one of the largest case-control studies to examine risk factors for birth defects, used pooled birth defects data from 10 population-based birth defects surveillance programs that all followed a rigid study protocol for case inclusion (Reefhuis et al., 2015; Dolk, 2015).
CONCLUSIONS
Given a lack of a national system for population-based birth defects surveillance, multi-state data collaborations are important to address the public health impact of birth defects in the United States. As the utility of population-based birth defects surveillance data increases with applications for policy decisions, prevention efforts and the development of a research agenda, understanding the variability behind prevalence estimates for specific birth defects across states is key. True variation in occurrence is expected because populations have different underlying risks; however our organizational experience has shown that some sources of variation are controllable. The NBDPN released national standards for data quality in 2014 that included performance measures around completeness, timeliness and accuracy of birth defects data (Anderka et al., in press). Implementation of those standards across surveillance systems will be an important step forward in controlling variability. Concerted efforts are needed to continue to improve birth defects surveillance across population-based programs.
Supplementary Material
Acknowledgments
We thank Sara Khan for her assistance with reviewing the data tables. We acknowledge the state birth defects surveillance programs that submitted data for this report: Arizona Birth Defects Monitoring Program; Arkansas Reproductive Health Monitoring System; Colorado Responds To Children With Special Needs; Delaware Birth Defects Registry; Florida Birth Defects Registry; Metropolitan Atlanta Congenital Defects Program; Illinois Adverse Pregnancy Outcomes Reporting System; Indiana Birth Defects and Problems Registry; Iowa Registry for Congenital and Inherited Disorders; Kansas Birth Defects Information System; Kentucky Birth Surveillance Registry; Louisiana Birth Defects Monitoring Network; Maine CDC Birth Defects Program; Maryland Birth Defects Reporting and Information System; Massachusetts Birth Defects Monitoring Program; Michigan Birth Defects Registry; Minnesota Birth Defects Information System; Mississippi Birth Defects Surveillance Registry; Missouri Birth Defects Surveillance System; Nebraska Birth Defect Registry; Nevada Birth Outcomes Monitoring System; New Hampshire Birth Conditions Program; New Jersey Special Child Health Services Registry; New Mexico Birth Defects Prevention and Surveillance System; New York State Congenital Malformations Registry; North Carolina Birth Defects Monitoring Program; Oklahoma Birth Defects Registry; Oregon Birth Anomalies Registry; Puerto Rico Birth Defects Surveillance and Prevention System; Rhode Island Birth Defects Surveillance Program; South Carolina Birth Defects Program; Tennessee Birth Defects Registry; Texas Birth Defects Epidemiology and Surveillance Branch; Utah Birth Defect Network; Vermont Birth Information Network; Virginia Congenital Anomalies and Reporting Education System; West Virginia Birth Defects Surveillance System; and Wisconsin Birth Defect Prevention and Surveillance System.
Footnotes
Additional Supporting Information may be found in the online version of this article.
The findings and conclusions in this report are those of the authors and do not necessarily represent the official position of the Centers for Disease Control and Prevention.
References
- Berenson M, Levine D, Krehbiel TC. Basic business statistics: concepts and Applications. 12th. New Jersey: Prentice Hall; 2012. [Google Scholar]
- Canfield MA, Honein MA, Yuskiv N, et al. National estimates and race/ethnic-specific variation of selected birth defects in the United States, 1999–2001. Birth Defects Res A Clin Mol Teratol. 2006;76:747–756. doi: 10.1002/bdra.20294. [DOI] [PubMed] [Google Scholar]
- Centers for Disease Control and Prevention (CDC) Update on overall prevalence of major birth defects — Atlanta, Georgia, 1978–2005. MMWR Morb Mortal Wkly Rep. 2008;57:1–5. [PubMed] [Google Scholar]
- Cragan JD, Gilboa SM. Including prenatal diagnoses in birth defects monitoring: experience of the Metropolitan Atlanta Congenital Defects Program. Birth Defects Res A Clin Mol Teratol. 2009;85:20–29. doi: 10.1002/bdra.20508. [DOI] [PubMed] [Google Scholar]
- Dolk H. Preventing birth defects: the value of the NBDPS case-control approach. Birth Defects Res A Clin Mol Teratol. 2015;103:670–679. doi: 10.1002/bdra.23404. [DOI] [PubMed] [Google Scholar]
- Hobbs CA, Hopkins SE, Simmons CJ. Sources of variability in birth defects prevalence rates. Teratology. 2001;64:S8–S13. doi: 10.1002/tera.1078. [DOI] [PubMed] [Google Scholar]
- Mai CT, Cassell CH, Meyer RE, et al. Birth defects data from population-based birth defects surveillance programs in the United States, 2007 to 2011: highlighting orofacial clefts. Birth Defects Res A Clin Mol Teratol. 2014;100:895–904. doi: 10.1002/bdra.23329. [DOI] [PMC free article] [PubMed] [Google Scholar]
- Mai CT, Kirby RS, Correa A, et al. Public health practice of population-based birth defects surveillance programs in the United States. J Public Health Manag Pract. 2015 doi: 10.1097/PHH.0000000000000221. [Epub ahead of print.] [DOI] [PubMed] [Google Scholar]
- Mason CA, Kirby RS, Sever LE, Langlois PH. Prevalence is the preferred measure of frequency of birth defects. Birth Defects Res A Clin Mol Teratol. 2005;73:690–692. doi: 10.1002/bdra.20211. [DOI] [PubMed] [Google Scholar]
- Parker SE, Mai CT, Canfield MA, et al. Updated National Birth Prevalence Estimates for Selected Birth Defects in the United States, 2004–2006. Birth Defects Res A Clin Mol Teratol. 2010;88:1008–1016. doi: 10.1002/bdra.20735. [DOI] [PubMed] [Google Scholar]
- Reefhuis J, Gilboa SM, Anderka M, et al. The National Birth Defects Prevention Study: a review of the methods. Birth Defects Res A Clin Mol Teratol. 2015;103:656–669. doi: 10.1002/bdra.23384. [DOI] [PMC free article] [PubMed] [Google Scholar]
- Salemi JL, Tanner JP, Kennedy S, et al. A comparison of two surveillance strategies for selected birth defects in Florida. Public Health Rep. 2012;127:391–400. doi: 10.1177/003335491212700407. [DOI] [PMC free article] [PubMed] [Google Scholar]
- Texas Department of State Health Services (TDSHS) Texas Birth Defects Registry’s Report of birth defects among 1999–2011 deliveries: summary and key findings. 2015 Available at: http://www.dshs.state.tx.us/birthdefects/data/BD_Data_99-11/Report-of-Birth-Defects-Among-1999–2011-Deliveries.aspx.
Associated Data
This section collects any data citations, data availability statements, or supplementary materials included in this article.


