Abstract
PURPOSE
This study investigated the effect of amount of thickness reduction on color and translucency of dental monolithic zirconia ceramics.
MATERIALS AND METHODS
One-hundred sixty-five monolithic zirconia specimens (16.3 mm × 16.3 mm × 2.0 mm) were divided into 5 groups (Group I to V) according to the number of A2-coloring liquid applications. Each group was then divided into 11 subgroups by reducing the thickness up to 1.0 mm in 0.1-mm increments (Subgroup 0 to 10, n=3). Colors and spectral distributions were measured according to CIELAB on a reflection spectrophotometer. All measurements were performed on five different areas of each specimen. Color difference (ΔE*ab) and translucency parameter (TP) were calculated. Data were analyzed using one-way ANOVA and multiple comparison Scheffé test (α=.05).
RESULTS
There were significant differences in CIE L* between Subgroup 0 and other subgroups in all groups. CIE a* increased (0.52<R2<0.73), while CIE b* decreased (0.00<R2<0.74) in all groups with increasing thickness reduction. Perceptible color differences (ΔE* ab>3.7) were obtained between Subgroup 0 and other subgroups. TP values generally increased as the thickness reduction increased in all groups (R2>0.89, P<.001).
CONCLUSION
Increasing thickness reduction reduces lightness and increases a reddish, bluish appearance, and translucency of monolithic zirconia ceramics.
Keywords: Y-TZP ceramic, Color, Dental Prosthesis Coloring
INTRODUCTION
Since dental ceramic restorations have been introduced in 20th century,1 reproduction of natural appearance of teeth has been a major concern in dentistry. For metal-ceramic restorations, light reflection from an opaque porcelain layer to mask the metal substrate resulted in opaque appearance and therefore, their use in high esthetic area was limited.2 Glass ceramic restorations without metal substrate induced more light transmission and accordingly, they improved the ability to reproduce the appearance of tooth structure.3 Despite the esthetic advantage of glass ceramics, the demands for stronger ceramic restorations have increased. As a result, high strength zirconia-based ceramics combined with CAD/CAM technology have broadened the range of their applications in dentistry.4 However, cohesive failure of the veneering porcelain has been reported as a major drawback5,6 and thereby, fabricating monolithic zirconia restoration which consists of a single zirconia material without any veneering could be an alternative approach to obviate the veneering failure.7
The esthetic value of dental ceramic restorations is influenced by several factors, such as color, translucency, fluorescence, surface texture and shape.8 Furthermore, the overall color of ceramic restorations can be influenced by the thickness of the ceramic, the thickness and the color of luting agent, and the color of the underlying tooth structure. 9
Several studies investigated the effect of the thickness on overall color and translucency of ceramic restorations.2,9,10,11,12,13,14 Changes of color and translucency may be expected when the thickness of porcelain layer changes, although the direction of color change may depend on the specific components of the ceramic systems.15
Due to its inherent white and opaque appearance, monolithic zirconia can be colored in a pre-sintered state to match adjacent teeth. In a clinical situation, there could be a thickness reduction during the process of occlusal adjustment by dentists. However, there have been no reported studies regarding the changes of color and translucency as a function of changes in thickness using monolithic zirconia.
The purpose of this study was to evaluate the effect of the amount of thickness reduction on color and translucency of dental monolithic zirconia ceramics. The null hypothesis to be tested was that there was no significant difference in color and translucency between monolithic zirconia ceramics with different amount of thickness reduction.
MATERIALS AND METHODS
One-hundred sixty-five square-shaped specimens from presintered yttria-stabilized tetragonal zirconia blocks (Lot No.: B 105566, B 105583, B 105565, B 88712; BruxZir, Glidewell Laboratories, Newport Beach, CA, USA) were colored with coloring liquid (Lot No.: 40127, 40129; Tanaka ZirColor, A2, Tanaka Dental, Skokie, IL, USA) and assigned to 5 groups according to the number of coloring liquid application (Group I (one time) to V (five times), n = 33 per each group) following the same protocol used in our previous study.7 The specimens were heated in a furnace (Austromat baSiC®, DEKEMA Dental-Keramiköfen GmbH, Freilassing, Germany) with a step sintering procedure; sintering at 950℃ for 10 minutes and at 1,500℃ for 2 hours. After sintering, the thickness adjustment was performed in the same manner as was used in our previous studies.7,16 Accordingly, the final dimensions of the specimens were 16.3 mm × 16.3 mm × 2.0 mm.
Each group was then divided into eleven subgroups (n = 3 per each subgroup) by reducing the thickness of 0.1 to 1.0 mm in increments of 0.1-mm on the colored surface using a horizontal grinding machine (HRG-150, AM Technology, Asan, Korea); Subgroup 0 (no reduction), Subgroup 1 (0.1 mm reduction) to Subgroup 10 (1.0 mm reduction).
Color parameters were obtained from CIE-Lab (Commission Internationale de l'Eclairage L*, a*, b*) color space relative to D65 on a reflection spectrophotometer (CM-3500d, Konica Minolta, Tokyo, Japan). For the instrument, diffuse illumination was used and the reflected light was measured (CIE diffuse/8-degree) at the center and each quarter of the specimen. A 3-mm diameter aperture for diffuse illumination and 3-mm measurement area were used and CIE 1931 2° standard colorimetric observer was performed.
Each of L*, a* and b* values was measured against a black background (CM-A 101B, Konica Minolta, Tokyo, Japan, L* = 0.1099, a* = 0.2107, and b* = -0.4292) and a white background (CM-A120, Konica Minolta, Tokyo, Japan, L* = 96.6880, a* = -0.1755, and b* = -0.1236) in the reflectance mode with specular component excluded (SCE) at 10 nm intervals in the wavelength range of visible light, 400 - 700 nm. Optical contact was obtained by placing a drop of distilled water (refractive index: 1.33, approximately) between each specimen and a background.11 Spectral reflectance against a white background was recorded at 10 nm intervals in the range of 400 to 700 nm.
Color difference between each subgroup was calculated using CIE Lab color-difference formula17 denoted by ΔE*ab = [(ΔL*)2 + (Δa*)2 + (Δb*)2]1/2. ΔL*, Δa*, and Δb* refer to the difference on lightness, red/green axis, and yellow/blue axis, respectively. To determine the color difference, the average CIE values against a black background were used.
For translucency measurements, translucency parameter (TP) and diffuse transmittance were obtained. TP value was calculated by the color difference between values against a black and a white background18 which is denoted by TP = [(LB* - LW*)2 + (aB* - aW*)2 + (bB* - bW*)2]1/2. Diffuse transmittance measurement was performed using an integrating sphere with the aperture size of 9.5 mm in diameter. Percent transmittance was calculated from the transmittance data.
All measurements, therefore, were made at the center and each quarter of the specimen and values were averaged. Statistical analysis was performed using SPSS software (version 20.0, SPSS Inc., Chicago, IL, USA) and the α level was set at 0.05. Normal distribution of each color value and TP value was verified with Shapiro-Wilk test. To identify if there is any significant difference in color and TP values among subgroups, one-way ANOVA was carried out followed by multiple comparison Scheffé test. Pearson correlation and linear regression was fitted to test for a relationship between the amount of thickness reduction and color and TP values.
RESULTS
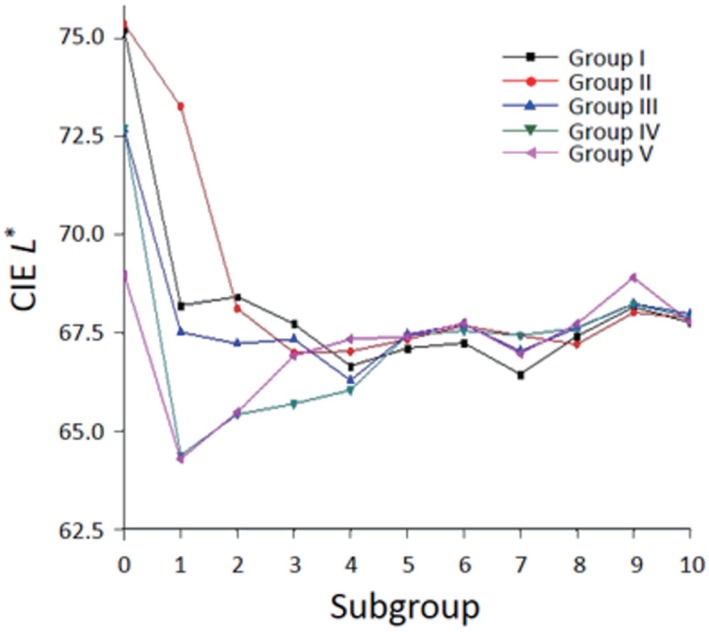
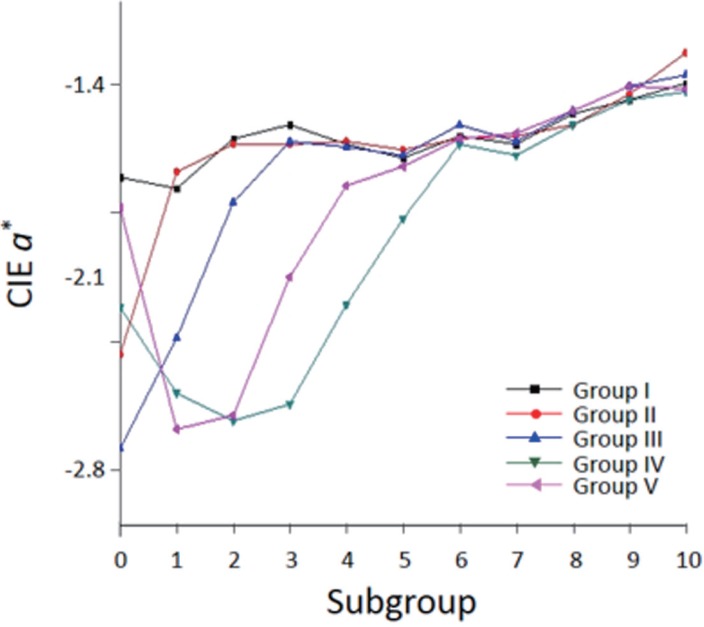
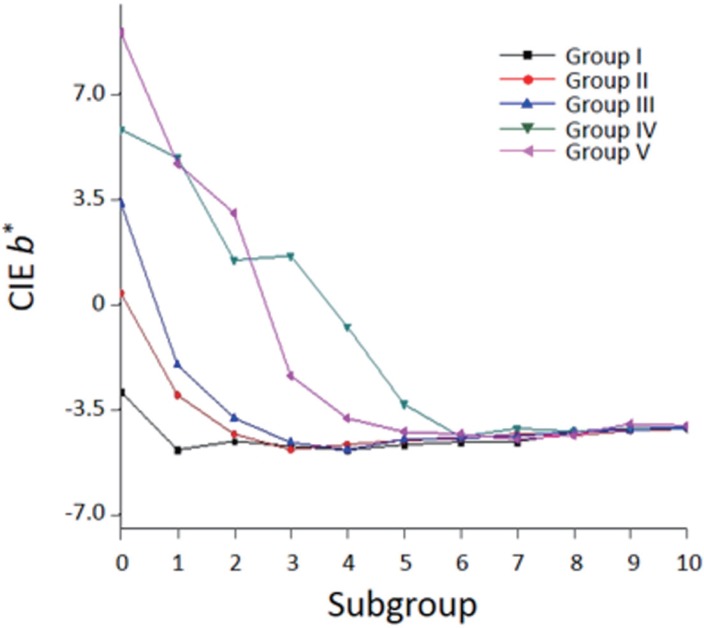
Fig. 1, Fig. 2, and Fig. 3 showed means of CIE L*, a* and b* values of each group against a black background in the reflectance mode as a function of the amount of thickness reduction, respectively. Significant decrease in CIE L* value was noted at initial reduction in all groups. CIE a* value generally increased, while CIE b* value decreased with the increase of thickness reduction in all groups. Correlation analyses between L*, a* or b* values against a black background in the reflectance mode and the amount of thickness reduction were conducted. There were negative, but weak correlations between L* value and the amount of thickness reduction in most groups (-0.58 < r < 0.34, 0.09 < R2 < 0.34). There were positive correlations between a* value and the amount of thickness reduction in all groups (0.72 < r < 0.85, 0.52 < R2 < 0.73). There were negative correlations between b* value and the amount of thickness reduction in all groups (-0.86 < r < -0.07, 0.00 < R2 < 0.74).
Fig. 1. Means of CIE L* values of each group against a black background as a function of the amount of thickness reduction.
Fig. 2. Means of CIE a* values of each group against a black background as a function of the amount of thickness reduction.
Fig. 3. Means of CIE b* values of each group against a black background as a function of the amount of thickness reduction.
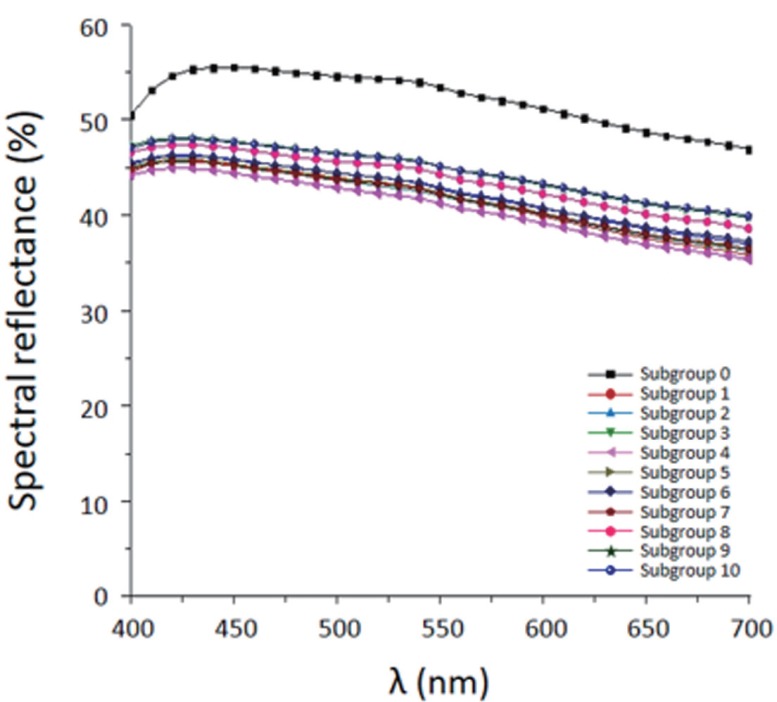
Average spectral reflectance curves against a white background of each subgroup within groups were obtained (Fig. 4). There was a significant difference between Subgroup 0 and other subgroups through the entire spectrum and the values of spectral reflectance in other subgroups were lower than Subgroup 0.
Fig. 4. Average spectral reflectance curve of each subgroup in Group I.
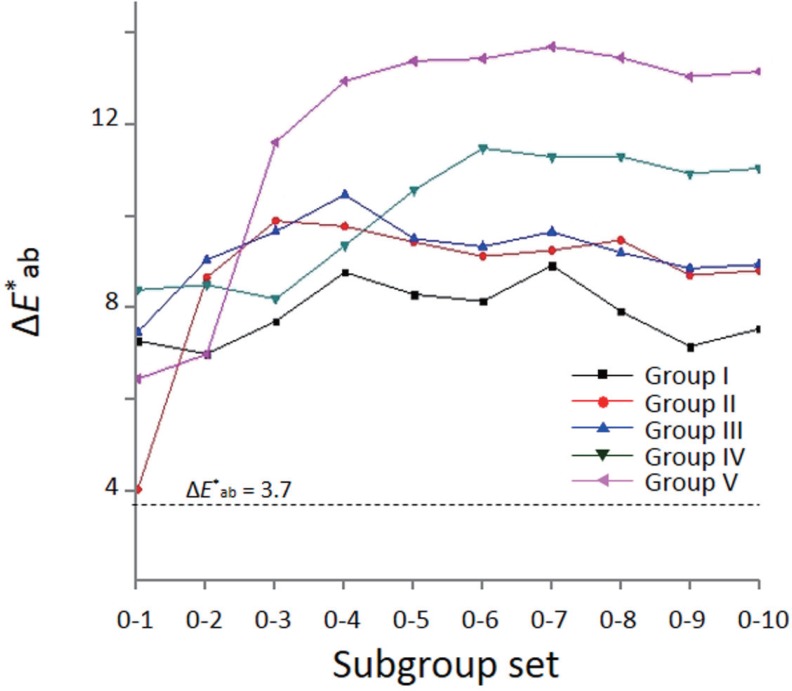
Color differences (ΔE*ab) between each subgroup set were determined. The interpretation of the color difference for this study is based on the visual matching study of Johnston and Kao19 who found that color difference of 3.7 ΔE*ab unit was acceptable for resin composites. Color differences between Subgroup 0 and other subgroups were clinically perceptible (ΔE*ab > 3.7) (Fig. 5). Color differences between Subgroup 1 and 2 were within the range of perceptibility threshold (ΔE*ab < 3.7) except Group II. Color differences between Subgroup 2 and 3 were within the range of perceptibility threshold except Group V. Color differences between Subgroup 3 and 4, 4 and 5, 5 and 6, 6 and 7, 7 and 8, 8 and 9, 9 and 10 were within the range of perceptibility threshold in all groups.
Fig. 5. Means of ΔE*ab units between Subgroup 0 and other subgroups for each group.
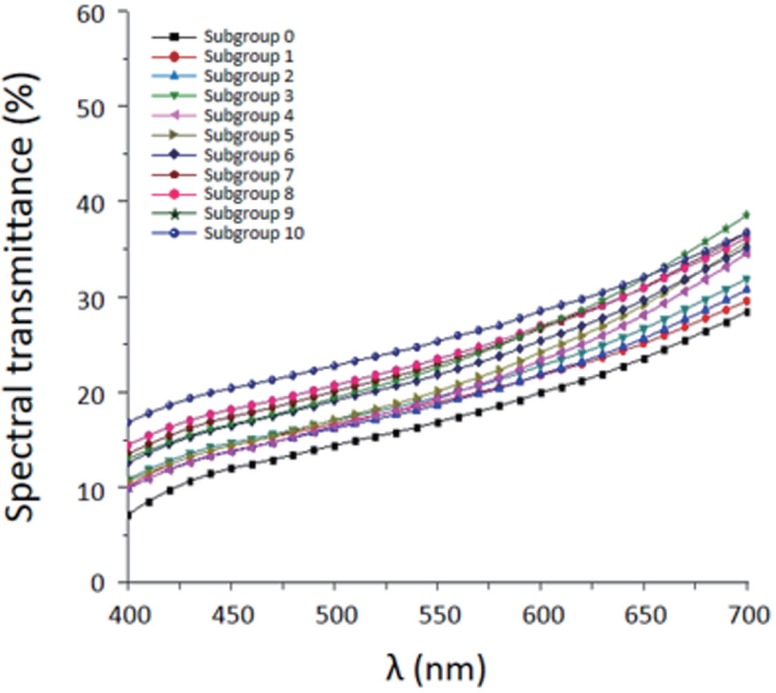
Means of TP for each subgroup within groups are calculated and ranged from 2.27 to 5.34 (Table 1). TP values generally increased as the amount of thickness reduction increased in all groups. Highly significant correlations were found out between TP values and the amount of thickness reduction in all groups (r > 0.94, R2 > 0.89, P < .001). Spectral transmittance of each subgroup exhibited similar spectral behavior through the entire spectrum and transmittance generally increased with increasing the amount of thickness reduction in all groups (Fig. 6).
Table 1. Means and standard deviations in parentheses for translucency parameter of each group as a function of the amount of thickness reduction.
| Subgroup | Group | ||||
|---|---|---|---|---|---|
| I | II | III | IV | V | |
| 0 | 2.76 (0.39)a | 2.72 (0.31)a | 2.43 (0.10) | 2.27 (0.19) | 2.29 (0.13) |
| 1 | 2.84 (0.13)a | 2.48 (0.29)a | 2.93 (0.22)a | 2.93 (0.18)a | 2.90 (0.21)a |
| 2 | 3.12 (0.20)a,b | 3.34 (0.09)b,c | 2.99 (0.13)a | 3.10 (0.14)a,b | 3.07 (0.08)a |
| 3 | 3.24 (0.06)b | 3.27 (0.12)b | 3.31 (0.08)a,b | 3.49 (0.22)b,c | 3.30 (0.24)a,b |
| 4 | 3.71 (0.10)c | 3.65 (0.09)c,d | 3.71 (0.12)b | 3.81 (0.17)c,d | 3.60 (0.12)b,c |
| 5 | 4.01(0.08)c,d | 4.00 (0.13)d,e | 3.44 (0.35)b | 3.48 (0.23)b,c | 3.89 (0.11)c,d |
| 6 | 4.19 (0.09)d,e | 4.18 (0.11)e,f | 4.28 (0.16)c | 4.20 (0.08)d,e | 4.20 (0.09)d |
| 7 | 4.57 (0.18)e,f | 4.44 (0.25)f | 4.48 (0.22)c,d | 4.60 (0.22)e | 4.64 (0.22)e |
| 8 | 4.97 (0.16)g,h | 4.98 (0.18)g | 4.77 (0.27)d,e | 5.02 (0.27)f | 4.77 (0.32)e |
| 9 | 4.82 (0.18)f,g | 5.03 (0.33)g | 5.18 (0.41)e,f | 5.04 (0.35)f | 4.73 (0.50)e |
| 10 | 5.21 (0.58)h | 5.04 (0.41)g | 5.20 (0.48)f | 5.34 (0.52)f | 5.19 (0.51) |
· Means with the same superscript letter in each column are not significantly different from each other based on multiple comparison Scheffé test (P > .05).
Fig. 6. Average spectral transmittance curve of each subgroup in Group I.
DISCUSSION
According to the results of this in vitro study, the null hypothesis could be rejected because there were significant differences in L*, a* or b* values and TP values between monolithic zirconia specimens with different amount of thickness reduction.
The effect of various changes in thickness of each layer on the final appearance of layered metal-ceramic structures has been studied.2,12,15,20,21 L* value substantially increased with the decrease of porcelain thickness2,12 and the direction of color changes were dependent on porcelain shade and the type of metal-ceramic alloy. Increasing the thickness of dentin porcelain produced more scattering and absorption of the incident light and less light reflected back from the opaque layer.
With regard to all-ceramic systems, L* value generally decreased due to increased absorption of incident light with thicker specimens, while a* and b* values increased as the ceramic thickness increased.10,11,13 There might be a difference in the amount of light reflection at the opaque core between all-ceramic systems with different core translucency. Douglas and Przybylska2 demonstrated that the semi-translucent all-ceramic systems were less affected by reduced porcelain thicknesses compared to metal-ceramics.
In this study, the changes in L* value showed a different feature compared to metal-ceramic or all-ceramic systems. There was a significant decrease in L* value at initial reduction, but there were no further significant changes on L* value in most groups (Fig. 1). The different aspect of change might come from different optical and structural properties since monolithic zirconia ceramic is polycrystalline monolayer without any veneering. It can be inferred that there might be reduced scattering due to the reduced thickness which induces lower L* value at first 0.1 mm reduction. However, as the thickness reduction proceeds, monolithic zirconia itself could act as an opaque core and induce internal reflection.22 Thus, reduced reflection might compensate increased internal reflection and L* value could be relatively stable.
Chromatically, a* value increased, while b* value generally decreased with increasing thickness reduction. Regarding the shift in chroma, b* value was more sensitive to the change of thickness than a* value showing minimal shifts in a* value. This result is in accordance with previous studies. 2,11,13 According to the study of Douglas and Brewer,23 dental observers were more sensitive and critical to the color difference in redness than yellowness for metal-ceramic crowns. However, their study was conducted with metalceramic crowns and therefore, further study should be performed to determine whether there is any difference in subjective color assessment between a* and b* value for monolithic zirconia restorations.
Based on the results of this study (Fig. 2, Fig. 3), Group II exhibited noticeable changes in a* and b* values down to 0.2 mm reduction and Group III; to 0.3 mm reduction, Group IV; to 0.6 mm reduction, and Group V; to 0.5 mm reduction. There was no distinct difference in a* and b* values between groups after around 0.6 mm reduction. It can be inferred that the more coloring liquid is applied, the deeper the coloring liquid infiltrates. In addition, one time of coloring liquid application might infiltrate 0.1 mm deep through monolithic zirconia specimen, two times of application; 0.2 mm deep, three times of application; 0.3 mm deep, and four or five times of application; around 0.6 mm deep through monolithic zirconia specimen. This study exhibited a perceptible color difference from no reduction (ΔE*ab > 3.7) even after first 0.1 mm reduction regardless of the number of coloring liquid applications.
The effect of the thickness on the translucency of allceramic systems has been evaluated. Antonson and Anusavice14 investigated the translucency of dental core and veneering ceramics as a function of ceramic thickness. There was a positive linear correlation between contrast ratio and thickness (R2 > 0.81). Hefffernan et al. investigated the effect of the thickness of core materials,24 and the thickness of veneered core materials25 on the translucency of the specimens. They demonstrated that increased thickness resulted in greater opacity. O'Keefe et al.26 suggested that the thickness of the porcelain veneer was the primary factor affecting light transmission and not the opacity. The present study demonstrated similar results. TP values generally increased as the amount of thickness reduction increased in all groups (R2 > 0.89, P < .001). Based on Lambert's law,27 decreasing the thickness of material allows greater amount of light transmission due to reduced absorption. The fraction of incident light that is reflected, absorbed, and transmitted depends upon the thickness of the specimen as well as the scattering and absorption characteristics.28
This in vitro study has several potential limitations. The first limitation is that even application of coloring liquid on the specimens and exact amount of the increase of coloring liquid were difficult to control. Secondly, possible pressure fluctuation inside the furnace during the sintering process might have induced uneven color of the specimens. Thirdly, the aperture diameter of spectrophotometer for reflectance measurement was 3 mm and possible edge loss would have affected the color measurement. Finally, this study was conducted with limited color of shade A2 and with a specific kind of monolithic zirconia system and coloring liquid. Therefore, the influence of varied color combinations with different monolithic zirconia systems should be further studied.
CONCLUSION
Within the limitations of this study, the following conclusions can be drawn. Increasing thickness reduction reduces lightness and increases a reddish, bluish appearance, and translucency of monolithic zirconia ceramics.
References
- 1.McLean JW, Odont D. Evolution of dental ceramics in the twentieth century. J Prosthet Dent. 2001;85:61–66. doi: 10.1067/mpr.2001.112545. [DOI] [PubMed] [Google Scholar]
- 2.Douglas RD, Przybylska M. Predicting porcelain thickness required for dental shade matches. J Prosthet Dent. 1999;82:143–149. doi: 10.1016/s0022-3913(99)70147-2. [DOI] [PubMed] [Google Scholar]
- 3.Isgrò G, Pallav P, van der Zel JM, Feilzer AJ. The influence of the veneering porcelain and different surface treatments on the biaxial flexural strength of a heat-pressed ceramic. J Prosthet Dent. 2003;90:465–473. doi: 10.1016/j.prosdent.2003.08.003. [DOI] [PubMed] [Google Scholar]
- 4.Tinschert J, Natt G, Mautsch W, Augthun M, Spiekermann H. Fracture resistance of lithium disilicate-, alumina-, and zirconia-based three-unit fixed partial dentures: A laboratory study. Int J Prosthodont. 2001;14:231–238. [PubMed] [Google Scholar]
- 5.Al-Amleh B, Lyons K, Swain M. Clinical trials in zirconia: a systematic review. J Oral Rehabil. 2010;37:641–652. doi: 10.1111/j.1365-2842.2010.02094.x. [DOI] [PubMed] [Google Scholar]
- 6.Ha SR, Kim SH, Han JS, Yoo SH, Jeong SC, Lee JB, Yeo IS. The influence of various core designs on stress distribution in the veneered zirconia crown: a finite element study. J Adv Prosthodont. 2013;5:187–197. doi: 10.4047/jap.2013.5.2.187. [DOI] [PMC free article] [PubMed] [Google Scholar]
- 7.Kim HK, Kim SH, Lee JB, Han JS, Yeo IS. Effect of polishing and glazing on the color and spectral distribution of monolithic zirconia. J Adv Prosthodont. 2013;5:296–304. doi: 10.4047/jap.2013.5.3.296. [DOI] [PMC free article] [PubMed] [Google Scholar]
- 8.de Azevedo Cubas GB, Camacho GB, Demarco FF, Pereira-Cenci T. The effect of luting agents and ceramic thickness on the color variation of different ceramics against a chromatic background. Eur J Dent. 2011;5:245–252. [PMC free article] [PubMed] [Google Scholar]
- 9.Vichi A, Ferrari M, Davidson CL. Influence of ceramic and cement thickness on the masking of various types of opaque posts. J Prosthet Dent. 2000;83:412–417. doi: 10.1016/s0022-3913(00)70035-7. [DOI] [PubMed] [Google Scholar]
- 10.Shokry TE, Shen CS, Elhosary MM, Elkhodary AM. Effect of core and veneer thicknesses on the color parameters of two all-ceramic systems. J Prosthet Dent. 2006;95:124–129. doi: 10.1016/j.prosdent.2005.12.001. [DOI] [PubMed] [Google Scholar]
- 11.Dozic A, Kleverlaan CJ, Meegdes M, van der Zel J, Feilzer AJ. The influence of porcelain layer thickness on the final shade of ceramic restorations. J Prosthet Dent. 2003;90:563–570. doi: 10.1016/s0022-3913(03)00517-1. [DOI] [PubMed] [Google Scholar]
- 12.Terada Y, Maeyama S, Hirayasu R. The influence of different thicknesses of dentin porcelain on the color reflected from thin opaque porcelain fused to metal. Int J Prosthodont. 1989;2:352–356. [PubMed] [Google Scholar]
- 13.Ozturk O, Uludag B, Usumez A, Sahin V, Celik G. The effect of ceramic thickness and number of firings on the color of two all-ceramic systems. J Prosthet Dent. 2008;100:99–106. doi: 10.1016/S0022-3913(08)60156-0. [DOI] [PubMed] [Google Scholar]
- 14.Antonson SA, Anusavice KJ. Contrast ratio of veneering and core ceramics as a function of thickness. Int J Prosthodont. 2001;14:316–320. [PubMed] [Google Scholar]
- 15.Lund PS, Aquilino SA, Dixon DL. Evaluation of the color and appearance of a new textured opaque porcelain. Int J Prosthodont. 1991;4:548–554. [PubMed] [Google Scholar]
- 16.Kim HK, Kim SH. Effect of the number of coloring liquid applications on the optical properties of monolithic zirconia. Dent Mater. 2014;30:e229–e237. doi: 10.1016/j.dental.2014.04.008. [DOI] [PubMed] [Google Scholar]
- 17.Commission Internationale de l'Eclairage (CIE) Colorimetry, CIE 015. 3rd ed. Vienna: CIE Central Bureau; 2004. [Google Scholar]
- 18.Johnston WM, Ma T, Kienle BH. Translucency parameter of colorants for maxillofacial prostheses. Int J Prosthodont. 1995;8:79–86. [PubMed] [Google Scholar]
- 19.Johnston WM, Kao EC. Assessment of appearance match by visual observation and clinical colorimetry. J Dent Res. 1989;68(5):819–822. doi: 10.1177/00220345890680051301. [DOI] [PubMed] [Google Scholar]
- 20.Jorgenson MW, Goodkind RJ. Spectrophotometric study of five porcelain shades relative to the dimensions of color, porcelain thickness, and repeated firings. J Prosthet Dent. 1979;42:96–105. doi: 10.1016/0022-3913(79)90335-4. [DOI] [PubMed] [Google Scholar]
- 21.Jacobs SH, Goodacre CJ, Moore BK, Dykema RW. Effect of porcelain thickness and type of metal-ceramic alloy on color. J Prosthet Dent. 1987;57:138–145. doi: 10.1016/0022-3913(87)90135-1. [DOI] [PubMed] [Google Scholar]
- 22.Judd DB, Wyszecki G. Color in business, science and industry. 3rd ed. New York: John Wiley & Sons; 1975. pp. 397–417. [Google Scholar]
- 23.Douglas RD, Brewer JD. Acceptability of shade differences in metal ceramic crowns. J Prosthet Dent. 1998;79:254–260. doi: 10.1016/s0022-3913(98)70233-1. [DOI] [PubMed] [Google Scholar]
- 24.Heffernan MJ, Aquilino SA, Diaz-Arnold AM, Haselton DR, Stanford CM, Vargas MA. Relative translucency of six all-ceramic systems. Part I: Core materials. J Prosthet Dent. 2002;88:4–9. [PubMed] [Google Scholar]
- 25.Heffernan MJ, Aquilino SA, Diaz-Arnold AM, Haselton DR, Stanford CM, Vargas MA. Relative translucency of six all-ceramic systems. Part II: Core and veneer materials. J Prosthet Dent. 2002;88:10–15. [PubMed] [Google Scholar]
- 26.O'Keefe KL, Pease PL, Herrin HK. Variables affecting the spectral transmittance of light through porcelain veneer samples. J Prosthet Dent. 1991;66:434–438. doi: 10.1016/0022-3913(91)90501-m. [DOI] [PubMed] [Google Scholar]
- 27.Nassau K. The physics and chemistry of color. 2nd ed. New York: John Wiley & Sons; 2001. pp. 231–236.pp. 390 [Google Scholar]
- 28.Kingery WD, Bowen HK, Uhlmann DR. Introduction to ceramic. 2nd ed. New York: John Wiley & Sons; 1976. p. 668. [Google Scholar]


