


Abstract
Transcription factor binding specificity is crucial for proper target gene regulation. Motif discovery algorithms identify the main features of the binding patterns, but the accuracy on the lower affinity sites is often poor. Nuclear factor E2-related factor 2 (NRF2) is a ubiquitous redox-activated transcription factor having a key protective role against endogenous and exogenous oxidant and electrophile stress. Herein, we decipher the effects of sequence variation on the DNA binding sequence of NRF2, in order to identify both genome-wide binding sites for NRF2 and disease-associated regulatory SNPs (rSNPs) with drastic effects on NRF2 binding. Interactions between NRF2 and DNA were studied using molecular modelling, and NRF2 chromatin immunoprecipitation-sequence datasets together with protein binding microarray measurements were utilized to study binding sequence variation in detail. The binding model thus generated was used to identify genome-wide binding sites for NRF2, and genomic binding sites with rSNPs that have strong effects on NRF2 binding and reside on active regulatory elements in human cells. As a proof of concept, miR-126–3p and -5p were identified as NRF2 target microRNAs, and a rSNP (rs113067944) residing on NRF2 target gene (Ferritin, light polypeptide, FTL) promoter was experimentally verified to decrease NRF2 binding and result in decreased transcriptional activity.
INTRODUCTION
Transcription factors bind to specific sequences within the genome, but in most cases detailed information about the sequences does not exist (1). Nuclear factor E2- related factor 2 (NRF2) is a ubiquitously expressed transcription factor and a key regulator of cellular redox homeostasis (2). In addition to antioxidant and detoxification genes, NRF2 regulates genes involved in the metabolic control of the cell, and genes involved in the repair and degradation of damaged macromolecules (2). Experimental studies using animal models of disease show a protective role of NRF2 in age-related degenerative and inflammatory diseases (3,4). In addition, the gene encoding NRF2, NFE2L2, has been shown to be highly polymorphic and these functional risk alleles and haplotypes have been identified in various human disorders (4). However, NRF2 binding sequence variation has been less extensively studied. Although the consensus sequence for the NRF2 binding antioxidant response element (ARE) sequence has been previously identified (5–9), a more thorough analysis of the allowed variance on the binding sequence is prerequisite for predicting the functional binding sites (Figure 1A) and the effects of disease-associated sequence polymorphisms on the transcription factor binding more accurately (Figure 1B).
Figure 1.

Cellular stress response and regulatory SNPs. (A) In basal conditions, NRF2 is bound by KEAP1 inhibitory complex, polyubiquitinated by the Cul3-based E3 ligase (CUL3) complex and rapidly degraded by the proteasome. Only a small proportion of NRF2 is able to avoid proteasomal degradation and migrate to the nucleus to mediate basal Antioxidant Response Element (ARE)-dependent gene expression thereby maintaining cellular homeostasis. Under cellular stress, KEAP1 is modified through cysteine residues leading to inhibition of proteasomal degradation and accumulation of NRF2 in the nucleus. NRF2 binds to AREs together with small MAF proteins (MAFF, MAFG and MAFK) and drives the expression of NRF2 target genes such as NQO1, HMOX1 and FTL. (B) Single nucleotide polymorphisms (SNPs) in transcription factor binding sites may alter the binding properties of a transcription factor either by destroying, creating, weakening or enhancing a binding site and thus affecting target gene regulation.
Genome-wide association studies (GWAS) provide information that associate variations on genomic loci with human diseases and traits (10). However, a genomic locus associated with a certain disease in GWAS typically contains dozens of variants leaving the actual disease-causing variant(s) and the mechanisms for the increased disease susceptibility unfound (11). The majority of heritable genetic risk factors for most common diseases remain elusive (12), suggesting that the genetic architecture for many traits is polygenic and that hundreds of genetic variants play a causal role in a multitude of traits (13,14). About 89% of disease-associated variations reside in intronic or intergenic regions (15), making it difficult to pinpoint the direct molecular consequences of the variants for human physiology. Given that genetic risk variants commonly target cis-regulatory elements, mainly enhancers, in a disease-, tissue- and cell-specific manner (16–24), it has been suggested that the major contributors predisposing to common diseases are variants called regulatory SNPs (rSNPs) that modulate binding of transcription factors (11). Indeed, enhancer-targeting disease-associated loci commonly harbour genetic variants that map to transcription factor binding sites and modulate the binding affinity for transcription factors with direct consequences on target gene expression (16,25–27).
In this study, we have utilized molecular dynamics (MDs) simulations and custom-made protein binding microarrays combined with publicly available chromatin immunoprecipitation coupled with deep sequencing (ChIP-seq) data to study the binding preferences of NRF2 in order to create a flexible sequence model that captures subtle sequence changes affecting binding strength of NRF2 more precisely than previously published position weight matrix (PWM) model (9). This new model has been applied to the search of putative genome-wide NRF2 binding sites, and the search of binding sites bearing genetic variations that lead to drastic changes in NRF2 binding, and consequently, in target gene regulation (Figure 2). To illustrate the feasibility of this approach in finding putative target genes and causal rSNPs, miR-126–3p and -5p were shown to be NRF2 target genes, and a rSNP found on previously identified NRF2 target gene (Ferritin, light polypeptide, FTL) promoter was found to confirm the correlation between predicted and measured NRF2 binding and consequent transcriptional activity. The data presented here is the first step towards a model that allows prediction of NRF2-regulated gene expression based on regulatory genetic code.
Figure 2.
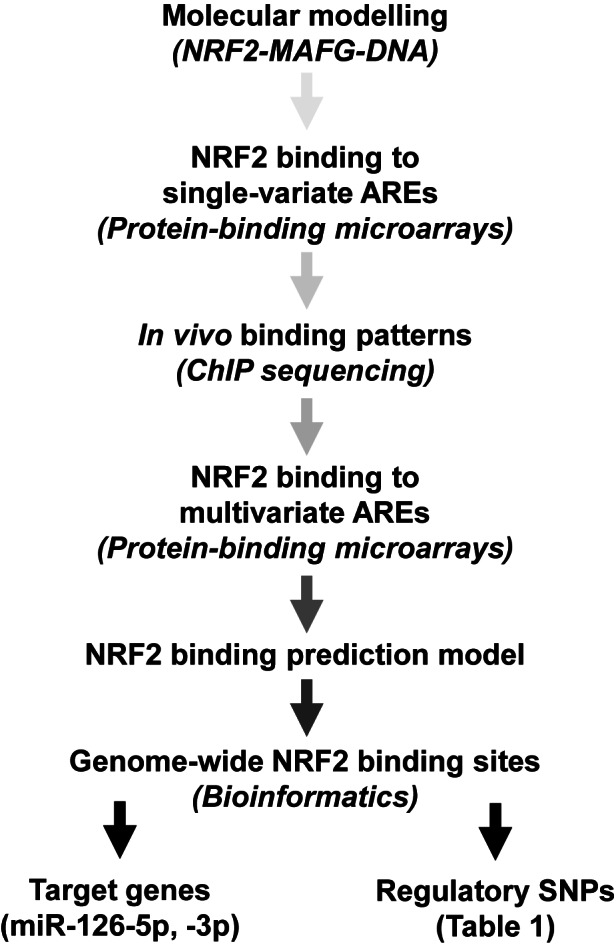
Project outline.
MATERIALS AND METHODS
Molecular modelling
Comparative modelling
The x-ray structure of v-maf avian musculoaponeurotic fibrosarcoma oncogene homolog G (MafG) homodimer complexed to DNA (5′-CTGATGAGTCAGCAC-3′, [PDB ID: 3A5T]) determined to 2.8 Å resolution (28) was used as a template to model the NRF2-MAFG-DNA (5′-CAGTGACTCAGCAG-3′), MAFG-NRF2-DNA (5′-CAGTGACTCAGCAG-3′), MAFG-MAFG-DNA (5′-CAGTGACTCAGCAG-3′) and NRF2-NRF2-DNA (5′-CAGTGACTCAGCAG-3′) complexes. In the modeling, the TGATGAGTCAGCAC sequence of the template was replaced with the target sequence CAGTGACTCAGCAG. In the case of base substitution, the Leap programme of the AMBER package ( AMBER 14 (29), University of California, San Francisco) was used to build the coordinates of the new base by using the common atoms of the two bases. Thus, only the coordinates of the atoms not shared by the two bases were built. The NRF2 of the models was built using corresponding MAF monomer of the x-ray structure as a template and the Prime module of Schrödinger suite (Schrödinger Release 2014–3: Maestro, version 9.9.013; Prime, version 3.7, Schrödinger, LLC, New York, NY, 2014).
Molecular dynamics simulations
Crystallographic water molecules of the x-ray structure were included in the simulation system when they did not overlap protein or DNA atoms. For the MD simulations, the NRF2-MAFG-DNA/MAFG-NRF2-DNA complexes were solvated by TIP3P water molecules (∼30 000) in a periodic box with dimensions of 92 × 62 × 122 Å. The water molecules of systems were first energy-minimized for 1000 steps, heated to 300 K in 60 ps and equilibrated by 100 ps at a constant temperature of 300 K and constant volume. After that, the simulation systems were minimized for 1000 steps, the temperature of the system were increased to 300 K in 80 ps and equilibrated for 20 ps. The production simulation of 10 ns at a constant temperature of 300 K and pressure (1 atm) was then started. In the simulations, the electrostatics were treated using the particle-mesh Ewald method. A timestep of 2.0 fs was used and bonds involving hydrogen atoms were constrained to their equilibrium lengths. From the production simulations, structures were saved every 1.0 ps for analyses. The MD simulations were done using the SANDER and PMEMD programmes of the AMBER 14 package. In all the simulations, the Duan et al. (30) force field (parm99 + frcmod.ff03 parameter files of AMBER) was used. The stability of the structures was checked from the root-mean-square deviation curves of the backbone Cα calculated with the cpptraj (31). Figures were created using the PyMOL programme (The PyMOL Molecular Graphics System, Version 1.7.0.5, Schrödinger, LLC).
ChIP-seq analysis
ChIP-seq datasets GSE37589 (32) and GSM1208659 were downloaded from GEO. Reads were aligned to hg19 using Bowtie (-v 2 -m3 -k 1 –best) and peak detection performed with QuEST (33). Specifically, the following settings were used: Mappable genome fraction: 0.8; KDE bandwidth: 30. ChIP seeding fold enrichment: 15; ChIP extension fold enrichment: 3; ChIP-to-background fold enrichment: 3. Known satellite DNA regions were removed using a track available via UCSC Table Browser. De novo DNA motif analysis was performed using command line version of MEME-ChIP (34), using parameters -mod zoops -nmotifs 4 -minw 8 -maxw 20 -revcomp -p 5. FIMO (34) tool and MEME-ChIP results were used to extract individual motif occurrences to cover whole genome using parameters –motif 1 -pthresh 0.0001. R 2.14 and BEDtools (35) were used to process files.
Expression vectors
Expression vectors for MAFF and MAFK were cloned as previously described in (36) for NRF2 and MAFG. In short, MAFF and MAFK cDNAs (German Research Center for Genome Research, Germany) were polymerase chain reaction (PCR) amplified and cloned to the HindIII and EcoRI restriction sites of the respective pcDNA3 vectors with the Kozac consensus sequence. The primers used for the cloning are listed in Supporting Material: Table S1. Constructs were verified by sequencing.
In vitro translation
Human NRF2, MAFF, MAFG and MAFK proteins were generated by coupled in vitro transcription/translation system using their respective pcDNA3-based cDNA expression constructs and TNT Quick Coupled Transcription/Translation kit as recommended by the supplier (Promega, Madison, WI, USA).
Oligonucleotide anneal
Double-stranded DNA oligonucleotides were constructed of three separate single-stranded oligonucleotides (Sigma-Aldrich, St Louis, MO, USA): a biotin-tagged universal primer (17 nt), oligonucleotide containing the variable ARE (33 nt) and a complementary oligonucleotide for the former two oligonucleotides (50 nt). Oligonucleotides are listed in Supporting Material: Tables S2 and S3. Multi Core Buffer (Promega, Madison, WI, USA) containing 5 μl of each of the three oligonucleotides (100 μM) were was first heated at 85°C on a heat block for 5 min. Heat block was then switched off and the annealing reactions were slowly cooled to RT on the block.
Protein binding microarrays
Glass slides were activated with pre-polymerized glutaraldehyde and coated with avidin (37). Oligonucleotides and controls (positive control [NQO1.ARE], negative controls [Scramble oligonucleotides and Phosphate Buffered Saline; PBS]) were diluted 1:20 in PBS. The dilutions were dispensed in a 384-well plate (polypropylene plate No 267462, Nunc, N.Y, USA) and printed onto the avidin-coated glass slides with a microarray printer (BioRobotics MicroGrid II, BioRobotics Ltd, Cambridge, UK). After two days incubation at RT protected from light and moisture, the array slides were washed with TE-buffer (10 mM Tris–HCl, 1 mM ethylenediaminetetraacetic acid (EDTA), pH 8.0) and incubated in SYBR Green I solution (1:10 000 in TE buffer, Sigma-Aldrich, St Louis, MO, USA) for 5 min at RT protected from light. The slides were washed with TE-buffer and deionized water, dried with compressed air and scanned at 488 nm using ScanArray 5000 (GSI Lumonics, Packard Bioscience, USA). SYBR Green I signal serves as a measure of the amount of printed oligonucleotides on each spot, and is used during data analysis for normalization. After scanning, the slides were incubated in 100 mM NaCl with 2.5 volumes of ethanol for 20 min at RT and washed with 70% ethanol and deionized water and dried by compressed air. The slides were incubated for 10 min at RT in a blocking solution (0.5% bovine serum albumin (BSA) in PBS). After washing with Phosphate Buffered Saline with Tween 20 (PBST) and drying by compressed air, nine parts of MAFG was added to the 11 parts of NRF2 in a tube and the protein solution was added on the arrays (10 μl/array) for 10 min in RT. The unbound proteins were removed by washing the slides with PBST. NRF2 antibody (sc-722, Santa Cruz Biotechnology, USA) was diluted 1:500 (2 μg/ml) in PBS and 1 ml solution was added on the arrays. After 10 min incubation at RT, the slides were washed with PBST. Fluorescence labelled secondary antibody anti-rabbit IgG Alexa Fluor 546 (goat polyclonal, Invitrogen, USA) was diluted 1:1000 (2 μg/ml) in PBS and 1 ml of solution was added to each slide. Slides were incubated for 10 min at RT followed by washes with PBST and deionized water. Finally, the slides were dried by compressed air and scanned by ScanArray 5000 (546 nm laser, GSI Lumonics, USA). Fluorescence intensities were analysed using Spotfinder software (http://www.tm4.org/spotfinder.html).
Data analysis for protein binding microarrays
The spot intensity data was analysed using a custom pipeline developed in R. First, outlier spots, defined as deviating more than 2 SDs from the z-scored mean for the respective oligonucleotide across all the arrays, were detected separately from both SYBR Green I and NRF2 intensities and eliminated globally from both intensities. Individual arrays with now more than 20% missing values were discarded entirely. Thereafter, the NRF2 intensities were corrected for background within each array by dividing them, per spot, by the relative SYBR Green I intensities, and normalized across all arrays using the ‘cyclicloess’ method of the normalizeBetweenArrays function from the ‘limma’ R/Bioconductor package. The lower limit of detection, defined as the 90% percentile of the combined scrambled oligonucleotide intensities, was next subtracted from all normalized intensities, and all intensities now falling below zero were replaced by zero to avoid falsely inflating especially the means of weakly binding oligonucleotides. Finally, oligonucleotide intensities were expressed as relative to the mean of the reference oligonucleotide, and subjected to the final round of outlier detection and removal with the same ±2 SD limit as above.
Candidate NRF2 binding AREs and the search for clinically significant rSNPs
To facilitate the genome-wide search for SNPs affecting NRF2-MAFG binding the explicit 11 nt oligonucleotides measured or predicted to bind NRF2 were defined as follows: the 11 nt core sequence was divided into four ‘motifs’ with suggested inter-dependency (positions 1–4, 5, 6–8 and 9–11), and all possible nucleotide combinations within each motif that might therefore contribute positively to binding were generated (5, 4, 57 and 30 combinations, respectively). All 34200 possible permutations within each motif were then formed, supplementing them with additional sequences (the reference, all possible 33 single nucleotide variants and a few explicit binder sequences) and eliminating a few explicit non-binder sequences, yielding the initial set of 34224 unique 11 nt possible binder sequences. For these, predicted binding values were calculated as illustrated in Figure 6. All sequences with more than four variations were discarded as likely non-binders, leaving 5253 sequences that were then converted to fasta format and used as the query on a Blast search of a database of short sequences (21 nt for the 1 nt variants, centred on the variant) representing all known alleles in the dbSNPv137 with essential command line arguments ‘blastn -task megablast -strand both -word_size 11 -dust no’. For details on the generation of the allelic dbSNPv137 database and its conversion to Blast source database, see Supporting Material. Then, to focus on SNPs with potential clinical consequences, all perfect-match Blast hits were filtered to obtain a total of 190 698 dbSNPv137 SNPs that were among (i) the 49 065 unique SNPs compiled from the NCBI SNP subsets for OMIM (17 365 rsIDs) and Clinical/LSDB Submissions (34 978 rsIDs) and the UCSC GWAS SNP catalogue (12 723 rsIDs), or (ii) the 180 500 proxy SNPs in significant linkage disequilibrium (LD) with and fairly proximal to any of the point i) SNPs (R2 ≥ 0.8, distance <100 kb) using the SNAP online tool (http://www.broadinstitute.org/mpg/snap/), but (iii) not among exonic SNPs (defined as having value ‘exonic’ in the ‘fxn-class’ field of the flat SNP annotations). To simplify the data set, for each rsID all allele—binder sequence pairs were removed but the one that had the highest predicted binding value. Further, the 11 nt sequence along either strand of any of the non-binding alleles that gave the highest predicted binding value was chosen as the conservative basis for calculating the maximal difference in predicted binding value between the binding and non-binding alleles of an rsID.
Figure 6.

Testing the limits of NRF2 binding. Systematic multivariate ARE results by protein binding microarray for NRF2-MAFG heterodimer are shown. Tolerance for sequence variation was studied for positions 1–3 (white), 6–8 (grey) and 9–11 (dark grey) (A) and positions 1, 5 and 11 (seed sequences are shown in grey) (B). Results are depicted as measured binding relative to NQO1.ARE binding (black) (mean ± S.E.M., n = 45).
Locations of genome-wide putative NRF2 binding sites in hg19 were collected into a BED6-formated file and split to five subsets representing high to low categories of predicted binding strength: 16 576 ‘Strong’ (relative binding >0.9); 120 252 ‘Medium to Strong’ (relative binding ≤0.9 but >0.67); 400 229 ‘Medium’ (relative binding ≤0.66 but >0.5); 656 194 ‘Medium to Weak’ (relative binding ≤0.5 but >0.4); and 1 099 564 ‘Weak’ (relative binding ≤0.4 but >0.3) binding sites were predicted. The subset of high binding strength is included as example (Supporting Material: Table S4) and the other subsets are available upon request.
NRF2 activating agent and human umbilical cord vein endothelial cells (HUVECs)
1-palmitoyl-2-arachidonoyl-sn-glycero-3-phosphocholine (PAPC, 10 mg/ml) was purchased from Avanti Polar Lipids, Inc., oxidized to oxPAPC and used as described in (38).
Human umbilical vein endothelial cells (HUVECs) were extracted with collagenase (0.3 mg/ml) digestion from umbilical cords obtained from the maternity ward of the Kuopio University Hospital with the approval of its ethics committee. The cells were cultivated as previously described in (39).
Chromatin immunoprecipitation
ChIP was performed as previously described in (36), with following modifications: Prior to immunoprecipitations, 20 μl of Magna ChIP magnetic beads (Millipore) per immunoprecipitation were re-suspended to 1 ml of PBS/BSA (5 mg/ml). Beads were washed with PBS/BSA and re-suspended in 2 ml of PBS/BSA. A total of 5 μg of antibody (Nrf2, sc-722 or anti-rabbit IgG, Sc-2027, Santa Cruz Biotechnologies) was added to each tube. The tubes were incubated on rotating platform O/N at +4°C. The next day, the beads were washed twice with PBS/BSA and re-suspended in 100 μl of PBS/BSA. HUVECs were grown on 10 cm plates. After crosslinking, nuclei were extracted by scraping the cells to 1 ml of MNase buffer (10 mM Tris pH 7.4, 10 mM NaCl, 5 mM MgCl2, 0,1% NP-40, protease inhibitors) and after 10 min incubation on ice, the nuclei were pelleted by centrifugation (1500 x g, 5 min, +4°C). The extracted nuclei were washed with 1 ml MNase buffer and, after centrifugation, lysed with 0.3 ml sodium dodecyl sulphate (SDS) lysis buffer (1% SDS, 10 mM EDTA, 50 mM Tris–HCl, pH 8.1, protease inhibitors). Sonicated chromatin was divided in 100 μl aliquots and suspended in 1 ml of ChIP dilution buffer (0.01% SDS, 1.1% Triton X-100, 1.2 mM EDTA, 167 mM NaCl, 16.7 mM Tris–HCl, pH 8.1, protease inhibitors). A total of 2.5 μl BSA (100 mg/ml) was added to each tube. Hundred microlitre chromatin sample was removed as input DNA. Hundred microlitre of antibody-bound beads were added to the chromatin samples and the samples were incubated O/N at +4°C on a rocking platform. Next day, the beads were washed five times with LiCl wash buffer (100 mM Tris pH 7.5, 500 mM LiCl, 1% IGEPAL, 1% Sodium deoxycholate) and twice with TE buffer (10 mM Tris–HCl, pH 7.5, 1 mM EDTA) and eluted with 200 μl of elution buffer (1% SDS, 0.1 M NaHCO3). All samples were treated with Proteinase-K (10 mg/ml, Thermo Scientific) and DNA was purified with MinElute PCR Purification Kit (Qiagen).
Real-time quantitative PCR of ChIP templates were performed as in (36) using chromatin region-specific primers (Sense: 5′-AGGCTCCTGTGTGGCT-3′ and Antisense: 5′-TGGGCCAAGGATGCT-3′). The results were calculated relative to control treatment values.
Transfections
Oligonucleotides MISSION hsa-miR-126–3p mimic (HMI0117, Sigma-Aldrich), MISSION miRNA Mimic, Negative Control #1 (HMC0002, Sigma-Aldrich), MISSION hsa-miR-126–3p inhibitor (HSTUD0117, Sigma-Aldrich) and MISSION Synthetic microRNA (miRNA) Inhibitor, Negative control 1 (NCSTUD001, Sigma-Aldrich) were transfected into cells using Oligofectamine (Invitrogen). Mimic and mimic control concentration used in the experiments was 25 nM, and inhibitor and inhibitor control concentration was 1 nM.
RNA extraction and qPCR
Exosomes were extracted using miRCURY Exosome Isolation Kit (Exiqon). Non-exosomal RNA was extracted from the exosome-depleted medium after exosome extraction using miRCURY RNA Isolation Kit for Biofluids (Exiqon). Total RNA (cellular and exosomal) was extracted using the miRCURY RNA isolation kit for cells and plants (Exiqon) and reverse transcribed using the miRCURY LNA Universal RT miRNA PCR, Polyadenylation and cDNA synthesis kit (Exiqon) for miRNAs and Transcriptor First Strand cDNA Synthesis Kit (Roche) for mRNA. The cDNA templates were assayed in 10 μl PCR reactions with a LightCycler 480 Real-Time PCR System (Roche) according to the protocol of miRCURY LNA Universal RT miRNA PCR for miRNA samples and the protocol of Fast Start Universal Probe Master (Rox) (Roche) for mRNA samples using hsa-miR-126–5p (206 010, Exiqon) and -3p (204227, Exiqon) LNA™ PCR primer set, UniRT and Assays-on-Demand target mixtures for KEAP1 (Hs00202227_m1, Applied Biosystems), Krüppel-like factor 2 (KLF2) (Hs00360439_g1, Applied Biosystems) and EGFL7 (Hs00211952_m1, Applied Biosystems), and control genes PPIA1 (Hs04194521_s1, Applied Biosystems) and GAPDH (Hs99999905_m1, Applied Biosystems). The amplification curves were analysed using the Roche LC software, both for the determination of Cp (by the second derivative method) and for the melting curve analysis.
Western blot
Western blots were performed as previously described in (40) using antibodies for KLF2 (sc-18690, Santa Cruz Biotechnologies), β-actin (#4967L, Cell Signaling Technology and sc-47778, Santa Cruz Biotechnologies), ECL Plex goat-α-rabbit IgG, CY5 (PA45012V, GE Healthcare) and ECL Plex goat-α-mouse IgG, CY3 (PA43010V, GE Healthcare).
Luciferase reporter gene assay
Luciferase reporter constructs with either FTL ARE with SNP A or FTL ARE with SNP C were cloned using oligonucleotides listed in Supporting Material: Table S1. Oligonucleotides were annealed and cloned into the KpnI-SacI site in the pGL3-SV40 vector (Promega, Madison, WI, USA). Constructs were verified by sequencing. HEK-293T cells were cultured as previously described in (36), seeded onto 96-well plates and transfected the next day with the calcium phosphate transfection method using the following plasmids: 20 ng of pGL3-SV40 as control, pGL3-SV40–1xNQO1-ARE-luciferase (41), pGL3-SV40–1xFLT1-SNP-A-ARE-luciferase, or pGL3-SV40–1xFLT1-SNP-C-ARE-luciferase, and 40 ng of pcDNA3 (Invitrogen) as a control or pCI-NRF2 (42). For normalization, cells were also transfected with 20 ng of pCMV-β-galactosidase vector (Invitrogen). Twenty-four hours after transfection, cells were treated with 5 μM sulforaphane (SFN). Sixteen hours after treatment, luciferase activities were measured with Britelite Reporter Gene Assay (Perkin Elmer) according to the manufacturer's instructions. Luciferase activities were normalized to β-galactosidase activities measured as previously described (41) and represented as fold change versus pGL3-SV40-control vector for each treatment.
RESULTS
Analysis of the simulated NRF2-MAFG-DNA models
Dimeric small MAF proteins bind to MAF recognition elements (MAREs) (TGCTGAG/CTCAGCA), which have a 12-o-tetradecanoylphorbol-13-acetate -responsive element (TRE) (TGAG/CTCA) sequence as the core sequence, whereas the AREs (G/ATGACTCAGCA) are composed of TRE and MARE elements (28). Based on Maf homodimer and Nrf2-MafG heterodimer binding measurements (28,43), Nrf2-MafG heterodimer is more sensitive to a core mutation of the MARE than MafG homodimer, thus indicating that Nrf2 recognizes the core sequence (TRE) and small Maf proteins the MARE half of the sequence.
In order to study the protein–DNA interactions, the NRF2-small MAF heterodimeric complexes and DNA were modelled using comparative modelling followed by MDs simulations (Figure 3). Two models were constructed: (i) NRF2 as ‘Chain A’ and MAF as ‘Chain B, and (ii) MAF as ‘Chain A’ and NRF2 as ‘Chain B. As small MAF proteins (MAFF, MAFG and MAFK) are identical on the motifs included in the modelling, MAFG was chosen as a representative for all three. Unconstrained MD simulations of 10 ns showed that both of the models were stable over the simulation period (Supporting Material: Figure S1), but the RMS deviations (Supporting Material: Figure S2) suggested that the model having NRF2 as ‘Chain A’ and MAFG as ‘Chain B’ was more stable of the two. The notion is in accordance with the model, which positions NRF2 with TRE sequence and MAFG with half TRE half MARE sequence. Further analysis of the interaction patterns of the MD model revealed several hydrogen bond and salt bridge contacts between the protein side chains and DNA backbone phosphate groups which have a major role in the recognition and positioning of the protein to the DNA groove (Supporting Material: Figure S3 and Table S5). The specificity of the binding was achieved at the bottom of the groove with the formation of specific hydrogen bonds accompanied with hydrophobic contacts between the protein side chains and DNA bases. In contrast to homodimeric MAF proteins, NRF2 is unable to form homodimers (36,44–46) most likely due to the repulsion caused by two positively charged lysine (K72) residues at the cross section of the homodimeric NRF2–DNA complex and a disturbed hydrogen bond network caused by the positioning of asparagine residues, which causes a tilt at the helical structure of the subunit A (Supporting Material, Figure S4).
Figure 3.

NRF2-MAFG bound to double stranded DNA. (A) An overview of the modelled binding mode of NRF2-MAFG–DNA. (B) More specific interactions between the residues of NRF2 (cyan) and MAFG (green) to DNA. For the clarity only interactions between protein side chains and DNA bases are shown. In addition, key hydrogen bond contacts are highlighted using dotted lines. (C) A schematic presentation of specific protein–DNA interactions using cyan coloured marks for NRF2 and green for MAFG. Elliptical shapes stand for hydrogen bond interactions and round shaped plots hydrophobic van der Waals’ contacts. At the DNA groove, the interactions were found to be composed of conserved hydrogen bonds between Asn61 of NRF2 and positions 1G and 2T of the DNA strand and accompanying hydrophobic interactions between two NRF2 Alanines (A64 and A65) and 2T. An additional contact pattern was formed with the counter DNA strand positions 1–4 (CACT motif) consisting of hydrogens bond with 3C and hydrophobic interactions with 1C, 2A and 4T.
The impact of systematic ARE variations on NRF2 binding
In previous studies, the MARE sequence variations forming the basis for selective Maf-Nrf2 heterodimer binding over Maf homodimer binding (46) and the molecular basis distinguishing the binding profile of the heterodimer from the homodimer (43) have been investigated, but systematic assessments of ARE variance on NRF2 binding are lacking. A recent high-throughput SELEX analysis on small MAF proteins resulted in TGAC/GTCAGCA as dimeric MAF binding sequence and TGAC/G as monomeric MAF binding sequence suggesting a strong MAF interaction with the palindromic TRE core of the sequence also in the absence of NRF2 (47). This finding indicates that the intact TRE core is also essential for the homodimeric MAF binding and further suggests intolerance towards sequence variation on the motif.
In order to examine the impact of the systematic point variations of ARE on the binding site affinity, the binding of the in vitro-translated NRF2-small MAF protein heterodimers was investigated using custom-made protein binding microarrays. ARE residing on a well-characterized NRF2 target gene (NAD(P)H dehydrogenase, quinone 1, NQO1) promoter was chosen to serve as a reference sequence as it matches the consensus sequence for NRF2 (9) (Figure 4A). The binding of all three small MAF proteins was investigated, but no significant differences were found between their binding profiles (Supporting Material: Figure S5), therefore, MAFG was chosen as a representative for all three. The ‘TGA’ motif (positions 2–4 of the ARE sequence) was found critical for the heterodimer binding (Figure 4B and Supporting Material: Table S6), whereas the rest of the sequence allowed more variation without major effects on the relative binding. This is in accordance with both the modelling data and the recent publications (28,43,47), where the most important interactions for NRF2 binding were formed with these positions (Figure 3).
Figure 4.

Impact of ARE variation on NRF2-MAFG binding. (A) Illustration of oligonucleotide designing for protein binding microarrays. Full-length NRF2 binding consensus ARE (21 nt) is shown with 11 nt core element. Experimentally verified NRF2-binding ARE on NQO1 gene promoter was selected as a reference sequence (50 nt) and the 11 nt core element was systematically varied one position at a time to receive all 33 single variation sequences. (B) The binding of NRF2-MAFG heterodimers on the varied ARE sequences (n = 36) was measured using custom-made protein binding microarrays. Results are depicted as measured binding relative to NQO1.ARE binding (mean ± S.E.M.).
To gain further insight into the cellular binding preferences of NRF2 and the effects of multiple variations of ARE on the NRF2 binding, publicly available NRF2 ChIP-seq datasets (GSE37589 (32) and GSM1208659) were analysed. De novo motif search successfully enriched ARE motif in the sites identified by ChIP-seq. (Of note, the cut-off in the motif enrichment was set very low in order to detect as many ARE-like sequences from the data as possible.) The ARE-like sequences forming the motif were then extracted from the datasets and categorized into groups based on the detected sequence similarities. All of the collected, nearly 1000 unique ARE sequences could be summarized into 48 representative sequences listed in Figure 5A by replacing nucleotides in positions 1, 5 and 11 with ‘n’. The majority (65.3%) of the 1000 unique sequences were confirmed of being ‘nTGAnTCAGCn’ (where n = A, C, G or T), which is similar to the classical NQO1 ARE sequence (ATGACTCAGCA) (Figure 5A). The binding of NRF2-MAFG heterodimers to the representative sequences was measured using protein-binding microarrays (Figure 5B and Supporting Material: Table S7). As the cut-off in motif enrichment was set low, not all of the identified ARE-like sequences were true NRF2 binding sites and thus, only a proportion of the measured sequences were expected to bind NRF2. According to the measurements, ARE sequence could be divided into three submotifs (n-‘TGA’-n-‘TCA’-‘GC’-n). The sequences capable of binding NRF2 were varied only on the middle motif, ‘TCA’, whereas variations on ‘TGA’ (positions 2–4) or ‘GC’ (positions 9–10) motifs abolished the binding. This was partially in contrast with the single variation measurements, where the ‘GC’ motif (positions 9–10) was found to tolerate more variation.
Figure 5.

NRF2-MAFG binding on multivariate AREs. (A) Nearly 1000 unique ARE-like sequences collected from publicly available NRF2 ChIP-seq datasets were listed and summarized into 48 representative sequences by replacing positions 1, 5 and 11 of the unique sequences with ‘n’. The occurrence of these 48 sequence types in the ChIP-seq data is shown in percentages (%). The names of the sequences (Tested Oligos) indicate the varied positions of the sequence compared to the reference sequence, NQO1 ARE (GTGACTCAGCA). (B) The binding of NRF2-MAFG heterodimers to the 48 representative sequences was measured using protein binding microarrays. Positions 1, 5 and 11 in the sequence were filled with nucleotides that occurred most often in these positions in the ChIP-seq data (A, C and A respectively). Results are depicted as measured binding relative to NQO1.ARE binding (n = 39, mean ± S.E.M.).
To address the question whether allowed sequence variation was restricted to certain parts of the sequence, a third set of multivariate oligonucleotides was designed. In addition to testing the variability of the ‘TGA’ (positions 2–4) and the ‘GC’ (positions 9–10) motifs, oligonucleotides designed to determine the limits of the ‘TCA’ motif variation (positions 6–8) and the possible effects of the ‘n’ nucleotides (positions 1, 5 and 11) were added to the measurements. The combined results (Figures 4–6 and Supporting Material: Table S8) suggested that, although the first (‘TGA’, positions 2–4 of the sequence) and the third motif (‘GC’, positions 9 and 10) of the sequence did allow some variation to the sequence (Figures 4 and 6), the variation was limited compared to the middle motif (‘TCA’, positions 6–8, Figures 4–6) and the combinatorial variations (i.e. variations occurring in other parts of the sequence in addition to variations in the first or third motif) were even more restricted (Figure 5). These results are in line with the molecular modelling results (Figure 3, Supporting Material: Table S5), where MAFG was found to form three well organized hydrogen bonds with the ‘TCG’ motif (positions 8–10) of the complementary DNA strand in addition to hydrophobic contacts formed with the ‘TCAG’ motif (positions 6–9) of the first DNA strand. This wide DNA contact interphase appears to allow more flexibility to the binding site recognition and stabilization when the motif is varied.
In the majority of the cases, ‘n’ nucleotides (positions 1, 5 and 11 of the sequence) did not have drastic effects on the binding strength, and the variations on these positions weakened the protein binding as expected. However, for some weak binders, adding variation to the ‘n’ position increased the binding compared to sequences without the variation (1A10T versus 1A10T11C/G/T), which could be due to neighbouring effect. Overall, the binding results emphasize the importance of the positions 2–4, 6–8 and 9–10 for determining the binding capacity of the sequence, and suggest that position 11 has base-stacking interactions with positions 9 and 10. In addition, the data indicates that the sequence cannot bear more than four variations compared to the consensus sequence ‘GTGACTCAGCA’, irrespective of the variation positions and the magnitude of their single variation effects. These results agree partially with a recent study where the characteristics of mouse AREs were examined from Nrf2 ChIP-seq data by analysing and categorizing ARE-like motifs (48): the study concluded that the majority of the detected Nrf2-MafG binding sites contained A or G in the ARE position 1 and TCA in positions 6–8 (GTGACtcaGCA), which agrees with the human NRF2 ChIP-seq data analysed for this study. However, major variant nucleotides for mouse data positions 6, 7 and 8 were A/G, A/T and T/G, respectively, whereas in the human data they were A/C for position 6, A for position 7 and C/G for position 8. Therefore, our data does not support the suggested reformulation of the core ARE motif to TGACDHDGC (where D = not C and H = not G).
Prediction of NRF2 binding on AREs
A popular way of describing a transcription factor binding specificity mathematically is a PWM, which describes the effect on binding for each base of the sequence separately (47,49). The advantage of the model is its simplicity and, thus, ease of use, but the weakness is that it assumes that the binding of protein to individual bases in the sequence is independent, when, in fact, adjacent bases commonly affect each other (47). The specificity of the model can be improved by additional parameters and several alternative models have been created (1,50–52), but they lack the simplicity of the PWM model.
To explore the possibility to predict the multivariate effects from their component single variant measurements, a simple multiplicative model, exemplified in Figure 7, was tested. The single variation values used for the calculations were derived from single variation measurements by calculating the binding relative to the strongest binder in the series (7A) in order to bring all values between 0 and 1. Overall, the predicted binding strengths of the sequences showed high correlation with the measured values (Figure 7C and Supporting Material: Figure S6 A, C and E), and the model was found to bring significant improvement to the prediction accuracy of NRF2 binding AREs compared to the previously described PWM model for NRF2 (9) especially in the recognition of weak to nonbinding ARE-like sequences (Supporting Material: Figure S6).
Figure 7.

Mathematical model for the NRF2 binding strength prediction. (A) Variance table indicating the values for binding strength calculations for the binding prediction. The values are derived from the experimental single variation measurements by calculating the binding relative to the strongest binder in the series (7A) instead of the reference sequence (NQO1.ARE). (B) The simple multiplicative prediction model is exemplified for the ARE variant 1A6A8G. (C) Comparison of the predicted and measured binding strengths for the multivariate ARE sequences by Pearson correlation is shown.
Genome-wide NRF2 binding sites
In order to find and classify genome-wide putative NRF2 binding sites, the predictive binding model (Figure 7) was utilized. The genome was scanned and the locations of genome-wide putative NRF2 binding sites were collected and split to five subsets representing high to low categories of predicted binding strength. The subset of high binding strength is included in the Supporting Material (Supporting Material: Table S4) and the other subsets are available upon request.
Application 1: finding putative target genes
miRNAs are small non-coding RNAs that act as post-transcriptional regulators of gene expression by inhibiting target mRNA translation (53). They are important regulators of most cellular and developmental processes, and have been implicated in a large number of human diseases, including cardiovascular diseases (54), but less is known about their transcriptional regulation. miR-126–5p and miR-126–3p originate from a common precursor. The expression of miR-126–5p is lower of the two, but they are nevertheless both among the most highly expressed miRNAs in endothelial cells (55,56). Shear stress that protects from atherosclerosis increases endothelial miR-126–5p expression KLF2—dependently, whereas at atherosclerosis prone sites miR-126–5p expression is downregulated (56,57). miR-126–3p, on the other hand, is involved in angiogenesis and contributes to quiescent endothelial phenotype by reducing inflammatory activation and increasing cell survival (56). It is also enriched in membrane-enclosed vesicles (apoptotic bodies) that are secreted from apoptotic endothelial cells allowing its transfer from an apoptotic cell to a viable endothelial cell (58,59). In atherosclerotic mouse model, miR-126–3p-containing apoptotic bodies have been shown to limit atherosclerosis (59).
As NRF2 is an essential transcription factor involved in the maintenance of vascular health (56), we set out to investigate whether NRF2 regulates miR-126–3p and miR-126–5p in human vascular endothelial cells by utilizing the genome-wide binding site data obtained in this study. (Strong binding sites are listed in Supporting Material: Table S4, and other subset are available upon request.) The precursor for miR-126–3p and -5p resides on chromosome 9 in the intron 7 of the EGFL7 gene (Figure 8A). The EGFL7 gene locus was found to contain several putative NRF2 binding sites (Figure 8A), and ARE, which had the highest binding value according to the prediction and overlapped with H3K27Ac histone marker signal (marker for active regulatory elements) in human umbilical vein endothelial cells (HUVECs), was selected for experimental validation (Figure 8A). The element was verified to bind NRF2 (Figure 8B) and corresponding changes in the miR-126–3p and miR-126–5p levels were seen in NRF2 inducer (1-palmitoyl-2-arachidonoyl-sn-glycero-3-phosphocholine, oxPAPC) treated cells (Figure 8C, D and E). MicroRNAs were also secreted from the cells and were found to reside mostly in the exosomal fraction of the medium after NRF2 induction (Figure 8D and E).
Figure 8.

Regulatory loop of NRF2, miR-126 and KLF2 in HUVECs. (A) EGFL7 gene locus shown together with putative NRF2 binding sites (Class I: ‘Medium to Strong’ (relative binding 0.9–0.67); Class II: ‘Medium’ (relative binding 0.66–0.5); Class III: ‘Medium to Weak’ (relative binding 0.5–0.4); and Class IV: ‘Weak’ binding sites (relative binding 0.4–0.3)) and ENCODE HUVEC H3K27Ac data. miR-126 locus resides on intron 7. (B) HUVECs were treated with oxPAPC and NRF2 binding was measured with chromatin immunoprecipitation (ChIP) in 2, 4, 6 and 24 h time points (mean ± SD, n = 3). Results are shown as fold change against control samples. (C) Relative miRNA and host gene expression was measured with qPCR from oxPAPC-treated HUVECs in 4, 8, 12, 24 and 48 h time points (mean ± SD, n = 6). (D and E) Relative cellular expression and medium levels (exosomal and non-exosomal) for miR-126–3p and miR-126–5p were measured with qPCR from oxPAPC-treated HUVECs in 4, 8, 12, 16 and 24 h time points (mean ± SD, n = 3). (F) Regulatory loop for NRF2, miR-126 and KLF2. (G) The predicted binding of hsa-miR-126–3p to KLF2 mRNA (NM_016270.2 nt 466–487) (H) KLF2 expression was measured with qPCR from oxPAPC and control treated HUVECs after 8 h treatment. (I and J) HUVECs were transfected with inhibitor control, miR-126–3p inhibitor, mimic control and miR-126–3p mimic. Forty-eight hours after transfection, mimic samples were treated with oxPAPC to induce KLF2 expression. miR-126–3p and KLF2 expression were measured with qPCR (mean±SD, n = 3). (K and L) KLF2 and β-actin were measured from transfection samples after 16 h oxPAPC treatment. OxPAPC concentrations for (B–H) were 50 μg/ml and for (I–L) 20 μg/ml. In statistical analysis, samples were compared to respective control samples using unpaired t-test. *P < 0.05, **P < 0.01 and ***P < 0.001.
KLF2 is a transcription factor that is upregulated by atheroprotective blood flow in endothelial cells and inhibits endothelial inflammation together with NRF2 (60,61). As KLF2 has been shown to promote NRF2 pathway activation (62) and to upregulate miR-126 indirectly, we set out to investigate, whether miR-126 completes the regulatory loop by targeting KLF2 (Figure 8F). KLF2 sequence was found to contain several possible binding sites for miR-126–3p (Figure 8G), although no perfect match was found. KLF2 was confirmed to be significantly upregulated in NRF2 inducer treated cells (Figure 8H) and miR-126–3p mimic treatment was found to abolish the effect (Figure 8J). Furthermore, miR-126–3p inhibitor treatment caused a significant upregulation of KLF2 in uninduced cells (Figure 8J). On protein level, miR-126–3p inhibitor treatment caused a moderate increase in KLF2 levels (Figure 8K), whereas miR-126–3p mimic decreased KLF2 levels in oxPAPC-treated cells (Figure 8L) suggesting that KLF2 is a miR-126–3p target gene.
Application 2: detecting regulatory SNPs in experimentally-verified NRF2 binding AREs
To test the feasibility of the binding model on finding functional regulatory SNPs, experimentally verified NRF2 binding AREs reported in the literature (9) were searched for genetic variations using 1000 Genomes Project online tool ‘Region Report’ (http://browser.1000genomes.org/Homo_sapiens/UserData/). The analysis identified a SNP (rs113067944) on NRF2 binding ARE (6,63–65) residing on FTL (Ferritin, light polypeptide) gene promoter (Figure 9A and B). The FTL gene encodes for a ubiquitous cellular protein called L-ferritin that maintains iron homeostasis (66). The selected SNP itself is rare and has only been observed in one HapMap-CEU individual (heterozygote, male, NA07022), but it nevertheless serves as a very good mechanistic example of the drastic effect a SNP can have on transcription factor binding. Theoretically, as common SNPs explain only a proportion of the genetic background of complex diseases, ‘private SNPs’, like rs113067944, could actually contribute to diseases on an individual level. rs113067944 causes an allelic change from A to C, which according to our prediction causes the ARE to lose its ability to bind NRF2 by changing its predicted binding value from 0.953 to 0.004. Protein binding microarray results for the sequences confirm the prediction results yielding binding affinity of 1.35 for the allele A and 0.002 for allele C (Figure 9C). To study the functional changes in a cellular context, the promoter constructs for allele A and C were cloned into luciferase vectors and studied in HEK-293T cells using an NRF2 inducer (L-SFN) and NRF2 overexpression. Luciferase activity of FTL-ARE-A increased with NRF2 inducer and/or NRF2 overexpression, whereas allelic change from A to C thwarted the inducing effect (Figure 9D) indicating that the allelic change affects also transcriptional activity by decreasing the target gene transcription.
Figure 9.

A SNP in FTL promoter has drastic effects of NRF2 binding and transcriptional activation. (A) A promoter analysis of the FTL gene at chr19 showing the location of experimentally verified NRF2 binding ARE together with dbSNP (v138) and ENCODE ChIP-seq data. ChIP-seq track displays combined MAFF and MAFK binding signals in H1-hESC (MAFK), K562 (MAFF, MAFK), HeLa-S3 (MAFK), HepG (MAFF, MAFK) and IMR90 (MAFK) cell lines. (B) Detailed view showing FTL ARE sequence and the SNP (rs113067944, A→C) position. (C) Protein binding microarray results for FTL.ARE.A and the SNP bearing FTL.ARE.C. Results are calculated as measured binding relative to NQO1.ARE binding (mean ± S.E.M, n = 39.). Scramble oligonucleotides served as negative control. (D) HEK-293T cells were transfected with NQO1-ARE and FTL-ARE bearing either allele A or allele C with and without NRF2 -expressing plasmids. Twenty-four h after transfection cells were treated with NRF2 inducer (L-SFN) for 16 h followed by luciferase activity measurements. An empty pGL3 promoter vector served as control and activities were normalized to β-galactosidase activity. Results are shown relative to control (mean± S.E.M, n = 4).
Future perspectives: catalogue of clinically significant putative NRF2 regulatory SNPs
To facilitate the genome-wide search for SNPs affecting NRF2 binding, explicit 11 nt oligonucleotides measured or predicted to bind NRF2 were mapped against the allelic sequences of 49 065 potentially clinically relevant non-exonic SNPs within dbSNP v137 (NCBI SNP subsets for ‘OMIM’ and ‘Clinical/LSDB Submissions’, and the UCSC GWAS SNP catalogue), and the 180 500 nearby SNPs in LD with them (distance <100 kb, LD R2 > 0.8). This yielded a set of 5800 potential NRF2 rSNPs, out of which 557 were clinically relevant SNPs and 5243 proxy SNPs for the clinically relevant SNPs (Supporting Material: Table S9). Of the SNPs, 1221 had a drastic effect on NRF2 binding according to our measurements or measurement-based prediction. To allow future evaluation of evolutionary aspects of the NRF2 rSNPs, the ancestral alleles, where available, have been included in Supplementary Table S9. The initial set of 5800 rsIDs with at least one match and one non-match allele for the 5253 NRF2 binder sequences was further filtered to SNPs with (i) an allelic match with predicted binding strength >0.6, (ii) difference in predicted binding strength between binder and non-binder alleles >0.5 [or (i) >0.8 and (ii) >0.25], iii) overlap with any ENCODE clustered TF binding or DNase hypersensitive site, and (iv) global minor allele frequency <0.25. This yielded 14 top candidate NRF2 rSNPs that were either direct hits to a ‘Clinical/LSDB Submissions’ SNPs (1 SNP, rs9274490), or proximal to any of the clinically relevant SNPs (13 SNPs) (Table 1). Of note, one of the top 14 candidates (rs34171066) overlaps with a binding site of MAFK in ENCODE ChIP-seq data.
Table 1. Genomic NRF2 rSNPs residing in regulatory elements.
| SNP ID | Sequence | SNP effect | GMAF [Allele] | GWAS SNP | Reported trait | Reported genes |
|---|---|---|---|---|---|---|
| rs16913624 | GTGACTCAGCC | 0.60 | 0.1003 [T] | rs17556665 | Inflammatory biomarkers | SPON1 |
| rs2454138 | GTGAGTCATCG | 0.54 | 0.1827 [A] | rs477515 | Epstein_Barr virus immune response (EBNA-1), Hepatitis B vaccine response, Inflammatory bowel disease | HLA-DQA1, HLA-DRA, BTNL2, HLA-DRB1, C6orf10, PSORS1C1, BAT2, EHMT2, HLA-DQB1, C6orf15, BAT4, NOTCH4, PRRT1, HLA-B |
| rs3026775 | GTGAATAAGCA | 0.56 | 0.0339 [A] | rs3026785 | Hirschcprung disease, protection against | RET51 |
| rs34171066 | CTGACTCAGCA | 0.76 | 0.0659 [C] | rs17638544 | Bone mineral density | TNFSF11 |
| rs34608229 | ATGACACAGCA | 0.62 | 0.1268 [C] | rs13273123 | rs7833986 | Height | Height | PLAG1 | PLAG1 |
| rs4545169 | ATGACTAAGCA | 0.83 | 0.1786 [G] | rs7851696 | Autoimmune and infectious diseases | FCN2 |
| rs4798979 | GTGACTCAGCT | 0.62 | 0.2074 [A] | rs12967884 | Subcutaneous adipose tissue | SALL3 |
| rs62052186 | GTGACACAGCA | 0.72 | 0.0893 [T] | rs2228479 | Skin/hair/eye pigmentation 2, red hair/fair skin | MC1R |
| rs62096279 | ATGATACAGCA | 0.69 | 0.2060 [T] | rs12456021 | Multiple sclerosis | ALPK2 |
| rs6448280 | ATGACTAATCA | 0.64 | 0.0614 [A] | rs6841898 | Myopia (pathological) | DHX15 |
| rs71565194 | ATGATGCAGCA | 0.73 | 0.0041 [T] | rs1403155 | Immune response to smallpox (secreted IL-2) | AUTS2 |
| rs76845667 | GTGACTCAGCT | 0.63 | 0.2115 [T] | rs7294919 | Brain structure, Hippocampal volume, Subcortical brain region volumes | HRK, FBXW8 |
| rs8027358 | ATGATTCAGCA | 0.77 | 0.1392 [C] | rs8030136 | Periodontitis (DPAL) | SNRPN |
| rs9274490 | GTGAGGCAGCA | 0.59 | 0.1699 [G] | NA | HLA-DQB1 |
Sequence = 11 nt sequence, with the variant nt as the central, 6th nt, of the strongest binding allele.
SNP effect = Difference between predicted relative binding values for the strongest and weakest allele.
GMAF = Global minor allele frequency.
GWAS SNP = A disease or trait-associeted SNP in linkage disequilibrium with the NRF2 rSNP.
DISCUSSION
Binding specificity of a given transcription factor is crucial for proper regulation of its target genes (67). Human genome contains ∼1 million putative enhancer elements through which transcription factors regulate their targets (68), and a considerable proportion of disease-associated genetic variations occurs in these enhancer regions (19) potentially affecting transcription factor binding and predisposing individuals to different diseases and syndromes, such as cancer, neurological disorders and cardiovascular diseases (68). Although knowledge on the genomic transcription factor binding site locations and their sequence-specific binding preferences has increased due to next generation sequencing methods, most of the techniques do not provide precise information on the binding sequences (67). Even ChIP-seq, a technique for determining the in vivo transcription factor binding locations within the genome, only pinpoints a region of 100–300 bp in which a binding site resides, and does not differentiate between direct and indirect binding. Also, as ChIP-seq uses antibodies to capture protein–DNA interactions, it is prone to technical errors due to non-specific binding or low sensitivity of the antibody. Motif discovery algorithms can be used to identify the main features of the binding patterns and to resolve the highest affinity sequences but the accuracy on the lower affinity sites is often poor due to technical limitations (67). In this study we have investigated the binding specificity of NRF2 and created a detailed binding model for this transcription factor to allow a more refined stratification of binding strength.
Understanding the intrinsic specificity of the transcription factor binding and combining this knowledge with in vivo binding patterns lays a foundation for studying the disease-associated genetic variation occurring in enhancer regions. To gain this knowledge, either the binding to all potential binding sequences has to be studied or the binding to sufficient amount of sequences for building a model that allows the estimation of the complete set (67). In our study, publicly available NRF2 ChIP-seq data was utilized to reduce the number of binding measurements required for constructing the NRF2 binding model. The confidence on the model was further increased with subsequent additional binding measurements and the correlations between the measured and predicted binding values of the model were found high. Although structurally a wide variety of interactions form between the protein and DNA, hydrogen bonds formed between double helix grooves and surface amino acids of the transcription factor are considered as the most important ones making simple recognition models applicable (50). Most mutations affect hydrogen bond networks locally and, thus, their effects are also mostly local. A simple recognition mechanism translates into simple transcription factor binding specificity model and to easily predictable variation effects which can be utilized in finding functional regulatory SNPs and in estimating the SNP effect (50).
Accurate prediction of functional AREs in a given cell type requires knowledge on the chromatin landscape. Open chromatin is readily accessible to TFs, and most TF binding events correlate with open and active chromatin states, whereas closed chromatin is found on regions of the genome that are fully silenced by nucleosome modifications and DNA methylations (68,69). Closed chromatin is densely packed, which effectively blocks TF binding and transcriptional activity. Poised chromatin, on the other hand, comprises both activating and repressing histone modifications at the same location (70) and the genes on poised chromatin are repressed but poised for rapid activation. Chromatin states and regulatory regions vary significantly in activity levels across cell types, and the differences relate to cell-type specific gene functions (20,22). Enhancers of key genes that control and define cell identity are called super-enhancers (22). Recent studies have shown that disease-associated SNPs tend to occur in super-enhancers of disease-relevant cells more frequently than in typical enhancers suggesting that altered expression of cell identity genes predisposes to diseases (22). Although evolutionary conservation is a much used approach for the identification of regulatory regions, the mechanism leading to intra- and cross-species differences in gene expression often works through changes in transcription factor binding sites leading to lineage-specific regulatory regions that are conserved functionally but not on sequence level (11) hence supporting the use of alternative approaches such as identification of the cell-type-specific super-enhancers to find putative causal variants for further studies in cellular context. Super-enhancer can be identified from histone H3K27ac ChIP-seq data, and a catalogue of super-enhancers for 86 human cell and tissue samples is available (22).
The data presented here is the first step towards a model that allows prediction of NRF2-regulated gene expression based on regulatory genetic code. Flexible sequence models that explain subtle changes in binding are prerequisite for understanding cell-dependent sequence preferences that may be important in cell-type-specific binding in addition to chromatin accessibility (69). In gene regulation, multiple weak AREs can be equally effective as one or two strong ones, and it has been suggested that evolution might favour these complex sites over simple ones, simply because they are more abundant in the genome (71). Therefore it is also important to device methods to identify the weak binding sites reliably.
In conclusion, we have investigated the NRF2 binding preferences in order to construct a model for linking the disease-associated genomic loci and regulatory SNPs with molecular mechanisms leading to diseases and syndromes. Genomic variation within ARE sequences can greatly alter the NRF2 binding and thus potentially affect NRF2-dependent gene regulation and susceptibility to diseases in which increased oxidative or electrophilic stress plays a role.
Supplementary Material
Acknowledgments
We thank Eero Mella-Aho for cloning of MafF vector and CSC–Scientific Computing, Ltd for software licenses and computational resources.
SUPPLEMENTARY DATA
Supplementary Data are available at NAR Online.
FUNDING
Aarne Koskelo Foundation (to S.M.K.); Aleksanteri Mikkonen Foundation (to S.M.K.); Antti and Tyyne Soininen Foundation (to S.M.K.); Doctoral Program in Molecular Medicine (to S.M.K.); Emil Aaltonen Foundation (to S.M.K.); Finnish Cultural Foundation, North Savo Regional Fund (to S.M.K.); Ida Montin Foundation (to S.M.K.); Biocenter Finland/DDCB (to T.L.); Sigrid Juselius Foundation (to A.L.L.); Jane and Aatos Erkko Foundation (to A.L.L.); Academy of Finland (Grant number 275147, to A.L.L.). Funding for open access charge: Academy of Finland.
Conflict of interest statement. None declared.
REFERENCES
- 1.Jolma A., Kivioja T., Toivonen J., Cheng L., Wei G., Enge M., Taipale M., Vaquerizas J.M., Yan J., Sillanpää M.J., et al. Multiplexed massively parallel SELEX for characterization of human transcription factor binding specificities. Genome Res. 2010;20:861–873. doi: 10.1101/gr.100552.109. [DOI] [PMC free article] [PubMed] [Google Scholar]
- 2.Hayes J.D., Dinkova-Kostova A.T. The Nrf2 regulatory network provides an interface between redox and intermediary metabolism. Trends Biochem. Sci. 2014;39:199–218. doi: 10.1016/j.tibs.2014.02.002. [DOI] [PubMed] [Google Scholar]
- 3.Ma Q. Role of nrf2 in oxidative stress and toxicity. Annu. Rev. Pharmacol. Toxicol. 2013;53:401–426. doi: 10.1146/annurev-pharmtox-011112-140320. [DOI] [PMC free article] [PubMed] [Google Scholar]
- 4.Cho H.-Y. Genomic structure and variation of nuclear factor (erythroid-derived 2)-like 2. Oxid. Med. Cell. Longev. 2013:286524. doi: 10.1155/2013/286524. [DOI] [PMC free article] [PubMed] [Google Scholar]
- 5.Rushmore T., Morton M., Pickett C. The antioxidant responsive element. Activation by oxidative stress and identification of the DNA consensus sequence required for functional activity. J. Biol. Chem. 1991;266:11632–11639. [PubMed] [Google Scholar]
- 6.Wasserman W.W., Fahl W.E. Functional antioxidant responsive elements. Proc. Natl. Acad. Sci. U.S.A. 1997;94:5361–5366. doi: 10.1073/pnas.94.10.5361. [DOI] [PMC free article] [PubMed] [Google Scholar]
- 7.Erickson A.M., Nevarea Z., Gipp J.J., Mulcahy R.T. Identification of a variant antioxidant response element in the promoter of the human glutamate-cysteine ligase modifier subunit gene. Revision of the ARE consensus sequence. J. Biol. Chem. 2002;277:30730–30737. doi: 10.1074/jbc.M205225200. [DOI] [PubMed] [Google Scholar]
- 8.Nioi P., McMahon M., Itoh K., Yamamoto M., Hayes J.D. Identification of a novel Nrf2-regulated antioxidant response element (ARE) in the mouse NAD(P)H:quinone oxidoreductase 1 gene: reassessment of the ARE consensus sequence. Biochem. J. 2003;374:337–348. doi: 10.1042/BJ20030754. [DOI] [PMC free article] [PubMed] [Google Scholar]
- 9.Wang X., Tomso D.J., Chorley B.N., Cho H.-Y., Cheung V.G., Kleeberger S.R., Bell D.A. Identification of polymorphic antioxidant response elements in the human genome. Hum. Mol. Genet. 2007;16:1188–1200. doi: 10.1093/hmg/ddm066. [DOI] [PMC free article] [PubMed] [Google Scholar]
- 10.Hindorff L.A., Sethupathy P., Junkins H.A., Ramos E.M., Mehta J.P., Collins F.S., Manolio T.A. Potential etiologic and functional implications of genome-wide association loci for human diseases and traits. Proc. Natl. Acad. Sci. U.S.A. 2009;106:9362–9367. doi: 10.1073/pnas.0903103106. [DOI] [PMC free article] [PubMed] [Google Scholar]
- 11.Claussnitzer M., Dankel S.N., Klocke B., Grallert H., Glunk V., Berulava T., Lee H., Oskolkov N., Fadista J., Ehlers K., et al. Leveraging cross-species transcription factor binding site patterns: from diabetes risk loci to disease mechanisms. Cell. 2014;156:343–358. doi: 10.1016/j.cell.2013.10.058. [DOI] [PMC free article] [PubMed] [Google Scholar]
- 12.Califano A., Butte A.J., Friend S., Ideker T., Schadt E. Leveraging models of cell regulation and GWAS data in integrative network-based association studies. Nat. Genet. 2012;44:841–847. doi: 10.1038/ng.2355. [DOI] [PMC free article] [PubMed] [Google Scholar]
- 13.Westra H.-J., Franke L. From genome to function by studying eQTLs. Biochim. Biophys. Acta. 2014;1842:1896–11902. doi: 10.1016/j.bbadis.2014.04.024. [DOI] [PubMed] [Google Scholar]
- 14.Yang J., Benyamin B., McEvoy B.P., Gordon S., Henders A.K., Nyholt D.R., Madden P.A., Heath A.C., Martin N.G., Montgomery G.W., et al. Common SNPs explain a large proportion of the heritability for human height. Nat. Genet. 2010;42:565–569. doi: 10.1038/ng.608. [DOI] [PMC free article] [PubMed] [Google Scholar]
- 15.Bernstein B.E., Birney E., Dunham I., Green E.D., Gunter C., Snyder M. An integrated encyclopedia of DNA elements in the human genome. Nature. 2012;489:57–74. doi: 10.1038/nature11247. [DOI] [PMC free article] [PubMed] [Google Scholar]
- 16.Zhang X., Bailey S.D., Lupien M. Laying a solid foundation for Manhattan–'setting the functional basis for the post-GWAS era’. Trends Genet. 2014;30:140–149. doi: 10.1016/j.tig.2014.02.006. [DOI] [PMC free article] [PubMed] [Google Scholar]
- 17.Nica A.C., Montgomery S.B., Dimas A.S., Stranger B.E., Beazley C., Barroso I., Dermitzakis E.T. Candidate causal regulatory effects by integration of expression QTLs with complex trait genetic associations. PLoS Genet. 2010;6:e1000895. doi: 10.1371/journal.pgen.1000895. [DOI] [PMC free article] [PubMed] [Google Scholar]
- 18.Schaub M.A., Boyle A.P., Kundaje A., Batzoglou S., Snyder M. Linking disease associations with regulatory information in the human genome. Genome Res. 2012;22:1748–1759. doi: 10.1101/gr.136127.111. [DOI] [PMC free article] [PubMed] [Google Scholar]
- 19.Maurano M.T., Humbert R., Rynes E., Thurman R.E., Haugen E., Wang H., Reynolds A.P., Sandstrom R., Qu H., Brody J., et al. Systematic localization of common disease-associated variation in regulatory DNA. Science. 2012;337:1190–1195. doi: 10.1126/science.1222794. [DOI] [PMC free article] [PubMed] [Google Scholar]
- 20.Ernst J., Kheradpour P., Mikkelsen T.S., Shoresh N., Ward L.D., Epstein C.B., Zhang X., Wang L., Issner R., Coyne M., et al. Mapping and analysis of chromatin state dynamics in nine human cell types. Nature. 2011;473:43–49. doi: 10.1038/nature09906. [DOI] [PMC free article] [PubMed] [Google Scholar]
- 21.Cowper-Sal lari R., Zhang X., Wright J.B., Bailey S.D., Cole M.D., Eeckhoute J., Moore J.H., Lupien M. Breast cancer risk-associated SNPs modulate the affinity of chromatin for FOXA1 and alter gene expression. Nat. Genet. 2012;44:1191–1198. doi: 10.1038/ng.2416. [DOI] [PMC free article] [PubMed] [Google Scholar]
- 22.Hnisz D., Abraham B.J., Lee T.I., Lau A., Saint-André V., Sigova A.A., Hoke H.A., Young R.A. Super-enhancers in the control of cell identity and disease. Cell. 2013;155:934–947. doi: 10.1016/j.cell.2013.09.053. [DOI] [PMC free article] [PubMed] [Google Scholar]
- 23.Parker S.C.J., Stitzel M.L., Taylor D.L., Orozco J.M., Erdos M.R., Akiyama J.A., van Bueren K.L., Chines P.S., Narisu N., Black B.L., et al. Chromatin stretch enhancer states drive cell-specific gene regulation and harbor human disease risk variants. Proc. Natl. Acad. Sci. U.S.A. 2013;110:17921–17926. doi: 10.1073/pnas.1317023110. [DOI] [PMC free article] [PubMed] [Google Scholar]
- 24.Degner J.F., Pai A.A., Pique-Regi R., Veyrieras J.-B., Gaffney D.J., Pickrell J.K., De Leon S., Michelini K., Lewellen N., Crawford G.E., et al. DNase I sensitivity QTLs are a major determinant of human expression variation. Nature. 2012;482:390–394. doi: 10.1038/nature10808. [DOI] [PMC free article] [PubMed] [Google Scholar]
- 25.Kasowski M., Grubert F., Heffelfinger C., Hariharan M., Asabere A., Waszak S.M., Habegger L., Rozowsky J., Shi M., Urban A.E., et al. Variation in transcription factor binding among humans. Science. 2010;328:232–235. doi: 10.1126/science.1183621. [DOI] [PMC free article] [PubMed] [Google Scholar]
- 26.McDaniell R., Lee B.-K., Song L., Liu Z., Boyle A.P., Erdos M.R., Scott L.J., Morken M.A., Kucera K.S., Battenhouse A., et al. Heritable individual-specific and allele-specific chromatin signatures in humans. Science. 2010;328:235–239. doi: 10.1126/science.1184655. [DOI] [PMC free article] [PubMed] [Google Scholar]
- 27.Reddy T.E., Gertz J., Pauli F., Kucera K.S., Varley K.E., Newberry K.M., Marinov G.K., Mortazavi A., Williams B.A., Song L., et al. Effects of sequence variation on differential allelic transcription factor occupancy and gene expression. Genome Res. 2012;22:860–869. doi: 10.1101/gr.131201.111. [DOI] [PMC free article] [PubMed] [Google Scholar]
- 28.Kurokawa H., Motohashi H., Sueno S., Kimura M., Takagawa H., Kanno Y., Yamamoto M., Tanaka T. Structural basis of alternative DNA recognition by Maf transcription factors. Mol. Cell. Biol. 2009;29:6232–6244. doi: 10.1128/MCB.00708-09. [DOI] [PMC free article] [PubMed] [Google Scholar]
- 29.Case D.A., Babin V., Berryman J.T., Betz R.M., Cai Q, Cerutti D.S., Cheatham III, T.E., Darden T.A., Duke R.E., Gohlke H., et al. AMBER 14. San Francisco: University of California; 2014. [Google Scholar]
- 30.Duan Y., Wu C., Chowdhury S., Lee M.C., Xiong G., Zhang W., Yang R., Cieplak P., Luo R., Lee T., et al. A point-charge force field for molecular mechanics simulations of proteins based on condensed-phase quantum mechanical calculations. J. Comput. Chem. 2003;24:1999–2012. doi: 10.1002/jcc.10349. [DOI] [PubMed] [Google Scholar]
- 31.Roe D.R., Cheatham T.E. PTRAJ and CPPTRAJ: Software for Processing and Analysis of Molecular Dynamics Trajectory Data. J. Chem. Theory Comput. 2013;9:3084–3095. doi: 10.1021/ct400341p. [DOI] [PubMed] [Google Scholar]
- 32.Chorley B.N., Campbell M.R., Wang X., Karaca M., Sambandan D., Bangura F., Xue P., Pi J., Kleeberger S.R., Bell D.A. Identification of novel NRF2-regulated genes by ChIP-Seq: influence on retinoid X receptor alpha. Nucleic Acids Res. 2012;40:7416–7429. doi: 10.1093/nar/gks409. [DOI] [PMC free article] [PubMed] [Google Scholar]
- 33.Valouev A., Johnson D.S., Sundquist A., Medina C., Anton E., Batzoglou S., Myers R.M., Sidow A. Genome-wide analysis of transcription factor binding sites based on ChIP-Seq data. Nat. Methods. 2008;5:829–834. doi: 10.1038/nmeth.1246. [DOI] [PMC free article] [PubMed] [Google Scholar]
- 34.Machanick P., Bailey T.L. MEME-ChIP: motif analysis of large DNA datasets. Bioinformatics. 2011;27:1696–1697. doi: 10.1093/bioinformatics/btr189. [DOI] [PMC free article] [PubMed] [Google Scholar]
- 35.Quinlan A.R., Hall I.M. BEDTools: a flexible suite of utilities for comparing genomic features. Bioinformatics. 2010;26:841–842. doi: 10.1093/bioinformatics/btq033. [DOI] [PMC free article] [PubMed] [Google Scholar]
- 36.Jyrkkänen H.-K., Kuosmanen S., Heinäniemi M., Laitinen H., Kansanen E., Mella-Aho E., Leinonen H., Ylä-Herttuala S., Levonen A.-L. Novel insights into the regulation of antioxidant-response-element-mediated gene expression by electrophiles: induction of the transcriptional repressor BACH1 by Nrf2. Biochem. J. 2011;440:167–174. doi: 10.1042/BJ20110526. [DOI] [PubMed] [Google Scholar]
- 37.Viitala S.M., Jääskeläinen A.J., Kelo E., Sirola H., Moilanen K., Suni J., Vaheri A., Vapalahti O., Närvänen A. Surface-activated microtiter-plate microarray for simultaneous CRP quantification and viral antibody detection. Diagn. Microbiol. Infect. Dis. 2013;75:174–179. doi: 10.1016/j.diagmicrobio.2012.10.014. [DOI] [PubMed] [Google Scholar]
- 38.Jyrkkanen H.-K., Kansanen E., Inkala M., Kivela A.M., Hurttila H., Heinonen S.E., Goldsteins G., Jauhiainen S., Tiainen S., Makkonen H., et al. Nrf2 regulates antioxidant gene expression evoked by oxidized phospholipids in endothelial cells and murine arteries in vivo. Circ. Res. 2008;103:e1–e9. doi: 10.1161/CIRCRESAHA.108.176883. [DOI] [PubMed] [Google Scholar]
- 39.Levonen A.L., Dickinson D.A., Moellering D.R., Mulcahy R.T., Forman H.J., Darley-Usmar V.M. Biphasic effects of 15-deoxy-delta(12, 14)-prostaglandin J(2) on glutathione induction and apoptosis in human endothelial cells. Arterioscler. Thromb. Vasc. Biol. 2001;21:1846–1851. doi: 10.1161/hq1101.098488. [DOI] [PubMed] [Google Scholar]
- 40.Leinonen H.M., Ruotsalainen A.-K., Määttä A.-M., Laitinen H.M., Kuosmanen S.M., Kansanen E., Pikkarainen J.T., Lappalainen J.P., Samaranayake H., Lesch H.P., et al. Oxidative stress-regulated lentiviral TK/GCV gene therapy for lung cancer treatment. Cancer Res. 2012;72:6227–6235. doi: 10.1158/0008-5472.CAN-12-1166. [DOI] [PubMed] [Google Scholar]
- 41.Hurttila H., Koponen J.K., Kansanen E., Jyrkkänen H.-K., Kivelä A., Kylätie R., Ylä-Herttuala S., Levonen A.-L. Oxidative stress-inducible lentiviral vectors for gene therapy. Gene Ther. 2008;15:1271–1279. doi: 10.1038/gt.2008.75. [DOI] [PubMed] [Google Scholar]
- 42.Wild A.C., Moinova H.R., Mulcahy R.T. Regulation of -glutamylcysteine synthetase subunit gene expression by the transcription factor Nrf2. J. Biol. Chem. 1999;274:33627–33636. doi: 10.1074/jbc.274.47.33627. [DOI] [PubMed] [Google Scholar]
- 43.Kimura M., Yamamoto T., Zhang J., Itoh K., Kyo M., Kamiya T., Aburatani H., Katsuoka F., Kurokawa H., Tanaka T., et al. Molecular basis distinguishing the DNA binding profile of Nrf2-Maf heterodimer from that of Maf homodimer. J. Biol. Chem. 2007;282:33681–33690. doi: 10.1074/jbc.M706863200. [DOI] [PubMed] [Google Scholar]
- 44.Itoh K., Chiba T., Takahashi S., Ishii T., Igarashi K., Katoh Y., Oyake T., Hayashi N., Satoh K., Hatayama I., et al. An Nrf2/small Maf heterodimer mediates the induction of phase II detoxifying enzyme genes through antioxidant response elements. Biochem. Biophys. Res. Commun. 1997;236:313–322. doi: 10.1006/bbrc.1997.6943. [DOI] [PubMed] [Google Scholar]
- 45.Toki T., Itoh J., Kitazawa J., Arai K., Hatakeyama K., Akasaka J., Igarashi K., Nomura N., Yokoyama M., Yamamoto M., et al. Human small Maf proteins form heterodimers with CNC family transcription factors and recognize the NF-E2 motif. Oncogene. 1997;14:1901–1910. doi: 10.1038/sj.onc.1201024. [DOI] [PubMed] [Google Scholar]
- 46.Yamamoto T., Kyo M., Kamiya T., Tanaka T., Engel J.D., Motohashi H., Yamamoto M. Predictive base substitution rules that determine the binding and transcriptional specificity of Maf recognition elements. Genes Cells. 2006;11:575–591. doi: 10.1111/j.1365-2443.2006.00965.x. [DOI] [PubMed] [Google Scholar]
- 47.Jolma A., Yan J., Whitington T., Toivonen J., Nitta K.R., Rastas P., Morgunova E., Enge M., Taipale M., Wei G., et al. DNA-binding specificities of human transcription factors. Cell. 2013;152:327–339. doi: 10.1016/j.cell.2012.12.009. [DOI] [PubMed] [Google Scholar]
- 48.Hirotsu Y., Katsuoka F., Funayama R., Nagashima T., Nishida Y., Nakayama K., Engel J.D., Yamamoto M. Nrf2-MafG heterodimers contribute globally to antioxidant and metabolic networks. Nucleic Acids Res. 2012;40:10228–10239. doi: 10.1093/nar/gks827. [DOI] [PMC free article] [PubMed] [Google Scholar]
- 49.Stormo G.D. DNA binding sites: representation and discovery. Bioinformatics. 2000;16:16–23. doi: 10.1093/bioinformatics/16.1.16. [DOI] [PubMed] [Google Scholar]
- 50.Zhao Y., Stormo G.D. Quantitative analysis demonstrates most transcription factors require only simple models of specificity. Nat. Biotechnol. 2011;29:480–483. doi: 10.1038/nbt.1893. [DOI] [PMC free article] [PubMed] [Google Scholar]
- 51.Zhao Y., Ruan S., Pandey M., Stormo G.D. Improved models for transcription factor binding site identification using nonindependent interactions. Genetics. 2012;191:781–790. doi: 10.1534/genetics.112.138685. [DOI] [PMC free article] [PubMed] [Google Scholar]
- 52.Zhou T., Shen N., Yang L., Abe N., Horton J., Mann R.S., Bussemaker H.J., Gordân R., Rohs R. Quantitative modeling of transcription factor binding specificities using DNA shape. Proc. Natl. Acad. Sci. U.S.A. 2015;112:4654–4659. doi: 10.1073/pnas.1422023112. [DOI] [PMC free article] [PubMed] [Google Scholar]
- 53.Hausser J., Zavolan M. Identification and consequences of miRNA-target interactions—beyond repression of gene expression. Nat. Rev. Genet. 2014;15:599–612. doi: 10.1038/nrg3765. [DOI] [PubMed] [Google Scholar]
- 54.Thum T., Condorelli G. Long noncoding RNAs and microRNAs in cardiovascular pathophysiology. Circ. Res. 2015;116:751–762. doi: 10.1161/CIRCRESAHA.116.303549. [DOI] [PubMed] [Google Scholar]
- 55.Voellenkle C., van Rooij J., Guffanti A., Brini E., Fasanaro P., Isaia E., Croft L., David M., Capogrossi M.C., Moles A., et al. Deep-sequencing of endothelial cells exposed to hypoxia reveals the complexity of known and novel microRNAs. RNA. 2012;18:472–484. doi: 10.1261/rna.027615.111. [DOI] [PMC free article] [PubMed] [Google Scholar]
- 56.Schober A., Nazari-Jahantigh M., Weber C. MicroRNA-mediated mechanisms of the cellular stress response in atherosclerosis. Nat. Rev. Cardiol. 2015;12:361–374. doi: 10.1038/nrcardio.2015.38. [DOI] [PubMed] [Google Scholar]
- 57.Schober A., Nazari-Jahantigh M., Wei Y., Bidzhekov K., Gremse F., Grommes J., Megens R.T.A., Heyll K., Noels H., Hristov M., et al. MicroRNA-126–5p promotes endothelial proliferation and limits atherosclerosis by suppressing Dlk1. Nat. Med. 2014;20:368–376. doi: 10.1038/nm.3487. [DOI] [PMC free article] [PubMed] [Google Scholar]
- 58.Zernecke A., Bidzhekov K., Noels H., Shagdarsuren E., Gan L., Denecke B., Hristov M., Köppel T., Jahantigh M.N., Lutgens E., et al. Delivery of microRNA-126 by apoptotic bodies induces CXCL12-dependent vascular protection. Sci. Signal. 2009;2:ra81. doi: 10.1126/scisignal.2000610. [DOI] [PubMed] [Google Scholar]
- 59.Jansen F., Yang X., Hoelscher M., Cattelan A., Schmitz T., Proebsting S., Wenzel D., Vosen S., Franklin B.S., Fleischmann B.K., et al. Endothelial microparticle-mediated transfer of MicroRNA-126 promotes vascular endothelial cell repair via SPRED1 and is abrogated in glucose-damaged endothelial microparticles. Circulation. 2013;128:2026–2038. doi: 10.1161/CIRCULATIONAHA.113.001720. [DOI] [PubMed] [Google Scholar]
- 60.Atkins G.B., Jain M.K. Role of Krüppel-like transcription factors in endothelial biology. Circ. Res. 2007;100:1686–1695. doi: 10.1161/01.RES.0000267856.00713.0a. [DOI] [PubMed] [Google Scholar]
- 61.Zakkar M., Van der Heiden K., Luong L.A., Chaudhury H., Cuhlmann S., Hamdulay S.S., Krams R., Edirisinghe I., Rahman I., Carlsen H., et al. Activation of Nrf2 in endothelial cells protects arteries from exhibiting a proinflammatory state. Arterioscler. Thromb. Vasc. Biol. 2009;29:1851–1857. doi: 10.1161/ATVBAHA.109.193375. [DOI] [PubMed] [Google Scholar]
- 62.Fledderus J.O., Boon R.A., Volger O.L., Hurttila H., Ylä-Herttuala S., Pannekoek H., Levonen A.-L., Horrevoets A.J.G. KLF2 primes the antioxidant transcription factor Nrf2 for activation in endothelial cells. Arterioscler. Thromb. Vasc. Biol. 2008;28:1339–1346. doi: 10.1161/ATVBAHA.108.165811. [DOI] [PubMed] [Google Scholar]
- 63.Campbell M.R., Karaca M., Adamski K.N., Chorley B.N., Wang X., Bell D.A. Novel hematopoietic target genes in the NRF2-mediated transcriptional pathway. Oxid. Med. Cell. Longev. 2013:120305. doi: 10.1155/2013/120305. [DOI] [PMC free article] [PubMed] [Google Scholar]
- 64.Kansanen E., Jyrkkänen H.-K., Volger O.L., Leinonen H., Kivelä A.M., Häkkinen S.-K., Woodcock S.R., Schopfer F.J., Horrevoets A.J., Ylä-Herttuala S., et al. Nrf2-dependent and -independent responses to nitro-fatty acids in human endothelial cells: identification of heat shock response as the major pathway activated by nitro-oleic acid. J. Biol. Chem. 2009;284:33233–33241. doi: 10.1074/jbc.M109.064873. [DOI] [PMC free article] [PubMed] [Google Scholar]
- 65.Agyeman A.S., Chaerkady R., Shaw P.G., Davidson N.E., Visvanathan K., Pandey A., Kensler T.W. Transcriptomic and proteomic profiling of KEAP1 disrupted and sulforaphane-treated human breast epithelial cells reveals common expression profiles. Breast Cancer Res. Treat. 2012;132:175–187. doi: 10.1007/s10549-011-1536-9. [DOI] [PMC free article] [PubMed] [Google Scholar]
- 66.Hintze K.J., Theil E.C. DNA and mRNA elements with complementary responses to hemin, antioxidant inducers, and iron control ferritin-L expression. Proc. Natl. Acad. Sci. U.S.A. 2005;102:15048–15052. doi: 10.1073/pnas.0505148102. [DOI] [PMC free article] [PubMed] [Google Scholar]
- 67.Stormo G.D., Zhao Y. Determining the specificity of protein-DNA interactions. Nat. Rev. Genet. 2010;11:751–760. doi: 10.1038/nrg2845. [DOI] [PubMed] [Google Scholar]
- 68.Lee T.I., Young R.A. Transcriptional regulation and its misregulation in disease. Cell. 2013;152:1237–1251. doi: 10.1016/j.cell.2013.02.014. [DOI] [PMC free article] [PubMed] [Google Scholar]
- 69.Guertin M.J., Lis J.T. Mechanisms by which transcription factors gain access to target sequence elements in chromatin. Curr. Opin. Genet. Dev. 2013;23:116–123. doi: 10.1016/j.gde.2012.11.008. [DOI] [PMC free article] [PubMed] [Google Scholar]
- 70.Voigt P., Tee W.-W., Reinberg D. A double take on bivalent promoters. Genes Dev. 2013;27:1318–1338. doi: 10.1101/gad.219626.113. [DOI] [PMC free article] [PubMed] [Google Scholar]
- 71.He X., Duque T.S.P.C., Sinha S. Evolutionary origins of transcription factor binding site clusters. Mol. Biol. Evol. 2012;29:1059–1070. doi: 10.1093/molbev/msr277. [DOI] [PMC free article] [PubMed] [Google Scholar]
Associated Data
This section collects any data citations, data availability statements, or supplementary materials included in this article.