

Abstract
Background
Considerable interest exists in the identification of genetic modifiers of disease severity in the long-QT syndrome (LQTS) as their identification may contribute to refinement of risk stratification.
Methods and Results
We searched for single-nucleotide polymorphisms (SNPs) that modulate the corrected QT (QTc)-interval and the occurrence of cardiac events in 639 patients harboring different mutations in KCNH2. We analyzed 1201 SNPs in and around 18 candidate genes, and in another approach investigated 22 independent SNPs previously identified as modulators of QTc-interval in genome-wide association studies in the general population. In an analysis for quantitative effects on the QTc-interval, 3 independent SNPs at NOS1AP (rs10494366, P=9.5×10⁻⁸; rs12143842, P=4.8×10⁻⁷; and rs2880058, P=8.6×10⁻⁷) were strongly associated with the QTc-interval with marked effects (>12 ms/allele). Analysis of patients versus general population controls uncovered enrichment of QTc-prolonging alleles in patients for 2 SNPs, located respectively at NOS1AP (rs12029454; odds ratio, 1.85; 95% confidence interval, 1.32–2.59; P=3×10⁻⁴) and KCNQ1 (rs12576239; odds ratio, 1.84; 95% confidence interval, 1.31–2.60; P=5×10⁻⁴). An analysis of the cumulative effect of the 6 NOS1AP SNPs by means of a multilocus genetic risk score (GRSNOS1AP) uncovered a strong linear relationship between GRSNOS1AP and the QTc-interval (P=4.2×10⁻⁷). Furthermore, patients with a GRSNOS1AP in the lowest quartile had a lower relative risk of cardiac events compared with patients in the other quartiles combined (P=0.039).
Conclusions
We uncovered unexpectedly large effects of NOS1AP SNPs on the QTc-interval and a trend for effects on risk of cardiac events. For the first time, we linked common genetic variation at KCNQ1 with risk of long-QT syndrome.
Keywords: arrhythmias, cardiac, ion channels, long-QT syndrome
The congenital long-QT syndrome (LQTS) is a heritable disorder associated with corrected QT (QTc)-interval prolongation on the ECG and an increased risk of sudden cardiac death from torsade de pointes polymorphic ventricular tachycardia. Mutations in multiple genes, primarily encoding ion channel subunits have been identified in patients with the disorder. In ≈75% of cases, the disease is caused by the inheritance of a mutation in either KCNQ1 (LQT1), KCNH2 (LQT2), or SCN5A (LQT3).1
Despite previous achievements in gene discovery, important issues in the clinical management of patients with LQTS remain. As for most Mendelian disorders, patient management is complicated by the variability in disease severity among mutation carriers.2 Variability is observed both in the extent of the QTc-interval prolongation as well as in the occurrence of arrhythmic events. Although some mutation carriers display a severely prolonged QTc-interval, the QTc-interval of others may be within the normal range. Similarly, not all patients suffer arrhythmic events. Established modulators of disease severity include sex, age, heart rate, intake of QTc-prolonging drugs, and affected gene and mutation location.3–6 Furthermore, in ≈10% of cases, clinical disease severity can be explained by compound heterozygosity.7 However, although additional genetic factors are also expected to play a role, these are largely unexplored.8–10
We here investigated the role of common genetic variants (minor allele frequency >10%) in the form of single-nucleotide polymorphisms (SNPs) in patients with LQT2. In the first approach, we conducted a comprehensive analysis of haplotype-tagging SNPs in 18 candidate genes. In a second approach we investigated the effect of SNPs that have been associated with the QTc-interval through genome-wide association studies (GWAS) conducted in the general population over the past years.11–15
Methods
LQT2 Patients
The study population consisted of 639 individuals from 254 families of European descent, all harboring a mutation in KCNH2. Patients carrying >1 mutation in KCNH2 or carrying a second mutation in another LQTS gene were excluded. These subjects were drawn from the LQTS registries of 4 European clinical centers: Amsterdam (The Netherlands), Münster (Germany), Munich (Germany), and Nantes (France). The Medical Ethical Committee at each center approved the study. All subjects or their guardians provided informed consent for genetic and clinical studies. Analyses were conducted in a set of 353 patients (Set 1), a non-overlapping set of 286 patients (Set 2), and in Set 1 and Set 2 combined. Patient Set 1 and Set 2 were drawn a few years apart of each other from the LQTS registries of the same 4 European academic centers. Routine clinical and ECG parameters were acquired at the time of patient enrollment in each of the registries (see QTc-interval measurement in the Data Supplement). A first cardiac event was defined as a first unexplained syncope, a first documented ventricular tachycardia, or a first aborted cardiac arrest. The observation period for cardiac events started at birth and lasted either to the initiation of antiadrenergic therapy (β-blockers) or the date of the last medical visit (without antiadrenergic therapy).
Selection of SNPs and Genotyping
Candidate Gene SNPs
Eighteen candidate genes (listed in Table I in the Data Supplement) were selected based on their involvement in cardiac arrhythmia syndromes or their role as functionally important subunits of these genes. Because at the time of assay design, the NOS1AP locus was already associated with the QTc-interval in GWAS, this gene was also included in the candidate gene study. SNPs for genotyping were selected from all HapMap SNPs available for the CEU (Northern Europeans from Utah) population within the genes and the 50-kb flanking regions. Tag-SNPs were selected using Tagger16 with the following criteria: pairwise only tagging with r2≥0.8 and a minor allele frequency ≥10%. A total of 1424 SNPs were derived in this way for genotype analysis using an Illumina GoldenGate custom assay (Data Supplement).
The systematic analysis of haplotype-tagging SNPs in the 18 candidate genes was conducted in LQT2 patient Set 1 (n=353). SNPs found to be significantly associated with the QTc-interval in this analysis were subsequently investigated in LQT2 patient Set 2 (n=286).
SNPs From QTc-Interval GWAS
We also investigated SNPs previously associated with the QTc-interval in GWAS conducted in the general population. Twenty-two independent SNPs were identified from the literature.11–15 SNPs were pruned based on their extent of linkage disequilibrium (LD, R2<0.5). SNPs thus selected were genotyped in patient Sets 1 and 2 combined (n=639; Set 1+Set 2) using iPLEX Gold chemistry (Data Supplement).
Calculation of the Genotype Risk Scores
The genotypes from the 22 SNPs from GWAS studies were used to calculate an unweighted multilocus genetic risk score (GRS22). In addition, a GRS based on the 6 NOS1AP SNPs was also generated (GRSNOS1AP). The directionality of the effect of each SNP was based on the original publication.11,12,15,17,18 For each QT-shortening allele, 1 point was subtracted from the score, whereas 1 point was added for each QT-prolonging allele. A negative GRS indicates an excess of QT-shortening alleles, whereas a positive GRS indicates an excess of QT-prolonging alleles.
Statistical Analyses
QTc-interval data were normally distributed (Shapiro–Wilk statistic, W>0.90) and are reported as mean±SD.
Effects of KCNH2 mutation type and location, effects of covariates, and effects of SNPs and the GRS on the QTc-interval were estimated using the linear mixed effect model function (lmekin). The model fit of the GRSNOS1AP was compared with the GRS22 using Akaike's information criterion (AIC). The effect of SNPs and the GRS on the secondary end point age at first cardiac event was estimated using the Cox proportional hazards function (coxme). Both Imekin and coxme are functions from the coxme package in R19 and are correlated random effect models. The models allow for a per-patient random effect that are correlated based on a matrix containing the kinship coefficients for each pair of individuals. This way, dependency between some of the study subjects because of familial relatedness is taken into account. For each SNP–phenotype relationship, an additive genetic model was assumed.
The effects of the SNPs and the GRS on QTc-interval were adjusted for center, sex, age at ECG, proband status, β-blocker use at the time of the ECG, and mutation type and location, whereas the effects of the SNPs on age at first cardiac event were adjusted for center, sex, and mutation type and location only. With respect to mutation type and location, mutations were classified into 5 different classes: (1) nonsense, frameshift (small indels or splice-site mutations), large deletions and insertions, independent of location; (2) missense, N terminal; (3) missense, transmembrane S1 to S4; (4) missense, transmembrane S5-loop-S6; and (5) missense, C terminal. The classes were treated in the models as an unordered factor. The annotation of mutation location was based on the Uniprot database (http://www.uniprot.org/uniprot/Q12809).
For the 22 SNPs from QTc-interval GWAS, we also compared genotype counts between the probands from Set 1 and Set 2 combined (n=278), with those of 498 general population controls drawn from the Genome of the Netherlands (GoNL) project.20 For 20 of the 22 GWAS SNPs investigated, genotypes were available in all 498 GoNL controls. For the remaining 2 SNPs, genotype information was available in 497 (rs4725982) and 472 (rs2074238) individuals, respectively. Genotype counts were compared using logistic regression assuming an additive genetic model (no covariates were included because of lack of access to individual participant data for GoNL).
The SNAP tool (http://www.broadinstitute.org/mpg/snap/) was used to assess LD between SNPs using the CEU reference population. The significance thresholds applied and a statement on statistical power can be found in the Data Supplement.
Results
Study Populations
The characteristics of the patients with LQT2 studied are presented in Table 1. Patient Set 1 was comparable with patient Set 2 and only differed in the occurrence of cardiac events (P=0.039). Considering Sets 1 and 2 together, QTc-intervals differed significantly between probands (479±50 ms) and relatives (460±40 ms, P=8×10⁻⁷). Males and females had similar QTc-intervals (462±44 ms, males; 468±43 ms, females; P=0.06). β-Blocker use at the time of the ECG did not affect the QTc-interval (464±43 in nonusers; 469±49 in users; P=0.32). The relatively low β-blocker use at the time of ECG (≈16%) most likely reflects the fact that the ECGs used in this study were acquired at enrollment.
Table 1.
Characteristics of the Patients With LQT2 Studied
| LQT2 Patient Set 1, n=353 | LQT2 Patient Set 2, n=286 | LQT2 Patient Set 1+Set 2, n=639 | |
|---|---|---|---|
| Female | 208 (59%) | 157 (55%) | 365 (57%) |
| Proband | 86 (24%) | 88 (31%) | 174 (27%) |
| Median (IQR) age at ECG, y | 30 (28) | 27 (31) | 29 (30) |
| β-Blocker use at time of ECG | 60 (17%) | 44 (15%) | 104 (16%) |
| Mean (±SD) QTc-interval, ms | 467±43 | 463±44 | 465±44 |
| Cardiac event | 126 (36%) | 76 (27%) | 202 (32%) |
| Median (IQR) follow-up, y | 26 (30) | 27 (33) | 26 (32) |
IQR indicates interquartile range; LQT2, long-QT 2; and QTc, corrected QT.
Effects of KCNH2 Mutation Type and Location
Because the type and location of the KCNH2 mutation may affect the extent of QTc-interval prolongation,6 we evaluated such effects in the patients in this study. Considering Sets 1 and 2 combined, a total of 197 different KCNH2 mutations were present among the 639 patients who originated from 254 different families. The number of patients per family ranged from 1 to 20. We grouped the nonsense, frameshift (small indels or splice site mutations) and large duplications/deletions as 1 category because these mutation types are all expected to have a drastic effect on the protein structure and likely lead to haploinsufficiency. We detected no difference in extent of QTc-interval prolongation when this category of mutations was compared with missense mutations (P=0.13). We then classified the missense mutations according to the channel subdomain in which they occurred (locations of missense mutations in the channel are represented in Figure I in the Data Supplement); we found that carriers of a missense mutation in the transmembrane nonpore region (S1–S4) had on average a longer QTc-interval compared with individuals carrying a missense mutation in any of the other 3 locations, that is, transmembrane pore region (S5-pore-S6), N terminus, or C terminus (P=2.0×10⁻⁴; Table 2). When 25 patients with S1 to S4 region missense mutations were excluded (8 different mutations), patients with a missense mutation in the pore region (transmembrane S5-loop-S6) displayed a longer QTc-interval compared with patients with a nonpore missense mutation (N or C terminal; P=0.046). Missense mutations were primarily located at the N and C termini and the S5-pore-S6 region (Figure I in the Data Supplement).
Table 2.
Effect of KCNH2 Mutation Type and Location on the QTc-Interval
| Mutation Type and Location | Patient Set 1, n=353 | QTc-Interval (ms) | Patient Set 1+Set 2, n=639 | QTc-Interval (ms) |
|---|---|---|---|---|
| Nonsense, frameshift, large deletions and insertions, all locations | 150 (42%) | 466±40 | 277 (43%) | 463±40 |
| Missense, N terminus | 77 (22%) | 460±49 | 150 (23%) | 458±47 |
| Missense, transmembrane S1–S4 | 11 (3%) | 522±48 | 25 (4%) | 496±55 |
| Missense, transmembrane S5-loop-S6 | 86 (24%) | 474±40 | 132 (20%) | 474±40 |
| Missense, C terminus | 29 (8%) | 455±32 | 55 (9%) | 462±46 |
QTc indicates corrected QT.
Individual SNP Effects
Candidate Gene Study
After quality control, a total of 1201 SNPs across the 18 candidate genes were left for analysis for effects on the QTc-interval as a quantitative variable in the 353 LQT2 patients of Set 1 (all association results are listed in the Data Set file/Table II in the Data Supplement). Three SNPs passed the preset Bonferroni-corrected P value threshold for association of P<4.2×10⁻⁵ (0.05/1201); these included a SNP at the NOS1AP locus (rs16847548), a SNP at KCNH2 (rs956642), and a SNP at CASQ2 (rs1935778; Table 3). The minor allele at both the NOS1AP and CASQ2 loci was associated with a longer QTc-interval, whereas that at KCNH2 was associated with a shorter QTc-interval. The absolute effect sizes per minor allele were >12 ms in all 3 cases.
Table 3.
SNPs From the Candidate Gene Study That Were Associated With the QTc-Interval
| Effect on QTc-Interval in Set 1* (n=353) | Effect on QTc-Interval in Set 2* (n=286) | Effect on QTc-Interval in Set 1+Set 2* (n=639) | |||||||||
|---|---|---|---|---|---|---|---|---|---|---|---|
|
|
|||||||||||
| SNP | Chr | Candidate Gene | Major Allele | Minor Allele | MAF | β±SE (ms) | P Value† | β±SE (ms) | P Value‡ | β±SE (ms) | P Value |
| rs16847548 | 1 | N0S1AP | A | G | 0.255 | 16.9±3.5 | 1.0×10⁻⁶ | 10.1±3.8 | 0.007 | 13.2±2.6 | 4.8×10⁻⁷ |
| rs1935778 | 1 | CASQ2 | A | G | 0.419 | 12.4±2.9 | 2.1×10⁻⁵ | 0.5±3.6 | 0.894 | 7.6±2.4 | 0.001 |
| rs956642 | 7 | KCNH2 | A | G | 0.405 | −14.8±3.1 | 1.3×10⁻⁶ | 0.3±3.7 | 0.942 | −7.1±2.4 | 0.003 |
Chr indicates chromosome; MAF, minor allele frequency; QTc, corrected QT; and SNPs, single-nucleotide polymorphisms.
The coded allele is the minor allele in all cases.
SNPs passing the discovery-phase Bonferroni-corrected P-value threshold (P<4.2×10⁻⁵) are listed.
The P value for the SNP passing the replication-phase Bonferroni-corrected P value threshold (P<0.016) is depicted in bold.
The 3 SNPs that were significantly associated with the QTc-interval in Set 1 were subsequently tested in Set 2 (Table 3). In Set 2, only the NOS1AP SNP (rs16847548) displayed a significant association at the Bonferroni-corrected P value threshold of P<0.016 (0.05/3). The direction of the effect was consistent with that found in Set 1, with the minor allele being associated with a longer QTc-interval. The other 2 SNPs (rs1935778, rs956642) showed a nonsignificant effect on QTc-interval in Set 2 (effect <0.5 ms). Combining the results improved the accuracy for all estimates, but the effects of rs1935778 and rs956642 were reduced with 40% to 50% (Table 3).
SNPs From QTc-Interval GWAS
Analysis of SNP effects on the QTc-interval analyzed as a quantitative variable. Twenty-two SNPs previously found to associate with the QTc-interval in the general population were analyzed for modulatory effects on the QTc-interval as a quantitative variable in Sets 1 and 2 combined (Table 4). Three SNPs (rs10494366, rs12143842, and rs2880058), all from the NOS1AP locus were found to associate with the QTc-interval at the preset Bonferroni-corrected P value threshold of 2.27×10⁻³ (0.05/22). In all cases, the minor allele was associated with a longer QTc-interval and the effect size per minor allele was >12 ms. Of note, rs16847548 which was found to associate with the QTc-interval in the candidate gene study (Table 3) is in LD with rs12143842 (R2=0.88). Four SNPs displayed nominal statistical significance; these were rs12029454 and rs16857031 at NOS1AP, rs2074238 at KCNQ1, and rs17779747 at KCNJ2.
Table 4.
Effects of SNPs Previously Associated With the QTc-lnterval in the General Population, in LQT2 Sets 1 and 2 Combined
| Effect on QTc-interval* (n=639) |
||||||
|---|---|---|---|---|---|---|
| SNP From GWAS (n=22) | Chromosome | Closest Gene | Major Allele | Minor Allele* | β±SE (ms) | P Value† |
| rs10494366 | 1q23.3 | N0S1AP | T | G (↑) | 14.1±2.6 | 9.5×10⁻⁸ |
| rs12029454 | 1q23.3 | N0S1AP | G | A (↑) | 8.4±3.1 | 0.007 |
| ‡rs12143842 | 1q23.3 | N0S1AP | C | T (↑) | 13.2±2.6 | 4.8×10⁻⁷ |
| rs16857031 | 1q23.3 | N0S1AP | C | G (↑) | 6.8±3.3 | 0.043 |
| rs2880058 | 1q23.3 | N0S1AP | A | G (↑) | 12.2±2.5 | 8.6×10⁻⁷ |
| rs4657178 | 1q23.3 | N0S1AP | C | T (↑) | 1.5±2.7 | 0.595 |
| rs10919071 | 1q24.2 | ATP1B1 | A | G (↓) | 3.4±3.5 | 0.335 |
| rs37062 | 16q21 | CN0T1 | A | G (↓) | −1.8±2.7 | 0.518 |
| rs1805128 | 21q22.12 | KCNE1 | G | A (↑) | 4.7±4.7 | 0.309 |
| rs2968863 | 7q36.1 | KCNH2 | G | A (↓) | 4.0±3.0 | 0.175 |
| rs4725982 | 7q36.1 | KCNH2 | C | T (↑) | 1.8±3.1 | 0.552 |
| rs12576239 | 11p15.5 | KCNQ1 | C | T (↑) | 3.3±3.3 | 0.318 |
| rs2074238 | 11p15.5 | KCNQ1 | C | T (↓) | −10.0±5.1 | 0.049 |
| rs2074518 | 17q11.2–q12 | LIG3 | G | A (↓) | −0.7±2.4 | 0.765 |
| rs8049607 | 16p13.13 | LITAF | C | T (↑) | 0.9±2.4 | 0.702 |
| rs846111 | 1p36.31 | RNF207 | C | G (↓) | −0.2±2.9 | 0.954 |
| rs12053903 | 3p22.2 | SCN5A | T | C (↓) | −2.8±2.7 | 0.297 |
| rs3825214 | 12q24.21 | TBX5 | A | G (↑) | 0.5±3.1 | 0.865 |
| rs17779747 | 17q24.3 | KCNJ2 | G | T (↓) | −7.0±2.6 | 0.007 |
| rs2478333 | 13q13 | SUCLA2 | C | A (↑) | −1.4±2.6 | 0.586 |
| rs11970286 | 6q22 | PLN | C | T (↑) | −0.3±2.5 | 0.900 |
| rs12210810 | 6q22 | PLN | G | C (↓) | 0.9±6.7 | 0.894 |
GWAS indicates genome-wide association study; LQT2, long-QT 2; QTc, corrected QT; and SNPs, single-nucleotide polymorphisms.
The coded allele is the minor allele in all cases. The direction of effect found in GWAS conducted in the general population is denoted in parenthesis: ↑, increase in QTc-interval; and ↓, decrease in QTc-interval.
P values for SNPs passing the Bonferroni-corrected P-value threshold (P<2.3×10⁻³) are depicted in bold.
In LD with rs16847548 from the candidate gene study (R2=0.88); see Table 3.
Case–Control Analysis
The 22 SNPs from QTc-interval GWAS were also investigated for association with LQTS status using a case–control design using independent probands from Sets 1 and 2 combined as cases and general population individuals from the GoNL project as controls (Table 5).20 In this analysis, 2 SNPs were significantly (P<2.27×10⁻³) associated with LQTS status and displayed the expected directionality of effect, that is, the allele associated with a longer QTc-interval in the general population was the risk allele. The SNPs were located at NOS1AP (rs12029454) and KCNQ1 (rs12576239), respectively. Another 7 SNPs displayed a nominal association.
Table 5.
Case–Control Analysis of SNPs Previously Associated With the QTc-lnterval in the General Population, in Probands From LQT2 Sets 1 and 2 Combined
| SNP From GWAS | Closest Gene | Coded Allele | Frequency Coded Allele (Cases/Controls) | OR (95% CI) | P Value | Concordance With SNP Effect on QTc-Interval |
|---|---|---|---|---|---|---|
| rs10494366 | N0S1AP | G | 0.43/0.34 | 1.35 (1.03–1.76) | 0.028 | Yes |
| rs12029454 | N0S1AP | A | 0.21/0.13 | 1.85 (1.32–2.59) | 0.0003* | Yes |
| rs12143842 | N0S1AP | T | 0.31/0.23 | 1.49 (1.13–1.96) | 0.005 | Yes |
| rs16857031 | N0S1AP | G | 0.17/0.14 | 1.25 (0.89–1.76) | 0.20 | |
| rs2880058 | N0S1AP | G | 0.40/0.32 | 1.39 (1.08–1.80) | 0.014 | Yes |
| rs4657178 | N0S1AP | T | 0.31/0.23 | 1.45 (1.10–1.93) | 0.009 | Yes |
| rs10919071 | ATP1B1 | G | 0.12/0.11 | 1.20 (0.82–1.77) | 0.35 | |
| rs37062 | CN0T1 | G | 0.25/0.24 | 1.04 (0.79–1.37) | 0.77 | |
| rs1805128 | KCNE1 | A | 0.04/0.02 | 1.95 (1.06–3.57) | 0.03 | Yes |
| rs2968863 | KCNH2 | A | 0.22/0.24 | 0.89 (0.65–1.21) | 0.45 | |
| rs4725982 | KCNH2 | T | 0.20/0.20 | 1.00 (0.74–1.34) | 0.98 | |
| rs12576239 | KCNQ1 | T | 0.20/0.12 | 1.84 (1.31–2.60) | 0.0005* | Yes |
| rs2074238 | KCNQ1 | T | 0.06/0.08 | 0.77 (0.49–1.21) | 0.26 | |
| rs2074518 | LIG3 | A | 0.46/0.46 | 0.97 (0.75–1.25) | 0.82 | |
| rs8049607 | LITAF | T | 0.46/0.53 | 0.77 (0.60–0.98) | 0.03 | Yes |
| rs846111 | RNF207 | G | 0.28/0.31 | 0.86 (0.65–1.13) | 0.27 | |
| rs12053903 | SCN5A | C | 0.32/0.35 | 0.88 (0.68–1.14) | 0.31 | |
| rs3825214 | TBX5 | G | 0.22/0.21 | 1.09 (0.81–1.47) | 0.58 | |
| rs17779747 | KCNJ2 | T | 0.36/0.33 | 1.14 (0.87–1.50) | 0.34 | |
| rs2478333 | Intergenic | A | 0.41/0.33 | 1.43 (1.11–1.86) | 0.007 | Yes |
| rs11970286 | PLN | T | 0.46/0.45 | 1.08 (0.83–1.40) | 0.56 | |
| rs12210810 | PLN | C | 0.03/0.06 | 0.56 (0.29–1.10) | 0.09 |
CI indicates confidence interval; GWAS, genome-wide association study; LQT2, long-QT 2; OR, odds ratio; QTc, corrected QT; and SNPs, single-nucleotide polymorphisms.
P -values are below the Bonferroni-corrected significance threshold.
Individual SNP Effects on Cardiac Events
SNPs that displayed a significant or nominal association in any of the above analyses were LD-pruned (R2<0.5) and assessed for association with cardiac events in Sets 1 and 2 combined (n=639). Because it has been previously suggested that SNP effects on risk of cardiac events might be more pronounced in patients with QTc<500 ms,9 we also tested for association with cardiac events in this subgroup alone. Of the 12 SNPs tested (Table 6), none were associated with cardiac events after correction for multiple testing (0.05/12; P<4.2×10⁻³). However, 3 SNPs, 2 at NOS1AP and 1 at KCNE1, were nominally associated with cardiac events. In all 3 cases, the allele associated with a longer QTc-interval increased risk. The results differed somewhat when LQT2 patients with QTc-interval <500 ms were analyzed separately, with the effect of the KCNE1 SNP no longer remaining (nominally) significant (Table 6). Reanalysis of the 3 SNPs by adding QTc-interval as an additional covariate in the model resulted in lower and nonsignificant relative risks for all 3 (rs10494366, odds ratio, 1.15; 95% confidence interval [CI], 0.92–1.44; rs12029454; odds ratio, 1.27; 95% CI, 1.00–1.62; and rs1805128, odds ratio, 1.26; 95% CI, 0.95–1.67).
Table 6.
Effect of SNPs on Event-Free Survival in Sets 1 and 2 Combined
| Effect on Event-Free Survival* | Effect on Event-Free Survival in Patients With QTc<500 ms* | ||||||
|---|---|---|---|---|---|---|---|
|
|
|||||||
| SNP | Closest Gene | Major Allele | Minor Allele | RR (95% CI) | P Value† | RR (95% CI) | P Value† |
| rs10494366 | N0S1AP | T | G | 1.30 (1.04–1.61) | 0.020 | 1.35 (1.04–1.77) | 0.027 |
| rs12029454 | N0S1AP | G | A | 1.37 (1.08–1.74) | 0.011 | 1.45 (1.07–1.95) | 0.015 |
| rs12143842 | N0S1AP | C | T | 1.14 (0.91–1.42) | 0.246 | 1.13 (0.86–1.48) | 0.373 |
| rs16857031 | N0S1AP | C | G | 1.03 (0.78–1.35) | 0.855 | 0.93 (0.66–1.32) | 0.694 |
| rs4657178 | N0S1AP | C | T | 1.22 (0.97–1.53) | 0.08 | 1.32 (1.00–1.74) | 0.06 |
| rs2880058 | N0S1AP | A | G | 1.16 (0.94–1.44) | 0.167 | 1.22 (0.95–1.57) | 0.118 |
| rs1805128 | KCNE1 | G | A | 1.33 (1.01–1.76) | 0.044 | 1.29 ((0.89–1.85) | 0.174 |
| rs2074238 | KCNQ1 | C | T | 0.83 (0.53–1.31) | 0.422 | 0.78 (0.46–1.32) | 0.356 |
| rs12576239 | KCNQ1 | C | T | 1.13 (0.86–1.48) | 0.38 | 1.02 (0.74–1.42) | 0.89 |
| rs17779747 | KCNJ2 | G | T | 1.14 (0.92–1.42) | 0.221 | 1.21 (0.94–1.55) | 0.137 |
| rs8049607 | LITAF | C | T | 0.91 (0.74–1.14) | 0.42 | 0.93 (0.73–1.20) | 0.59 |
| rs2478333 | Intergenic | C | A | 1.04 (0.83–1.31) | 0.73 | 1.05 (0.82–1.34) | 0.70 |
CI indicates confidence interval; GWAS, genome-wide association study; LQT2, long-QT 2; QTc, corrected QT; RR, relative risk; and SNPs, single-nucleotide polymorphisms.
The coded allele is the minor allele.
P values for nominally associating SNPs are displayed in italics.
Genetic Risk Score
We finally tested the effect of the 22 SNPs from GWAS, and a subset of 6 NOS1AP SNPs thereof, in aggregate by first generating 2 multilocus GRSs (GRS22 and GRSNOS1AP) per individual and then testing these GRS for association with QTc-interval and occurrence of cardiac events. This analysis was conducted in patients from Sets 1 and 2 combined. The GRS22, that varied from −8 to 14 with a mean (±SD) of 3.0±3.8, was strongly associated with the QTc-interval with an increase of 2.3 (SE, 0.50) ms per point increase in GRS22 (P=4.3×10⁻⁶; Figure 1A). There was a linear increase in QTc-interval with increasing GRS22; patients with GRS22 in the second, third, or fourth quartile had mean QTc-intervals that were 7 (SE, 5), 13 (SE, 6), and 19 (SE, 5) ms, respectively, longer than individuals in the lowest GRS22 quartile. When the 6 NOS1AP SNPs were not included in the GRS calculation, the correlation between the GRS and the QTc-interval was no longer significant (P=0.15). The GRSNOS1AP, consisting of the 6 NOS1AP SNPs only, showed a similar/better fit than the GRS22 (AICGRS22, 5199.2; AICGRSNOS1AP, 5194.9). The GRSNOS1AP, varying from 0 to 11, was strongly associated with the QTc-interval with an increase of 3.5 (SE, 0.69) ms per point increase in GRSNOS1AP (P=4.2×10⁻⁷; Figure 1B). Patients with GRSNOS1AP in the second, third, or fourth quartile had mean QTc-intervals that were 14 (SE, 5), 15 (SE, 5), and 23 (SE, 5) ms, respectively, longer than individuals in the lowest GRSNOS1AP quartile.
Figure.
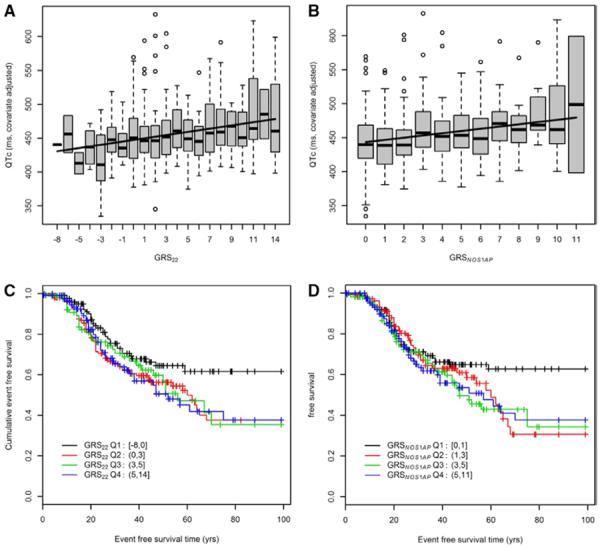
A and B, Association between the genetic risk scores, GRS22 and GRSNOS1AP, and the QTc-interval in LQT2 patient Set 1 and Set 2 combined (n=639; GRS22: P=4.3×10⁻⁶; GRSNOS1AP: P=4.2×10⁻⁷). C and D, Analysis of the relation between the genetic risk scores, GRS22 and GRSNOS1AP, and event-free survival in LQT2 patient Set 1 and Set 2 combined (n=639; GRS22: P=0.192, GRSNOS1AP: P=0.119). Q1 is the quartile with the lowest genetic risk score.
No associations were found between GRS22 or GRSNOS1AP quartiles and the occurrence of a cardiac event, neither in the entire LQT2 patient sample (GRS22, P=0.192; GRSNOS1AP, P=0.119; Figure 1C and 1D; Figure IIA and IIB in the Data Supplement) nor in the subset of patients with a QTc-interval <500 ms (data not shown). The results did not differ when only patients with documented VT or aborted cardiac arrest/VF were considered (data not shown). Although risk of a cardiac event did not increase linearly between quartiles, inspection of the data in Figure 1C and 1D and Figure II in the Data Supplement suggested that individuals in the quartile with the lowest GRS (Q1) might be protected as opposed to individuals in any of the other 3 quartiles (Q2–Q4). A statistical comparison of the cumulative event-free survival in these 2 groups, that is, Q1 versus Q2–Q4 uncovered a protective effect for patients in Q1 (GRS22: RR, 0.67; 95% CI, 0.46–0.98; P=0.041; GRSNOS1AP: RR, 0.69; 95% CI, 0.48–0.98; P=0.039; Figure III in the Data Supplement).
The QTc-interval was a strong predictor of cardiac events in patients with a QTc-interval in the highest quartile with a RR of 2.11 (95% CI, 1.35–3.30) when compared with patients in the lowest QTc-interval quartile (P=7.9×10⁻⁷; Figure IV in the Data Supplement).
Discussion
Considerable interest exists in the identification of genetic factors that modulate disease severity in the LQTS as the identification of such factors is expected to contribute to the refinement of risk stratification in the individual patient. However, studies aimed at the identification of these genetic factors are scarce.8–10 In this study, we undertook 2 approaches to identify common genetic variants that modulate the QTc-interval and the occurrence of cardiac events in a large set of patients with LQT2. In 1 approach, we conducted an exploratory analysis of SNPs tagging common haplotypes within and around 18 candidate genes. In a second approach, we investigated the role of 22 independent SNPs from 14 chromosomal loci that were previously identified as modulators of the QTc-interval in GWAS studies conducted in the general population. Our analysis confirms and extends on previous observations that common genetic variants at the NOS1AP locus modulate disease severity in the LQTS. We identified multiple SNPs at this locus displaying markedly large effects on the QTc-interval among LQT2 patients and enrichment of the QTc-prolonging allele in LQT2 patients versus general population controls. In addition, 2 NOS1AP SNPs also appeared to affect the risk of cardiac events. Similar effects on the QTc-interval and risk of cardiac events were observed when the NOS1AP SNPs were considered in aggregate as a GRS. Our data also implicate for the first time common genetic variation at KCNQ1 as a risk factor for LQTS.
NOS1AP
GWAS conducted in the general population have consistently shown that SNPs at the NOS1AP locus exert the strongest influence of any of the common genetic variation known to influence the QTc-interval.11,12,15,17 In this study, SNPs at NOS1AP have similarly emerged as the strongest modifiers of the QTc-interval and possible modifiers of cardiac events among LQT2 patients, both when considered as single variants, as well as when considered cumulatively as a GRS. Of the 6 independent signals (R2<0.4) that we tested at this locus, 3 (rs10494366, rs12143842, and rs2880058) displayed highly significant associations with the QTc-interval; 1 of these (rs10494366) also displayed a suggestive association with the occurrence of cardiac events. Besides these, rs12029454 was significantly enriched in LQT2 probands versus controls and displayed a suggestive association with both the QTc-interval and cardiac events.
Three studies have previously investigated the role of NOS1AP SNPs as modulators of disease severity in LQTS. One study investigated NOS1AP SNPs in 135 carriers of the founder mutation KCNQ1-A341V and identified rs4657139 (in high LD with our rs2880058) and rs16847548 (in high LD with our rs12143842) as modifiers of the QTc-interval and risk of cardiac events.8 A second study analyzed NOS1AP SNPs in 901 patients with LQTS of different genetic subtypes (primarily LQT1-3).9 This study also identified rs4657139 and rs16847548 as modifiers of the QTc-interval and detected effects on cardiac events for rs4657139 and rs10494366. A third study tested NOS1AP SNPs in 112 phenotypically discordant (1 clinically affected and 1 not) patient duos carrying the same mutation in either KCNQ1 or KCNH2 and identified a suggestive association between rs12029454 and the QTc-interval.10
Keeping in mind that these 3 studies and ours are for several reasons not directly comparable (eg, different sizes of the patient study sample which affects the statistical power, different study design, patients studied harbor mutation in different LQTS gene, and the fact that not all studies investigated every independent signal linked thus far to the QTc-interval in the general population), in aggregate their findings allow us to start drawing some conclusions about the role of NOS1AP SNPs in modulation of disease severity in the LQTS. It is obviously clear that common genetic variation at this locus also modulates the QTc-interval in patients with LQTS, with some individual SNPs (such as rs12143842 and rs2880058) now displaying highly convincing associations with the QTc-interval in the majority of the studies. Another observation emerging from these studies is that the effect of NOS1AP SNPs on the QTc-interval is larger in patients with LQTS when compared with that observed in the general population in previous GWAS. In our analysis, for example, each T-allele at rs12143842 increased the QTc-interval by an average of 13.2 ms, whereas its effect in a large sample of the general population was of 3.15 ms.11 We also detected similarly large effects for rs10494366 and rs2880058 (see Table 4). Effect sizes of 7 and 8 ms were observed for rs4657139 and rs16847548, respectively, in the study of Tomás et al.9 The larger effect sizes among patients with LQTS are likely because of the sensitized genetic background of these patients: they are all carriers of a rare genetic variant with a putatively large deleterious effect on repolarization reserve which in turn may make the repolarization process more permissive to the effect of common genetic variation. This observation brings forward the possibility that further genetic studies in patients with LQTS may uncover QTc-modulating genetic variants that would otherwise remain unidentified in GWAS conducted in the general population because of the small effect size in the latter.
However, although strong associations have been laid in patients with LQTS between NOS1AP SNPs and the QTc-interval, this cannot be said of the effect of the same SNPs on the risk of cardiac events. In our study, although 2 of 6 NOS1AP SNPs we tested were nominally associated with risk of cardiac events, none, even those displaying robust effects on the QTc-interval, displayed association P values for cardiac events that exceeded the Bonferroni-corrected threshold for multiple testing. Notwithstanding, considering the fact that QTc-modulating NOS1AP SNPs have already been implicated in modulation of risk for cardiac events in 2 studies,8,9 one could argue that the Bonferroni correction we applied is too harsh. Of the 2 SNPs that showed a nominal association with cardiac events in our study, rs10494366 was previously associated with risk of cardiac events by Tomás et al.9
NOS1AP encodes a nitric oxide synthase adapter protein. Functional studies have suggested that it regulates action potential duration of cardiomyocytes via calcium and potassium currents.21 The NOS1AP SNPs that affect the QTc-interval are located in the noncoding regions of the gene, and if their effect on the QTc-interval indeed occurs through NOS1AP, it is then likely that this occurs through modulation of the level of NOS1AP transcript abundance and consequently protein levels.
SNPs at Other Loci
In our analysis, of the 22 SNPs from GWAS for quantitative effects on the QTc-interval, besides the SNPs at NOS1AP discussed above, no additional SNPs passed the Bonferroni-corrected significance threshold. Two SNPs (rs2074238 at KCNQ1 and rs17779747 at KCNJ2), however, displayed a nominal association with a direction of effect consistent with that found previously in the general population.11,12 The T-allele at rs2074238 is associated with a shorter QTc-interval. Of note, this SNP was recently reported to be associated with a shorter QTc-interval and decreased risk of symptoms in the study of Duchatelet et al.10 We detected no effect of this SNP on cardiac events in the patients with LQT2 studied here. The study by Duchatelet et al, however, detected larger effects for this SNP, both on the QTc-interval and cardiac events, when compared with our study, and although our study was sufficiently powered to detect those effects, it was underpowered to uncover an association with the small effects we detected.
Besides our quantitative trait analysis of the 22 SNPs from GWAS with the QTc-interval, we additionally investigated their association with LQTS status in a case-control association analysis of the LQT2 probands versus individuals from the general population (Table 5). This additional analysis uncovered 2 significant associations with the expected direction of effect (ie, the QTc-interval prolonging allele being enriched among the cases versus the controls) highlighting the potential use of this approach as recently also demonstrated by us for the Brugada syndrome.22 Our current analysis, for the first time, linked rs12576239 at KCNQ1 with susceptibility to the LQTS.
Genetic Risk Scores
We considered for the first time the combined effect of all 22 SNPs linked to the QTc-interval by constructing a GRS for each individual (GRS22) and relating it to the QTc-interval and occur-rence of cardiac events. We demonstrated a significant positive linear relationship between GRS22 and the QTc-interval. The correlation between GRS22 and the QTc-interval, however, seems to be largely driven by the effect of the 6 NOS1AP SNPs as the association between the GRS and the QTc-interval did not remain significant when these SNPs were removed from the GRS calculation. A GRS based on the 6 NOS1AP SNPs only (GRSNOS1AP) showed a similar predictive value for QTc to that of the GRS22. No significant (linear) relation was found between either GRS22 or GRSNOS1AP and the risk of cardiac events, but patients with scores in the first quartile had significantly less events than the patients in the other 3 quartiles combined. The latter observation will require further investigation in additional patients.
Effect on Cardiac Events
Our single SNP analysis did not uncover significant associations between any of the investigated SNPs and the occurrence of cardiac events. Furthermore, our GRS analyses did not reveal a linear relationship between the GRS and risk of cardiac events. However, when one considers the fact that the SNPs tested are candidates with a strong a priori probability of being involved, one could argue that in the single SNP analysis, our correction for multiple testing might be too conservative. However, one can posit that while the QTc-interval is governed by an appreciable genetic component, the precipitation of arrhythmias in the LQTS may be heavily influenced by other factors, such as environmental triggers, that vary largely across patients. In any case, the low relative risk associated with these variants currently precludes their immediate clinical use for arrhythmia risk stratification.
Many SNPs previously shown to affect the QTc-interval in the general population were silent with respect to their effect on the QTc-interval in our analysis. Some investigators have argued that the effect of SNPs in patients with LQTS is dwarfed by the large effect of the primary mutation (so-called ceiling effect).8 Although this seems a plausible explanation, it is unclear why NOS1AP SNPs are not affected by this phenomenon. One possibility could be the larger effect size among patients with LQTS of NOS1AP SNPs when compared with the others, which would argue for investigation of the nonassociating SNPs in larger patient sets.
Candidate Gene Study
Besides SNPs from QTc-interval GWAS, we also systematically investigated the effect of haplotype-tagging SNPs in 18 candidate genes in LQT2 patient Set 1 (Table 3). Besides rs16847548 in NOS1AP, this analysis uncovered 2 associations, at CASQ2 (rs1935778) and KCNH2 (rs956642), respectively. Neither of the latter 2 SNPs were, however, validated in patient Set 2. Although these 2 SNPs may merit further investigation in additional samples, these signals may represent a false-positive association. One could argue that our correction for multiple testing in Set 1 may be too stringent and that true associations may exist above the Bonferroni-corrected P value threshold we used as the 18 genes were selected based on their high a priori probability for modulating the QTc-interval. Nevertheless, we preferred to apply stringent criteria for the most reliable findings with the current data.
Limitations
In this study, we limited genetic heterogeneity by considering only LQTS patients with a KCNH2 genetic defect. Nevertheless, although we accounted for this in the statistical analysis, some confounding may remain as a consequence of the variability in the severity of the haploinsufficient defect and the biophysical defect associated with the different KCNH2 mutations among the patients. Considering the fact that the LQTS is a rare disorder, we have here studied a substantial number of patients. However, the patient set may yet be considered modest for the study of common genetic variants with small effects. The effect of SNPs that we describe here may be different in the setting of other LQTS genetic subtypes. Furthermore, SNP effects may be allele-dependent, as we previously demonstrated for SNPs in the 3′ untranslated region of the KCNQ1 gene.23 The design of this study precludes the analysis for such effects.
Conclusions
Our comprehensive analysis demonstrates that among SNPs previously linked to the QTc-interval in the general population, NOS1AP SNPs are the strongest modulators of the QTc-interval in patients with LQT2. The effect of these SNPs in patients with LQT2 is markedly larger than that observed in the general population. Our study also uncovered common genetic variation at KCNQ1 as a risk factor for LQTS.
Supplementary Material
CLINICAL PERSPECTIVE.
The congenital long-QT syndrome is a heritable disorder associated with QTc-interval prolongation on the ECG and an increased risk of sudden cardiac death. Although gene discovery in the disorder has had a considerable impact, variability in disease severity among mutation carriers still hinders patient care. Although the inheritance of additional genetic factors is expected to contribute, the identity of these remains largely unknown. The identification of such genetic modifiers of disease severity may contribute to refinement of risk stratification in these patients. We here investigated the role of common genetic variants in the form of single-nucleotide polymorphisms (SNPs) in a large set of patients with long-QT syndrome caused by mutations in the KCNH2 gene. In the first approach, we conducted a comprehensive analysis of SNPs in 18 candidate genes. In a second approach, we investigated the effect of SNPs that have been previously associated with the QTc-interval in genome-wide association studies conducted in the general population. Our analysis identified SNPs at the NOS1AP gene locus that, in isolation or in aggregate, displayed relatively large effects on the QTc-interval. NOS1AP SNPs also displayed a trend for an association with cardiac events. Our observations thus confirm and extend on previous findings that common genetic variants at the NOS1AP locus modulate disease severity in the long-QT syndrome. As knowledge about the identity of modulatory genetic factors such as those identified here continues to increase, it is hoped that these may be implemented clinically for improved risk stratification in long-QT syndrome.
Acknowledgments
Sources of Funding This study was supported by a grant from Fondation Leducq (Alliance Against Sudden Cardiac Death, 05 CVD 01). We acknowledge the support from the Netherlands CardioVascular Research Initiative (CVON-PREDICT project): the Dutch Heart Foundation, Dutch Federation of University Medical Centres, the Netherlands Organisation for Health Research and Development, and the Royal Netherlands Academy of Sciences. Dr Schulze-Bahr is supported by an IZKF (Interdisciplinary Centre for Clinical Research) grant. Dr Barc was supported by the Netherlands Heart Institute (ICIN). This study makes use of data generated by the GoNL Funding for GoNL was provided by the Netherlands Organization for Scientific Research under award number 184021007, dated July 9, 2009 and made available as a Rainbow Project of the Biobanking and Biomolecular Research Infrastructure Netherlands (BBMRI-NL). Samples where contributed by LifeLines (http://lifelines.nl/lifelines-research/general), The Leiden Longevity Study (http://www.healthy-ageing.nl; http://www.langleven.net), The Netherlands Twin Registry (NTR: http://www.tweelingenregister.org), The Rotterdam studies, (http://www.erasmus-epidemiology.nl/rotterdamstudy), and the Genetic Research in Isolated Populations program (http://www.epib.nl/research/geneticepi/research.html#gip). The sequencing was performed in collaboration with the Beijing Institute for Genomics.
Footnotes
The Data Supplement is available at http://circgenetics.ahajournals.org/lookup/suppl/doi:10.1161/CIRCGENETICS.114.000785/-/DC1.
Disclosures None.
References
- 1.Schwartz PJ, Ackerman MJ, George AL, Jr, Wilde AA. Impact of genetics on the clinical management of channelopathies. J Am Coll Cardiol. 2013;62:169–180. doi: 10.1016/j.jacc.2013.04.044. doi: 10.1016/j.jacc.2013.04.044. [DOI] [PMC free article] [PubMed] [Google Scholar]
- 2.Priori SG, Napolitano C, Schwartz PJ. Low penetrance in the long-QT syndrome: clinical impact. Circulation. 1999;99:529–533. doi: 10.1161/01.cir.99.4.529. [DOI] [PubMed] [Google Scholar]
- 3.Priori SG, Schwartz PJ, Napolitano C, Bloise R, Ronchetti E, Grillo M, et al. Risk stratification in the long-QT syndrome. N Engl J Med. 2003;348:1866–1874. doi: 10.1056/NEJMoa022147. doi: 10.1056/NEJMoa022147. [DOI] [PubMed] [Google Scholar]
- 4.Schwartz PJ, Vanoli E, Crotti L, Spazzolini C, Ferrandi C, Goosen A, et al. Neural control of heart rate is an arrhythmia risk modifier in long QT syndrome. J Am Coll Cardiol. 2008;51:920–929. doi: 10.1016/j.jacc.2007.09.069. doi: 10.1016/j.jacc.2007.09.069. [DOI] [PubMed] [Google Scholar]
- 5.Makita N, Horie M, Nakamura T, Ai T, Sasaki K, Yokoi H, et al. Drug-induced long-QT syndrome associated with a subclinical SCN5A mutation. Circulation. 2002;106:1269–1274. doi: 10.1161/01.cir.0000027139.42087.b6. [DOI] [PubMed] [Google Scholar]
- 6.Shimizu W, Moss AJ, Wilde AA, Towbin JA, Ackerman MJ, January CT, et al. Genotype-phenotype aspects of type 2 long QT syndrome. J Am Coll Cardiol. 2009;54:2052–2062. doi: 10.1016/j.jacc.2009.08.028. doi: 10.1016/j.jacc.2009.08.028. [DOI] [PMC free article] [PubMed] [Google Scholar]
- 7.Westenskow P, Splawski I, Timothy KW, Keating MT, Sanguinetti MC. Compound mutations: a common cause of severe long-QT syndrome. Circulation. 2004;109:1834–1841. doi: 10.1161/01.CIR.0000125524.34234.13. doi: 10.1161/01. CIR.0000125524.34234.13. [DOI] [PubMed] [Google Scholar]
- 8.Crotti L, Monti MC, Insolia R, Peljto A, Goosen A, Brink PA, et al. NOS1AP is a genetic modifier of the long-QT syndrome. Circulation. 2009;120:1657–1663. doi: 10.1161/CIRCULATIONAHA.109.879643. doi: 10.1161/CIRCULATIONAHA.109.879643. [DOI] [PMC free article] [PubMed] [Google Scholar]
- 9.Tomás M, Napolitano C, De Giuli L, Bloise R, Subirana I, Malovini A, et al. Polymorphisms in the NOS1AP gene modulate QT interval duration and risk of arrhythmias in the long QT syndrome. J Am Coll Cardiol. 2010;55:2745–2752. doi: 10.1016/j.jacc.2009.12.065. doi: 10.1016/j.jacc.2009.12.065. [DOI] [PubMed] [Google Scholar]
- 10.Duchatelet S, Crotti L, Peat RA, Denjoy I, Itoh H, Berthet M, et al. Identification of a KCNQ1 polymorphism acting as a protective modifier against arrhythmic risk in long-QT syndrome. Circ Cardiovasc Genet. 2013;6:354–361. doi: 10.1161/CIRCGENETICS.113.000023. doi: 10.1161/CIRCGENETICS.113.000023. [DOI] [PMC free article] [PubMed] [Google Scholar]
- 11.Newton-Cheh C, Eijgelsheim M, Rice KM, de Bakker PI, Yin X, Estrada K, et al. Common variants at ten loci influence QT interval duration in the QTGEN Study. Nat Genet. 2009;41:399–406. doi: 10.1038/ng.364. doi: 10.1038/ng.364. [DOI] [PMC free article] [PubMed] [Google Scholar]
- 12.Pfeufer A, Sanna S, Arking DE, Müller M, Gateva V, Fuchsberger C, et al. Common variants at ten loci modulate the QT interval duration in the QTSCD Study. Nat Genet. 2009;41:407–414. doi: 10.1038/ng.362. doi: 10.1038/ng.362. [DOI] [PMC free article] [PubMed] [Google Scholar]
- 13.Marroni F, Pfeufer A, Aulchenko YS, Franklin CS, Isaacs A, Pichler I, et al. EUROSPAN Consortium A genome-wide association scan of RR and QT interval duration in 3 European genetically isolated populations: the EUROSPAN project. Circ Cardiovasc Genet. 2009;2:322–328. doi: 10.1161/CIRCGENETICS.108.833806. doi: 10.1161/CIRCGENETICS.108.833806. [DOI] [PMC free article] [PubMed] [Google Scholar]
- 14.Chambers JC, Zhao J, Terracciano CM, Bezzina CR, Zhang W, Kaba R, et al. Genetic variation in SCN10A influences cardiac conduction. Nat Genet. 2010;42:149–152. doi: 10.1038/ng.516. doi: 10.1038/ng.516. [DOI] [PubMed] [Google Scholar]
- 15.Arking DE, Pfeufer A, Post W, Kao WH, Newton-Cheh C, Ikeda M, et al. A common genetic variant in the NOS1 regulator NOS1AP modulates cardiac repolarization. Nat Genet. 2006;38:644–651. doi: 10.1038/ng1790. doi: 10.1038/ng1790. [DOI] [PubMed] [Google Scholar]
- 16.de Bakker PI, Yelensky R, Pe'er I, Gabriel SB, Daly MJ, Altshuler D. Efficiency and power in genetic association studies. Nat Genet. 2005;37:1217–1223. doi: 10.1038/ng1669. doi: 10.1038/ng1669. [DOI] [PubMed] [Google Scholar]
- 17.Marroni F, Pfeufer A, Aulchenko YS, Franklin CS, Isaacs A, Pichler I, et al. EUROSPAN Consortium A genome-wide association scan of RR and QT interval duration in 3 European genetically isolated populations: the EUROSPAN project. Circ Cardiovasc Genet. 2009;2:322–328. doi: 10.1161/CIRCGENETICS.108.833806. doi: 10.1161/CIRCGENETICS.108.833806. [DOI] [PMC free article] [PubMed] [Google Scholar]
- 18.Chambers JC, Zhao J, Terracciano CM, Bezzina CR, Zhang W, Kaba R, et al. Genetic variation in SCN10A influences cardiac conduction. Nat Genet. 2010;42:149–152. doi: 10.1038/ng.516. doi: 10.1038/ng.516. [DOI] [PubMed] [Google Scholar]
- 19.Therneau T. [Accessed July 2012];Coxme: mixed effects Cox models. R package version 2.2–3. http://cran.r-project.org//package=coxme.
- 20.Boomsma DI, Wijmenga C, Slagboom EP, Swertz MA, Karssen LC, Abdellaoui A, et al. The genome of the Netherlands: design, and project goals. Eur J Hum Genet. 2014;22:221–227. doi: 10.1038/ejhg.2013.118. doi: 10.1038/ejhg.2013.118. [DOI] [PMC free article] [PubMed] [Google Scholar]
- 21.Chang KC, Barth AS, Sasano T, Kizana E, Kashiwakura Y, Zhang Y, et al. CAPON modulates cardiac repolarization via neuronal nitric oxide synthase signaling in the heart. Proc Natl Acad Sci U S A. 2008;105:4477–4482. doi: 10.1073/pnas.0709118105. doi: 10.1073/pnas.0709118105. [DOI] [PMC free article] [PubMed] [Google Scholar]
- 22.Bezzina CR, Barc J, Mizusawa Y, Remme CA, Gourraud JB, Simonet F, et al. Common variants at SCN5A-SCN10A and HEY2 are associated with Brugada syndrome, a rare disease with high risk of sudden cardiac death. Nat Genet. 2013;45:1044–1049. doi: 10.1038/ng.2712. doi: 10.1038/ng.2712. [DOI] [PMC free article] [PubMed] [Google Scholar]
- 23.Amin AS, Giudicessi JR, Tijsen AJ, Spanjaart AM, Reckman YJ, Klemens CA, et al. Variants in the 3' untranslated region of the KCNQ1-encoded Kv7.1 potassium channel modify disease severity in patients with type 1 long QT syndrome in an allele-specific manner. Eur Heart J. 2012;33:714–723. doi: 10.1093/eurheartj/ehr473. doi: 10.1093/eurheartj/ehr473. [DOI] [PMC free article] [PubMed] [Google Scholar]
Associated Data
This section collects any data citations, data availability statements, or supplementary materials included in this article.