Aging is accompanied by reduced efficacy of inhibitory processes and preserved facilitation of pain and spinal nociceptive responses.
Keywords: Aging, Pain, Reflex, Temporal summation, CPM
Abstract
This study examines the effect of normal aging on temporal summation (TS) of pain and the nociceptive flexion reflex (RIII). Two groups of healthy volunteers, young and elderly, received transcutaneous electrical stimulation applied to the right sural nerve to assess pain and the nociceptive flexion reflex (RIII-reflex). Stimulus intensity was adjusted individually to 120% of RIII-reflex threshold, and shocks were delivered as a single stimulus or as a series of 5 stimuli to assess TS at 5 different frequencies (0.17, 0.33, 0.66, 1, and 2 Hz). This study shows that robust TS of pain and RIII-reflex is observable in individuals aged between 18 and 75 years and indicates that these effects are comparable between young and older individuals. These results contrast with some previous findings and imply that at least some pain regulatory processes, including TS, may not be affected by normal aging, although this may vary depending on the method.
1. Introduction
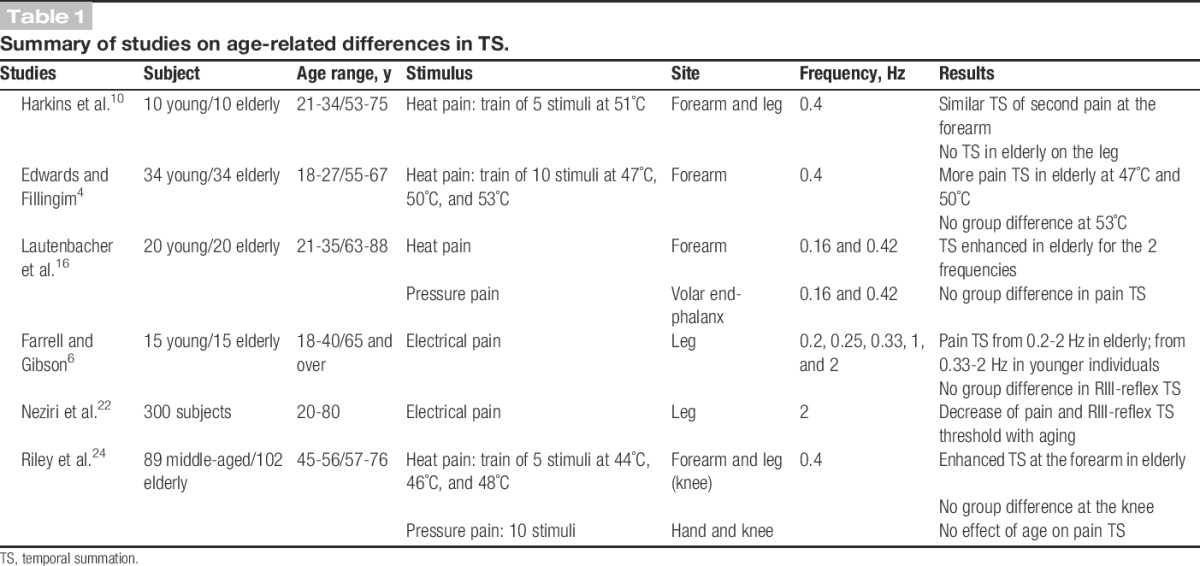
Results on pain sensitivity in the existing literature are mixed but generally show a smaller range of intensities between pain threshold and tolerance, where pain threshold is increased while pain tolerance is decreased.9,11,15 Besides, only a few studies have assessed the effects of age on pain-modulatory mechanisms, such as those underlying the temporal summation (TS) of pain. Based on the studies examining this question, the effect of age on pain TS is unclear (Table 1). In one study, the effect of age on heat pain TS was location specific10; the young group showed a significant TS of second pain on the forearm and leg, whereas elders reported second pain TS on the forearm but not on the leg. Another study showed a lower threshold for heat pain TS on the arm in elders with significant TS at 47°C, 50°C, and 53°C, whereas young individuals showed pain TS at 53°C only.4 The importance of the test stimulus modality was also highlighted in a subsequent study, where elders showed more TS with heat pain, while no difference was observed with mechanical pressure pain.16 Another study used electrical stimulation applied to the sural nerve and recorded the RIII-reflex.6 In this case, TS of pain was observed at a lower frequency in elders (0.2 Hz) compared with younger individuals (0.33 Hz). However, TS of the RIII-reflex was observed only at 2 Hz and no age-related difference was observed. Using electrical stimulation at 2 Hz, Neziri et al.22 reported a decrease in pain and RIII-reflex TS threshold with aging, but with a negligible quantitative impact. Another study compared middle-aged with older individuals on TS of heat pain (forearm and leg) and pressure pain (hand and knee), as well as on analgesia induced by heterotopic noxious counterstimulation (HNCS).24 The 2 groups failed to show pain inhibition during HNCS, and greater heat pain TS was observed at the forearm in elders compared with middle-aged. Taken together, despite some discrepancies depending in part on methodological issues, these results generally suggest a trend towards enhanced TS in elders.
Table 1.
Summary of studies on age-related differences in TS.
Some authors have proposed that enhanced TS sometimes observed in older individuals may reflect a deficit in descending pain inhibitory controls.6,16 This is consistent with several studies showing a smaller analgesic effect of HNCS in elders.5,13,19,25,35 Heterotopic noxious counterstimulation is commonly used to test the integrity of some endogenous pain inhibitory mechanisms, including descending pathways inhibiting spinal nociceptive transmission (eg, diffuse noxious inhibitory controls).18 We recently reported an age-related decrease in HNCS analgesia.19 Here, we report the results of a TS experiment conducted with the same participants. We hypothesized that elders would show TS at lower frequencies and a steeper TS slope compared with younger individuals. Moreover, we tested the possibility that individual differences in TS would be related to the age-related decrease in HNCS analgesia that was reported in the same participants earlier.19
2. Materials and methods
2.1. Ethics approval
All experimental procedures conformed to the standards set by the latest revision of the Declaration of Helsinki and were approved by the Research Ethics Board of the “Institut universitaire de gériatrie de Montréal.” All participants gave written informed consent, acknowledging their right to withdraw from the experiment without prejudice, and received compensation of $50 for their travel expenses, time, and commitment.
2.2. Participants
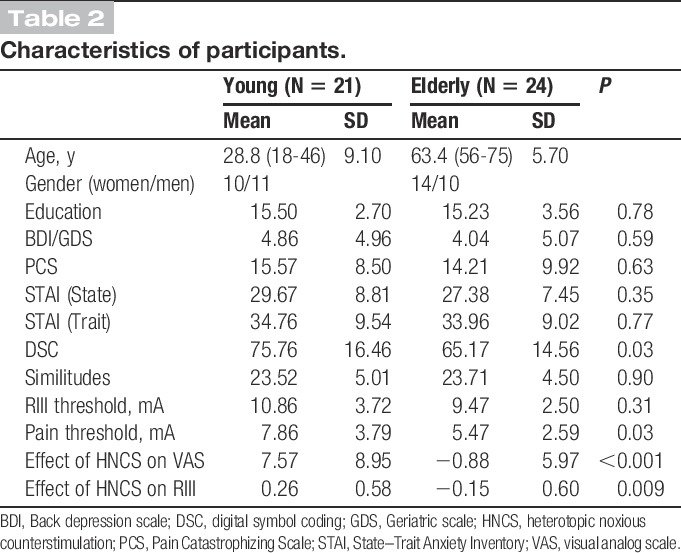
A total of 45 healthy volunteers were recruited among participants from the registry of the research center at the “Institut universitaire de gériatrie de Montréal,” and by advertisement on the campus of the “Université de Montréal.” Participants were excluded if they presented chronic pain syndromes, psychiatric disorders, neurological disorders, metabolic disorders (diabetes), and vascular disorders (eg, lower limb arteriopathy) or used medication that could alter pain perception and modulation 2 weeks before the experiment, including antihypertensives, anxiolytics, antidepressants, and other psychotropic agents. During the screening phone call, participants were asked to abstain from consuming alcohol at least 1 day before experimentation and refrain from consuming tea and coffee on the day of the experiment. Two groups of participants were tested, including 21 young persons, 10 women and 11 men, ranging between 18 and 46 years of age (mean age: 28.8 ± 9.1 years), and 24 older persons, 14 women for 10 men, ranging between 56 and 75 years of age (mean age: 63.4 ± 5.7 years). Based on a self-rated audition and vision questionnaire, all participants reported normal or corrected perceptual abilities (Table 2). The study included HNCS and TS experiments that were conducted on the same day in the same participants. Results of these 2 experiments are reported separately; the HNCS experiment was reported in the study by Marouf et al. and the TS experiment is reported in this article. However, to test the possibility that individual differences in TS could be related to an age-related decrease in HNCS analgesia, a correlation analysis was performed between TS data reported here and HNCS data reported in the study by Marouf et al.
Table 2.
Characteristics of participants.
2.3. Experimental design
This study relied on a mixed design to examine the effects of stimulus repetition and repetition frequency on pain ratings and RIII-reflex amplitude, in 2 groups of participants: young (n = 21) and elders (n = 24). At the beginning of the 120-minute session, subjects filled questionnaires and performed cognitive tests. Then, the RIII-reflex and pain thresholds were determined. Subsequently, the TS session was performed. A period of 30 minutes allowed participants to rest from the electrical stimulation procedures and to fill other questionnaires. Finally, the HNCS experiment was conducted followed by a computerized Stroop task (this part of the study was reported earlier, see Ref. 19).
2.4. Painful electrical stimulation
Transcutaneous electrical stimulation (trains of ten 1-millisecond pulses at 333 Hz) was delivered with an isolated DS7A constant current stimulator (Digitimer Ltd, Welwyn Garden City, United Kingdom) triggered by a train generator (Grass Medical Instruments, Quincy, MA) and controlled by a computer running E-Prime2 (Psychology Software Tools, Sharpsburg, PA). Degreased skin over the retromaleolar path of the right sural nerve was stimulated by a pair of custom-made surface electrodes (1 cm2; 2 cm interelectrode distance). The RIII-reflex threshold was determined using the staircase method including 4 series of stimuli of increasing and decreasing intensity.23,36 Each series always began with an intensity of 1 mA and was followed by increments of 1 mA until the subject reported pain intensity of 70 on the 0 to 100 pain rating scale (see below). Stimulus intensity was then decreased by steps of 1 mA. The intensity–response plot was then created offline, and the RIII-reflex threshold was determined as the intensity producing a response above background electromyographic (EMG) activity in at least 50% of trials (ie, responses exceeding the upper limit of EMG activity recorded at lower intensities according to the individual stimulus–response plot). The intensity of stimulation was then adjusted at 120% of the RIII-reflex threshold, and a series of 10 stimuli was administered to insure stability of responses (otherwise threshold assessment was repeated). Stimulus intensity remained constant at 120% of the RIII-reflex threshold for the remaining of the experiment. The mean intensity at which the subject began to feel pain determined the pain threshold.
2.5. Temporal summation protocol
To assess TS, a series of 5 stimuli (120% of individual RIII thresholds) was administered at different frequencies (0.17, 0.33, 0.66, 1, and 2 Hz). Three TS trials were presented for each frequency, for a total of 15 trials (75 stimuli). In addition, an equal amount of 15 control trials was delivered, which included only 1 stimulus (total of 90 stimuli). Altogether, a total of 30 trials were delivered with a variable intertrial interval of 15 to 30 seconds. Trials were presented in a pseudorandom order to avoid sequence-order effects. Randomization excluded consecutive trains at 2 Hz. Each of the 30 trials was followed by pain rating (Fig. 1).
Figure 1.
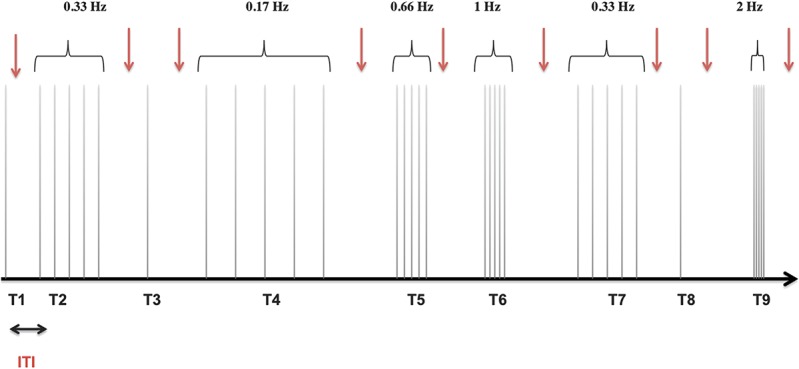
Temporal summation protocol. In total, 3 trials of 5 electrical stimuli (black vertical lines) for each frequency (0.17, 0.33, 0.66, 1, and 2 Hz) and fifteen single stimuli (control trials) were applied in a pseudorandom order with an ITI of 15 to 30 seconds. Part of these trials (T1, T2…T9) is illustrated. The intensity of the stimulation was 120% of RIII-reflex threshold. Participants rated pain intensity after each trial (red arrow) during the ITI. ITI, intertrial interval.
2.6. Heterotopic noxious counterstimulation
The HNCS experience was then conducted (see Ref. 19). The HNCS paradigm lasted 13 minutes and included 80 single electrical stimuli (120% of individual RIII thresholds) administered with an interstimulus interval of 6 seconds. The first 5 stimuli were excluded from the analyses to control for the rapid habituation effect occasionally observed on the first few trials of a series of RIII measurements. The subsequent 75 stimuli were distributed equally in 5 sequential conditions with an interval of 12 seconds between conditions: baseline (n = 15), HNCS (n = 15), and 3 blocks of recovery after removing HNCS (3 times n = 15). Heterotopic noxious counterstimulation was produced by placing an ice pack on the contralateral forearm for 2 minutes (surface temperature about −13°C). Shock pain was rated after the last shock of each experimental block. Cold pain was also rated at the end of the HNCS block. The HNCS effect on the RIII was calculated by subtracting the mean RIII-reflex amplitude of the HNCS block from that of the baseline block.
2.7. RIII-reflex measure and analyses
Electromyography of the short head of the biceps femoris was recorded with a pair of surface electrodes (EL-508; Biopac Systems, Inc, Goleta, CA). The signal was amplified 1000 times, bandpass filtered (100-500 Hz), digitized, and sampled at 1000 Hz. Electromyographic data were analyzed using AcqKnowledge 4.1 (Biopac Systems, Inc). The raw EMG recordings were transformed using the root mean square with a window of 10 milliseconds. The resulting signal was integrated between 90 and 180 milliseconds after the stimulus onset to quantify RIII-reflex amplitude to each shock. These values were z-normalized using the mean and SD of the response across the 90 stimuli (z-score = [response i − mean of all 90 responses]/SD of all 90 responses). For the group analysis, 6 mean values were calculated from the z-scores; the mean control value was obtained by averaging the 15 control responses (single stimuli); the mean value of TS trials for each frequency was calculated by averaging the responses of the 3 trials, for each of the 5 stimuli in the series, ie, mean of the first, second, third, fourth, and fifth stimulus. Temporal summation of the RIII-reflex was calculated as the difference between the mean response to the fifth stimulus in the series and the mean response to the single-stimulus control. The slope of RIII-reflex TS was also calculated for each frequency. This was done by calculating the geometric mean of RIII-reflex amplitude across the 3 trial repetitions for each of the 5 stimulus rank (ie, stimulus 1-5 for each TS condition). A TS curve was obtained for each frequency and each subject, and the slope of the linear fit was then extracted and used as the TS slope.
2.8. Pain ratings
Participants rated shock pain intensity verbally using a visual numerical (0-100) pain rating scale displayed horizontally on the wall facing the participants with 2 verbal anchors at the left (0: no pain) and right extremities (100: extremely intense). Participants were instructed to rate pain after each trial. For the TS trials, they were instructed to rate the last (fifth) stimulus of the series. For the group analysis, 6 values were calculated; the mean control value was obtained by averaging the 15 control ratings; the mean value of TS trials for each frequency was calculated by averaging the responses for the 3 trials. For each frequency, the TS effect on pain was calculated as the difference between the mean rating of the control trials and the mean rating of the fifth stimulus. For presentation purposes and statistical analyses, pain ratings were converted to percent change compared with control trials.
2.9. Questionnaires
State and trait anxiety was assessed using the validated French version of Spielberger's State–Trait Anxiety Inventory.34 Pain catastrophizing was assessed using the French version of trait Pain Catastrophizing Scale.3 Subjects completed questionnaires before the pain tests. The elderly volunteers were screened for cognitive impairment using the Mini-Mental State Examination.7 A score above 26 was required for inclusion in the study (all recruited volunteers scored above 27). Depression was assessed using the French version of the Beck Depression Inventory1 for the young group and by the Geriatric Depression Scale for the elderly group.2,37 Participants were also asked to perform the similitudes and the digital symbol coding tests (subtest of WAIS-III).20
2.10. Statistical analyses
All results are expressed as mean ± SD. Data were analyzed using SPSS version 17 (SPSS Inc, Chicago, IL) with significance thresholds set to P ≤ 0.05. Basic group differences in questionnaire scores and pain/RIII thresholds were assessed using independent 2-sample t tests. Pain ratings were compared between groups for the control and the 5 TS frequencies (control, 0.17, 0.33, 0.66, 1, and 2 Hz) using a mixed-model analysis of variance (ANOVA), with Group (2) as a between-subject factor and Frequency (6) as a within-subject factor. The modulation of the RIII-reflex amplitude was also assessed using a mixed-model ANOVA with Group (2) as a between-subject factor and Frequency (5) and Stimulus rank (first, second, third, fourth, and fifth) (5) as within-subject factors. A Group (2) × Frequency (5) ANOVA was also performed to compare the mean slope of RIII-reflex TS across frequencies. For all analyses on RIII-reflex amplitude, 5 elderly subjects were excluded because of extreme values (>mean + 3 SD) and because no simple transformation could normalize the distribution. Analysis of variance was also performed including those subjects and applying the Greenhouse–Geisser correction. To further insure that we would not miss an effect (type II error), nonparametric analyses including the 5 excluded subjects were also performed. A Friedman test was performed to test the effect of frequency on pain rating and RIII-reflex in each group. A Mann–Whitney U test was also performed (all subjects) to compare the 2 groups on the TS effects. These additional analyses confirmed the results. For each ANOVA, planned contrasts were used to test a priori hypotheses and decompose significant effects of frequency between groups. Sphericity was tested using Mauchly test, and type I error was controlled by adjusting the degrees of freedom using the Greenhouse–Geisser correction. Correlations were assessed using Pearson r correlation.
3. Results
3.1. Participant characteristics
Characteristics of participants are reported in Table 2. Groups were comparable on education, pain catastrophizing, depression, state and trait anxiety, the similitude test, and RIII-reflex threshold. However, elders showed a lower pain threshold (t(34.2) = 2.3; P = 0.028) and lower scores for the digital symbol coding test (t(40.3) = 2.3; P = 0.028) compared with younger individuals. Table 2 also includes the analgesic effects produced by HNCS in the same participants, as previously reported.19
3.2. Heterotopic noxious counterstimulation
Results on HNCS analgesia were reported previously.19 A summary is provided in Table 2. These results were used for the correlation analysis below.
3.3. Temporal summation of pain
Mean pain ratings are reported in Table 3. Mean pain ratings of single-stimulus control trials were not significantly different between the 2 age groups (t(43) = 1.6, P = 0.12), indicating that individual adjustment of stimulus intensity based on RIII-reflex threshold yielded comparable pain intensity. However, pain ratings for the single-stimulus control trial progressively increased from the third control stimulus and for subsequent trials (Ps < 0.04), although no group difference was observed (P = 0.16). As for the TS effect (Fig. 2), pain increased gradually and significantly with the increase in stimulus frequency (main effect of Intensity: F(1.2,53.5) = 28.1, P < 0.001, η2 = 0.39, observed power = 1.0). However, the frequency effect was not significantly different between groups (interaction: F(1.2,53.5) = 0.11, P = 0.79, η2 = 0.003, observed power = 0.06) (Fig. 2). For both groups (pooled data), planned contrasts showed pain TS at a frequency of 0.17 Hz (compared with the single-stimulus control trial), with increasing effects at higher frequencies (for all successive contrasts: Ps < 0.03). Considering the progressive increase in pain ratings reported above for the single-stimulus control trials, we confirmed that TS effects remained significant after controlling for this nonspecific temporal change using a covariance analysis. Indeed, all effects remained significant (Ps < 0.04).
Table 3.
Pain ratings and RIII-reflex amplitude.
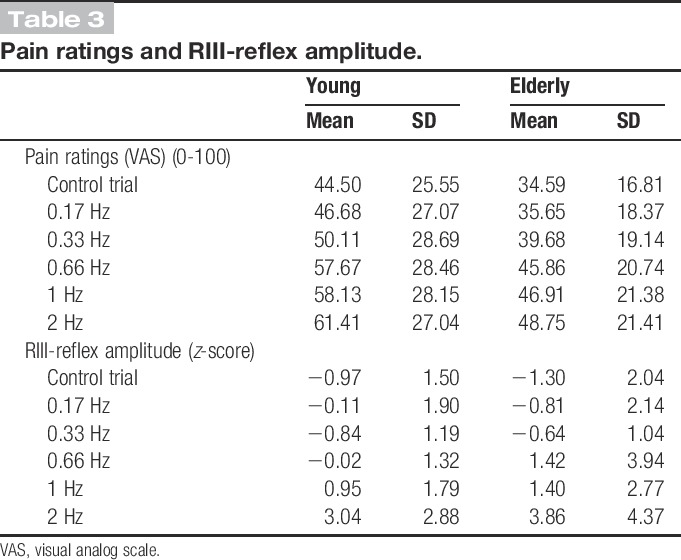
Figure 2.
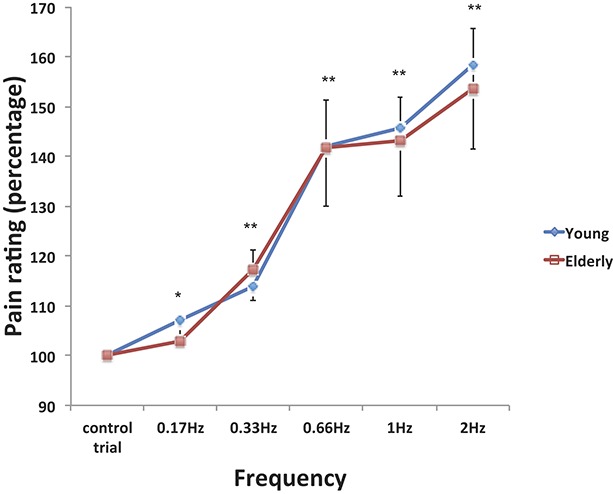
Temporal summation of pain. The plot represents a comparison of pain ratings (y axis) of young and elderly participants relative to the single-stimulus control condition (100%) after the 5 stimulations administered at each frequency tested. Mean values and SDs of absolute pain ratings are reported in Table 3. There was a significant effect of frequency and a significant increase for each condition relative to the control trials. However, the effect was comparable between groups (interaction P = 0.79) (planned contrasts with control trials: *P < 0.05, **P < 0.01 for pooled data from both groups; see main text for detailed statistical results).
3.4. Temporal summation of RIII responses
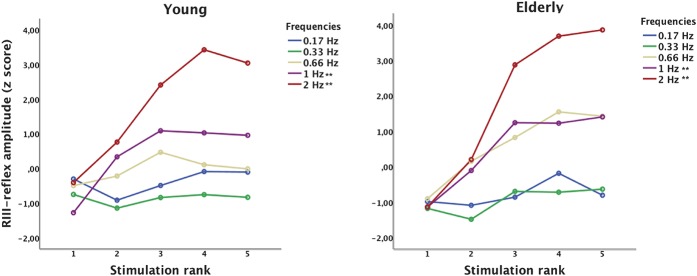
Mean z-scores of RIII-reflex amplitude for the different conditions and groups are reported in Table 3. The mean RIII-reflex amplitude for the single-stimulus control trial was not significantly different between the 2 age groups (t(38) = 0.57, P = 0.56). However, it progressively decreased during the course of the experiment from the eighth trial and for subsequent trials (Ps < 0.01), although no group difference was shown (P = 0.81). An individual example is also presented in Figures 3A, B, showing a TS effect at 2 Hz. In this representative example, RIII-reflex amplitude progressively increased with stimulus repetition, although it saturated at the fourth repetition. As for group effects, a clear TS was observed for some of the frequencies, as illustrated in Figure 4. To examine these effects, RIII-reflex amplitude was compared across groups, frequencies, and stimulus rank. RIII-reflex amplitude increased with frequency (main effect: F(2.1,78.8) = 14.2, P < 0.001, η2 = 0.27, observed power = 0.99). RIII-reflex amplitude also increased significantly from the first to the fifth stimulus of the series (main effect of stimulus rank: F(1.2,46.4) = 15.4, P < 0.001, η2 = 0.28, observed power = 0.98), and this effect was significantly greater at higher frequencies (frequency × stimulus rank interaction: F(4.1,154.8) = 9.44, P = < 0.001, η2 = 0.19, observed power = 1.0), indicating TS of RIII-reflex. However, RIII-reflex amplitude was not significantly different between groups across frequencies or stimulus rank (group × frequency interaction: F(2.1,78.8) = 0.43, P = 0.65; group × stimulation rank interaction: F(1.2,46.4) = 0.86, P = 0.38, η2 = 0.002, observed power = 0.16). In addition, the TS effect characterized by the interaction between stimulus rank and frequency was not affected by the age group (3-way interaction: F(4.1,154.8) = 0.67, P = 0.61, η2 = 0.001, observed power = 0.21). Considering the progressive decrease in RIII-reflex amplitude reported above for the single-stimulus control trials, we confirmed that TS effects remained significant after controlling for this nonspecific temporal change using a covariance analysis. Again, all effects remained significant (Ps < 0.001).
Figure 3.
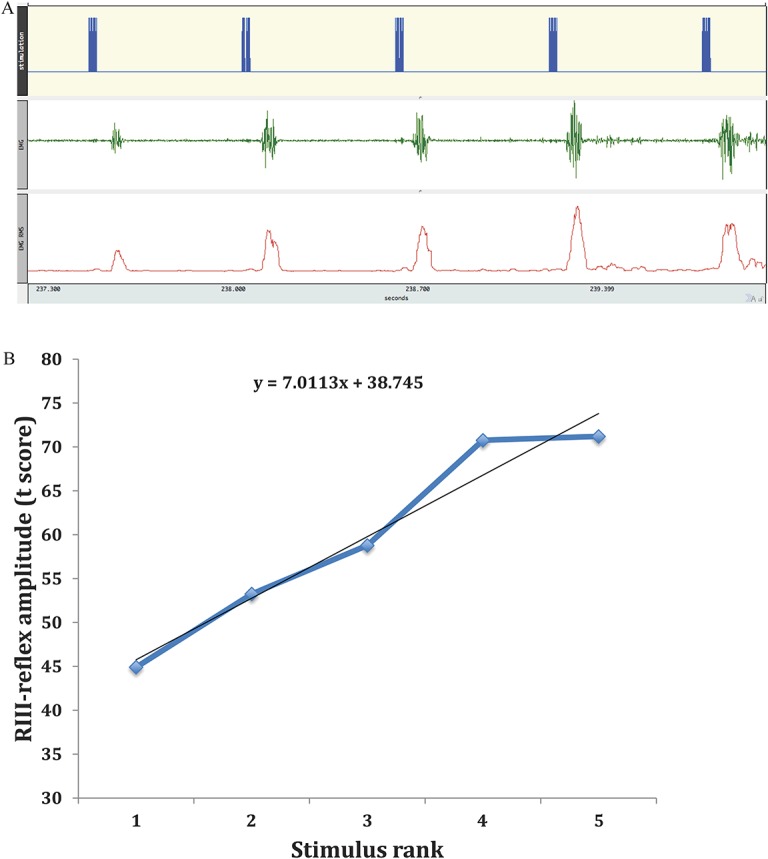
Temporal summation (TS) of the RIII-reflex. (A) An individual example of a raw recording of the RIII-reflex showing TS at 2 Hz. The top row indicates the timing of the electrical stimulation. The second row shows the raw electromyographic signal, where a typical RIII-reflex is observed beginning at ∼90 milliseconds after each stimulus onset. The third row represents the root mean square of the electromyographic signal used to measure RIII-reflex amplitude. (B) In this graph, RIII-reflex amplitude is plotted using the geometric mean of the 3 trials at 2 Hz in the same subject shown in (A). The black line represents the linear best fit of the curve from which the TS slope was calculated. Note that responses are reported here as mean t-scores rather than z-score for display purposes only (ie, t-score = z-score (10 + 50); this has no effect on the inference tests) (see main text for detailed statistical results).
Figure 4.
Temporal summation of the RIII-reflex for the 5 frequencies, for young and elders. RIII-reflex amplitude increased with frequency. It also increased from the first to the fifth stimulus of the series, and this effect was significantly greater at higher frequencies. However, RIII-reflex amplitude was not significantly different between groups across frequencies or stimulus rank. In addition, the temporal summation effect characterized by the interaction between stimulus rank and frequency was not affected by the age group (**Ps < 0.01 for pooled data from both groups; see main text for detailed statistical results).
Analyses were also performed on the slope of the TS effect on RIII-reflex, as presented in Figure 5 (for calculations, see “RIII-reflex measure and analyses” section). The slope increased significantly with stimulus frequency (main effect: F(2.2,83.2) = 18.6, P < 0.001, η2 = 0.32, observed power = 1.0), but this effect did not differ between groups (interaction: F(2.2,83.2) = 0.98, P = 0.38, η2 = 0.025, observed power = 0.23). Planned contrasts revealed that the frequency effect was significant at 1 Hz and 2 Hz for both groups (pooled data) (Ps < 0.001). Although the observed slope tended to be larger for the older group at all frequencies except at 0.17 Hz, 2-sample t tests comparing groups at each frequency did not approach significance (all Ps > 0.16), confirming the lack of age effect.
Figure 5.
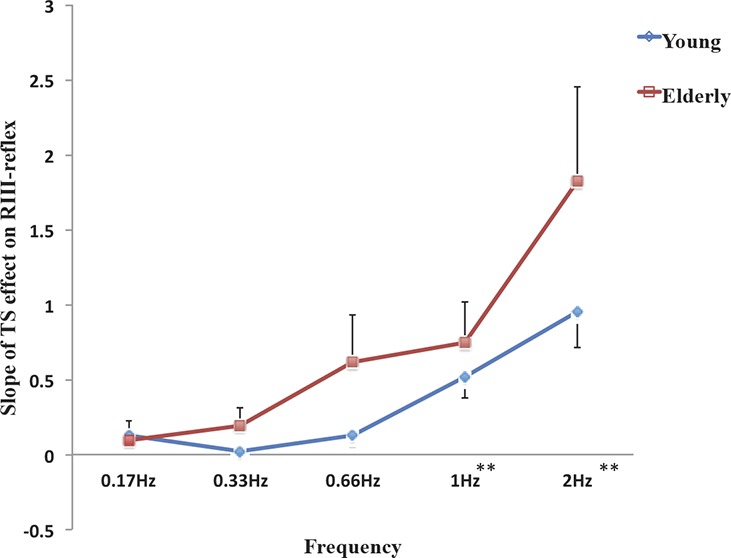
Slope of temporal summation effect. Comparison of RIII-reflex temporal summation slope for each frequency between groups. A significant effect of the frequency was observed, but this effect was not significantly different between groups. Error bars represent SEM (**P < 0.01 for pooled data from both groups; see main text for detailed statistical results).
3.5. Correlations
Correlations were performed between TS effects on pain and RIII-reflex across subjects. Significant positive correlation was found at 1 Hz (r = 0.435, P = 0.005) and 2 Hz (r = 0.354, P = 0.025; other frequencies: r < 0.19, P > 0.24). To examine the possibility that individual differences in TS would be related to changes in the efficacy of pain inhibitory processes due to aging, correlations between HNCS analgesia and TS effects on pain and RIII-reflex were performed. No correlation was observed between HNCS analgesia and TS effects for any of the frequencies on pain (rs < 0.07, Ps > 0.9) and RIII-reflex (rs < 0.13, Ps > 0.40).
4. Discussion
In this study, no evidence of age-related difference in pain and RIII-reflex TS was observed, infirming our first hypothesis. Indeed, robust TS of pain ratings occurred comparably in both young and elders. Similarly, robust TS of RIII-reflex was observed at frequencies of 1 and 2 Hz with no significant difference between groups. In contrast to our second hypothesis, individual differences in TS were not associated with age-related changes in HNCS analgesia. This suggests that mechanisms of pain and RIII-reflex TS are not affected by aging or the associated decrease in HNCS analgesia, when assessed with electrical stimulation of the sural nerve.
4.1. Age effects on temporal summation
Previous studies assessing age-related effects on pain TS report conflicting results. These studies can be sorted into 3 categories based on stimulus modality. The first category comprises studies using electrical stimulation that evokes the RIII-reflex and includes this study as well as 2 earlier studies. In one of the earlier study, elders showed pain TS at a lower frequency (from 0.2 Hz) compared with young participants (from 0.33 Hz).6 However, no group difference was observed in TS of RIII-reflex. In the second study, an age-related decrease of pain and RIII-reflex TS threshold at 2 Hz was shown but with a negligible quantitative impact.22 In this study, no age-related effect was observed for either pain TS or RIII-reflex TS. The common result between this study and the study by Farrell and Gibson is the lack of age effect on RIII-reflex TS. This suggests that enhancement of spinal nociceptive transmission and the associated motor response during TS is unaffected by aging. Like TS of the RIII-reflex, pain TS is thought to rely on a spinal mechanism that involves increased responses of second-order neurons.14 However, pain amplification may also occur in the brain independently of spinal processes during TS. This could explain that pain TS may occur without TS of the RIII-reflex, as reported in the earlier study.6 This could be examined using a measure of brain activity28,31 in addition to RIII-reflex recording. The lack of group differences in pain TS in this study is unlikely to be explained by a power issue (see curves overlap in Fig. 2). Besides, the discrepancy between these studies may be due to the different pain rating methods (numerical rating here and visual analog scale in Ref. 6). However, in a study on age differences in postoperative pain, age-related effects were scale dependent, where verbal descriptions of pain qualities were more sensitive than nonverbal measures of intensity.8 Therefore, the lack of age effect in this study is unlikely to be explained by lower sensitivity of the pain rating scale.
The second category of studies on aging and TS comprises 2 studies using mechanical stimulation.16,24 These studies reported no effect of age on pain TS regardless of the stimulation site, which is consistent with the present results.
The third category includes 3 studies using noxious heat stimulation.4,16,24 In these studies, pain TS was enhanced in elders when heat was applied on the forearm. However, 2 of these studies showed less or comparable TS between young and elders when heat was applied on the lower limb,10,24 suggesting a site-dependent effect. This is consistent with a similar site-dependent effect on heat pain threshold in elders.17 These site-dependent effects could be explained by subclinical axonopathy, more frequently observed in the lower limb in elders.29 Another study reported a lower temperature threshold for TS in elders, in which pain TS was observed at 47°C, 50°C and 53°C, whereas in young participants, pain TS was observed at 53°C only.4 This is also consistent with increased TS in elders. Altogether, these studies on the effect of aging on TS show quite mixed results. These discrepancies may reflect the multiplicity of physiological mechanisms underlying aging and TS, which may or may not be involved during a specific TS protocol, depending on the methods used.
4.2. Possible mechanisms of temporal summation
In previous studies, experimental protocols for the investigation of TS involved different stimulus modalities, which activate different primary nociceptive afferents. Noxious heat stimulation protocols activate Aδ and C fibers, but more predominantly C fibers. Electrical stimulation is a nonspecific stimulation that potentially activates all types of fibers with smaller nonmyelinated C fibers being recruited at higher intensity. However, electrical stimulation allows the measurement of the RIII-reflex, which latency corresponds to the activation of Aδ fibers.26 Although C fibers do not contribute directly to the RIII-reflex, they may change the excitability of neurons also involved in the production of RIII-reflex TS.27 Mechanical stimuli as used in TS studies activate skin and deeper tissues and may activate Aδ and C fibers. The differential activation of nociceptive fibers by different modalities may therefore explain some of the discrepancies reported earlier, but it remains challenging to associate age effects with the function of specific fibers without a selective stimulus. Nevertheless, there are some indications that the function of specific fiber groups may be affected by age, leading to selective age-related changes in pain perception or modulation. For instance, previous studies reported peripheral changes in the aging somatosensory system where older adults likely depend more on unmyelinated C fibers than myelinated Aδ fibers for sensory functions.12,32
Besides, TS of second pain from repetitive heat stimulation is thought to rely on C fibers.33 Thus, the age-related increase in heat pain TS observed in 3 studies may depend on spinal processes more specifically driven by the activation of C fibers.4,16,24 Consistent with this, protocols that involve the activation of Aδ fibers more predominantly16,19,24 did not report age-related changes in TS. The RIII-reflex TS was comparable between groups in the 2 studies performed with these methods, including this study and the study by Farrell and Gibson.6
In addition, animal studies showed a reduction of skin nociceptors and a slowing of conduction velocity with aging in rats.30 In humans, several changes were observed with aging in a microneurographic study, including a decreased ratio of mechanoresponsive to mechanoinsensitive nociceptors, increased number of fibers with spontaneous activity, peripheral sensitization in some fibers, and fibers that lost sensory function.21 All these changes may also contribute to the effect of age on TS in a complex manner and to discrepancies between studies.
Concerning the role of descending modulatory pathways, several studies reported reduced endogenous inhibition of pain in elders.5,13,19,25,35 In this study, we examined whether the previously reported decrease in HNCS analgesia19 was associated with increased TS. In contrast to our hypothesis, no age-related change in TS was observed for either pain or RIII-reflex. In addition, the decrease in HNCS analgesia in elders was not associated with individual differences in TS. This indicates that alteration of mechanisms underlying HNCS analgesia does not lead to increased TS. However, this does not exclude the possibility that increased TS of heat pain, as reported in previous studies,4,16,24 may be related to the alteration of mechanisms underlying HNCS analgesia (eg, diffuse noxious inhibitory control) or other pain-modulatory pathways. This remains to be clarified in future studies.
4.3. Study limitations
A basic limitation of this study is the possible bias in the selection of participants in the healthy elderly group. The elders were recruited mostly through a registry of healthy individuals at our Geriatric Research Center. They were generally well educated, active, and free of disease, which may not be an accurate reflection of the older population. This is a limitation inherent to most cross-sectional studies of healthy aging comparing the target population with younger controls. A longitudinal design would be ideal, but this obviously poses major feasibility difficulties. Another limitation is the use of a single stimulation modality. More studies varying stimulus modalities and sites are needed to understand age-related changes in pain TS and their relation to pain-modulatory mechanisms.
5. Conclusions
This study is the first that investigates the relationship between age-related changes in TS and the antinociceptive effects of HNCS, using a measure of spinal nociceptive transmission. Results show no age-related difference in TS on either spinal nociceptive transmission or pain perception. In the same participants, we previously showed an age-related effect on HNCS-induced reduction of pain and RIII-reflex. Combined with previous studies on heat pain TS and HNCS analgesia, the present results suggest that aging is accompanied by reduced efficacy of inhibitory processes and preserved facilitation of pain and spinal nociceptive responses.
Conflict of interest statement
The authors have no conflicts of interest to declare.
This study was funded by an operating Grant from the Canadian Institutes of Health Research (MOP-130341) held by P. Rainville. R. Marouf was supported by graduate studentships from the “Groupe de recherche sur le système nerveux central” and the “Université de Montréal.” The contribution of M. Piché is supported by the UQTR Research Chair in Pain Neurophysiology.
Acknowledgements
The authors thank Mr Stephane Caron for his help with data collection.
Footnotes
Sponsorships or competing interests that may be relevant to content are disclosed at the end of this article.
References
- [1].Bourque P, Beaudette D. Etude psychométrique du questionnaire de dépression de Beck auprès d'un échantillon d'étudiants universitaires francophones [in French]. Revue Canadienne des Sci du Comportement 1982;14:211–18. [Google Scholar]
- [2].Bourque P, Blanchard L, Vézina J. Étude psychométrique de l'Échelle de dépression gériatrique [in French]. Revue Canadienne du Vieillissement 1990;9:348–55. [Google Scholar]
- [3].French DJ, Noël M, Vigneau F, French JA, Chantel P, Evans RT. L'Échelle de dramatisation face à la douleur PCS-CF Adaptation canadienne en langue française de l'échelle. Pain Catastrophizing Scale. Revue canadienne des sciences du comportement 2005;37:181–92. [Google Scholar]
- [4].Edwards RR, Fillingim RB. Effects of age on temporal summation and habituation of thermal pain: clinical relevance in healthy older and younger adults. J Pain 2001;2:307–17. [DOI] [PubMed] [Google Scholar]
- [5].Edwards RR, Fillingim RB, Ness TJ. Age-related differences in endogenous pain modulation: a comparison of diffuse noxious inhibitory controls in healthy older and younger adults. PAIN 2003;101:155–65. [DOI] [PubMed] [Google Scholar]
- [6].Farrell M, Gibson S. Age interacts with stimulus frequency in the temporal summation of pain. Pain Med 2007;8:514–20. [DOI] [PubMed] [Google Scholar]
- [7].Folstein MF, Folstein SE, McHugh PR. “Mini-mental state”. A practical method for grading the cognitive state of patients for the clinician. J Psychiatr Res 1975;12:189–98. [DOI] [PubMed] [Google Scholar]
- [8].Gagliese L, Katz J. Age differences in postoperative pain are scale dependent: a comparison of measures of pain intensity and quality in younger and older surgical patients. PAIN 2003;103:11–20. [DOI] [PubMed] [Google Scholar]
- [9].Gibson SJ, Farrell M. A review of age differences in the neurophysiology of nociception and the perceptual experience of pain. Clin J Pain 2004;20:227–39. [DOI] [PubMed] [Google Scholar]
- [10].Harkins SW, Davis MD, Bush FM, Kasberger J. Suppression of first pain and slow temporal summation of second pain in relation to age. J Gerontol A Biol Sci Med Sci 1996;51:M260–265. [DOI] [PubMed] [Google Scholar]
- [11].Helme RD, Gibson SJ. The epidemiology of pain in elderly people. Clin Geriatr Med 2001;17:417–31; v. [DOI] [PubMed] [Google Scholar]
- [12].Jacobs JM, Love S. Qualitative and quantitative morphology of human sural nerve at different ages. Brain 1985;108:897–924. [DOI] [PubMed] [Google Scholar]
- [13].Lariviere M, Goffaux P, Marchand S, Julien N. Changes in pain perception and descending inhibitory controls start at middle age in healthy adults. Clin J Pain 2007;23:506–10. [DOI] [PubMed] [Google Scholar]
- [14].Latremoliere A, Woolf CJ. Central sensitization: a generator of pain hypersensitivity by central neural plasticity. J Pain 2009;10:895–926. [DOI] [PMC free article] [PubMed] [Google Scholar]
- [15].Lautenbacher S. Experimental approaches in the study of pain in the elderly. Pain Med 2012;13(suppl 2):S44–50. [DOI] [PubMed] [Google Scholar]
- [16].Lautenbacher S, Kunz M, Strate P, Nielsen J, Arendt-Nielsen L. Age effects on pain thresholds, temporal summation and spatial summation of heat and pressure pain. PAIN 2005;115:410–18. [DOI] [PubMed] [Google Scholar]
- [17].Lautenbacher S, Strian F. Similarities in age differences in heat pain perception and thermal sensitivity. Funct Neurol 1991;6:129–35. [PubMed] [Google Scholar]
- [18].Le Bars D, Villanueva L, Bouhassira D, Willer JC. Diffuse noxious inhibitory controls (DNIC) in animals and in man. Patol Fiziol Eksp Ter 1992;4:55–65. [PubMed] [Google Scholar]
- [19].Marouf R, Caron S, Lussier M, Bherer L, Piche M, Rainville P. Reduced pain inhibition is associated with reduced cognitive inhibition in healthy aging. PAIN 2014;155:494–502. [DOI] [PubMed] [Google Scholar]
- [20].McLean JE, Kaufman AS. Base rates of WAIS-R subtest scatter as a guide for clinical and neuropsychological assessment. J Clin Psychol 1989;45:919–26. [DOI] [PubMed] [Google Scholar]
- [21].Namer B, Barta B, Orstavik K, Schmidt R, Carr R, Schmelz M, Handwerker HO. Microneurographic assessment of C-fibre function in aged healthy subjects. J Physiol 2009;587:419–28. [DOI] [PMC free article] [PubMed] [Google Scholar]
- [22].Neziri AY, Andersen OK, Petersen-Felix S, Radanov B, Dickenson AH, Scaramozzino P, Arendt-Nielsen L, Curatolo M. The nociceptive withdrawal reflex: normative values of thresholds and reflex receptive fields. Eur J Pain 2010;14:134–41. [DOI] [PubMed] [Google Scholar]
- [23].Piche M, Bouin M, Arsenault M, Poitras P, Rainville P. Decreased pain inhibition in irritable bowel syndrome depends on altered descending modulation and higher-order brain processes. Neuroscience 2011;195:166–75. [DOI] [PubMed] [Google Scholar]
- [24].Riley JL, III, Cruz-Almeida Y, Glover TL, King CD, Goodin BR, Sibille KT, Bartley EJ, Herbert MS, Sotolongo A, Fessler BJ, Redden DT, Staud R, Bradley LA, Fillingim RB. Age and race effects on pain sensitivity and modulation among middle-aged and older adults. J Pain 2013. [DOI] [PMC free article] [PubMed] [Google Scholar]
- [25].Riley JL, III, King CD, Wong F, Fillingim RB, Mauderli AP. Lack of endogenous modulation and reduced decay of prolonged heat pain in older adults. PAIN 2010;150:153–60. [DOI] [PMC free article] [PubMed] [Google Scholar]
- [26].Rossi A, Zalaffi A, Decchi B. Interaction of nociceptive and non-nociceptive cutaneous afferents from foot sole in common reflex pathways to tibialis anterior motoneurones in humans. Brain Res 1996;714:76–86. [DOI] [PubMed] [Google Scholar]
- [27].Schouenborg J, Sjolund BH. Activity evoked by A- and C-afferent fibers in rat dorsal horn neurons and its relation to a flexion reflex. J Neurophysiol 1983;50:1108–21. [DOI] [PubMed] [Google Scholar]
- [28].Staud R, Craggs JG, Robinson ME, Perlstein WM, Price DD. Brain activity related to temporal summation of C-fiber evoked pain. PAIN 2007;129:130–42. [DOI] [PMC free article] [PubMed] [Google Scholar]
- [29].Stevens JC, Choo KK. Temperature sensitivity of the body surface over the life span. Somatosens Mot Res 1998;15:13–28. [DOI] [PubMed] [Google Scholar]
- [30].Taguchi T, Ota H, Matsuda T, Murase S, Mizumura K. Cutaneous C-fiber nociceptor responses and nociceptive behaviors in aged Sprague-Dawley rats. PAIN 2010;151:771–82. [DOI] [PubMed] [Google Scholar]
- [31].Tran TD, Wang H, Tandon A, Hernandez-Garcia L, Casey KL. Temporal summation of heat pain in humans: evidence supporting thalamocortical modulation. PAIN 2010;150:93–102. [DOI] [PMC free article] [PubMed] [Google Scholar]
- [32].Verdu E, Ceballos D, Vilches JJ, Navarro X. Influence of aging on peripheral nerve function and regeneration. J Peripher Nerv Syst 2000;5:191–208. [DOI] [PubMed] [Google Scholar]
- [33].Vierck CJ, Jr, Cannon RL, Fry G, Maixner W, Whitsel BL. Characteristics of temporal summation of second pain sensations elicited by brief contact of glabrous skin by a preheated thermode. J Neurophysiol 1997;78:992–1002. [DOI] [PubMed] [Google Scholar]
- [34].Vigneau F, Cormier Stephanie. L'inventaire d'anxiété situationnelle et de trait d'anxiété (IASTA-Y): structure factorielle et biais linguistique. Can J Behav Sci 2009;41:115–20. [Google Scholar]
- [35].Washington LL, Gibson SJ, Helme RD. Age-related differences in the endogenous analgesic response to repeated cold water immersion in human volunteers. PAIN 2000;89:89–96. [DOI] [PubMed] [Google Scholar]
- [36].Willer JC. Comparative study of perceived pain and nociceptive flexion reflex in man. PAIN 1977;3:69–80. [DOI] [PubMed] [Google Scholar]
- [37].Yesavage JA, Brink TL, Rose TL, Lum O, Huang V, Adey M, Leirer VO. Development and validation of a Geriatric Depression Screening Scale: a preliminary report. J Psychiatr Res 1982;17:37–49. [DOI] [PubMed] [Google Scholar]


