Abstract
The use of fluorogenic compounds in cell and molecular biology has increased in both frequency and range of applications. However, such compounds may introduce artifacts in intracellular fluorescence and cell number estimations as a consequence of interaction with exogenous stimulants, necessitating the use of adequate controls for accurate measurements and valid conclusions. Using calcein acetoxymethyl ester (AM) in combination with various exogenous cellular treatments, we report that the standard practice of direct normalization of experimental values to controls is insufficient for fluorogenic measurements. Treatments applied to cells may influence intracellular conversion of the fluorogenic compound, thereby enhancing or decreasing fluorescence relative to controls. We hereby encourage caution and recommend normalization of cellular fluorescence within each treatment group before comparison to controls.
Keywords: cellular fluorescence, calcein, cell-based assays, biochemical compounds, prostate cancer cells
INTRODUCTION
Fluorescent probes for living cells have become valuable tools for cell biology and biochemistry. The emerging popularity of fluorescence-based assays can be ascribed to the broad range of biochemical applications, the development of cost-effective fluorescence-measuring devices (plate readers and robotics), the ability to measure cell fates for longer intervals, and their ease of use relative to hazardous radioisotopes with inherent regulatory compliance issues and exposure risk.
Some of the most commonly used groups of compounds for tracing living cells are ester derivatives of acetoxymethyl (AM) and acetate. Calcein AM (Invitrogen/Molecular Probes) is a non-fluorescent, uncharged molecule that is freely permeable to the plasma membrane of viable cells, which is converted to a fluorescent form, calcein, upon cleavage of the lipophilic blocking groups by nonspecific esterases in the cytoplasm. Uses include cell proliferation, cytotoxicity, motility, drug delivery, measurement of intracellular communication, mitochondrial permeability, oxidative activity or intracellular pH, and visualization of cellular structures with fluorescence microscopy, among others [1–8].
Because of the diverse uses of fluorogenic compounds, there may be artifacts associated with intracellular fluorescence estimates depending on the assay and experimental conditions, such that direct comparison of treated to control may be insufficient. For example, calcein fluorescence has been reported to be influenced by metal ions and electrochemically generated by-products [9], and hence it is plausible that other cell treatments have similar effects. While procedures have been outlined to monitor and account for calcein release or leakage [3], traditional measurements of calcein fluorescence have failed to account for treatment- or assay-induced modifications in cellular fluorescence. Using calcein AM, an archetype of fluorescein acetoxymethyl derivatives, we demonstrate the significance of treatment-induced modification of intracellular fluorescence.
MATERIALS AND METHODS
Cell culture and reagents
Prostate cancer cells, including PC-3, LNCaP, and its derivatives, C4-2 and C4-2B, were cultured in T-medium (Invitrogen/Life Technologies, Inc, Gaithersburg, MD) with 5% FBS and 1% Penicillin/Streptomycin at 37°C in a humidified chamber under 5% CO2 as described previously [10–12]. Bone marrow endothelial cells (BMEC) [13], were cultured in Dulbecco’s Modified Eagle Medium (DMEM; Invitrogen/Life Technologies) with 10% FBS. Calcein AM was purchased from Invitrogen/Molecular Probes (Carlsbad, CA) and used at a concentration of 125 nM for analysis by flow cytometry, and 2 μM for all other assays. For all experiments involving calcein labeling, cells were incubated with Calcein AM for 30 min followed by washing with PBS before subsequent analysis or procedures. Cells labeled with calcein AM were lysed using 0.5% (v/v) NP-40, and diluted 1:10 into a 96-well microplate before measuring fluorescence, using a FLUOstar Optima fluorescent plate reader (BMG Labtech, Inc., Durham NC), unless otherwise indicated. For timed-course analysis, 1 × 10⁵ cells were seeded in 35 mm tissue culture dishes 24 h before labeling with calcein AM for 30 min. Subsequently images were captured using fluorescent microscopy or cells were lysed at designated time points (0.5 h, 2 h, 6 h, 12 h, 24 h or 36 h after calcein loading) to measure fluorescence intensity over time.
Transforming growth factor-beta1 (TGF-β1) was purchased from R&D Systems and used at a concentration of 5 ng/mL. Poly-L-lysine was purchased from Invitrogen (Carlsbad, CA), and used in accordance with manufacturer’s instructions. Poly-HEMA (Poly(2-hydroxyethyl methacrylate)) was obtained from Sigma-Aldrich (St Louis, MO). For coating, 24-well plates (Corning/Costar) were covered with a 1:10 dilution of Poly-L-lysine at a final concentration of 0.01% (v/v) for 30 min, or Poly-HEMA at 12 mg/mL, which was allowed to dry completely, and subsequently washed with PBS. Hyaluronidase (H-1136) and hyaluronic acid (H-1751) were purchased from Sigma-Aldrich and used at a concentration of 16 U/mL, and 10 μg/cm2, respectively. Voltage-sensitive sodium channel (VSSC) inhibitors, ICM-I-136, ICM-55W [14, 15] were used at a concentration of 40 μM.
Cell adhesion assays
Adhesion assays were performed as described previously with the substitution of calcein AM for tritiated thymidine [16] in 24-well plates. BMEC were seeded into 24-well plates (Corning) and grown to confluence. Subconfluent monolayers of prostate cancer cells were labeled with calcein AM green in T-medium. Cells were lifted off the plate non-enzymatically using disadhesion medium (2.5 mM EDTA/PBS/0.1% glucose), centrifuged to pellet, and resuspended in T-medium alone or supplemented with 1% TCM (serum replacement), triturating to a single-cell suspension. Viable cells were counted using trypan-blue exclusion and confirmed for calcein AM green fluorescence using a Nikon 2000TE inverted fluorescent microscope. 1 × 10⁵ viable cells were seeded onto confluent lawns of BMEC into a 24-well plate while the same number of “input” control cells for each experimental group were seeded into empty wells. Cells were incubated at 37°C for 2 h, and subsequently washed twice with 0.5 ml 1 × PBS followed by gentle rotation at 100 rpm on an orbital shaker at room temperature for 2 min. Cells were then lysed, triturating thoroughly. Fluorescence intensity was measured at an emission wavelength of 530 nm using an excitation wavelength of 485 nm in a FluoStar Optima plate reader. Test compounds and treatments were added for time periods appropriate to each assay: Treatment with VSSC inhibitors, or vehicle (0.1% DMSO in 100% ethanol delivered at 1/1000 v/v) was done for five days in complete T-medium before calcein AM labeling [14, 15]. Cells were treated with hyaluronidase or vehicle (PBS) for 30 min, or TGF-β1 or vehicle (4 mM HCL containing 1 mg/mL BSA), for 24 h in T-medium containing 1% (v/v) TCM after 24 h of culture in T-medium containing 1% TCM, and then labeled with calcein AM. For analysis of the effects of Poly-L-lysine and Poly-HEMA on calcein fluorescence, cells seeded onto 24-well plates were lysed without washing, after capturing images of representative fields. Data were analyzed in three ways: 1) Direct comparison of treated to control based on the average fluorescence value of adherent cells (“uncorrected adherent”), performed by normalizing treated samples to vehicle, with vehicle assigned to ‘1’. 2) Direct comparison of average fluorescence values for the total sample of 1 ×10⁵ cells among treatment groups (“total fluorescent sample”) to examine treatment-altered fluorescence, and 3) Normalization of the fluorescence value of adherent cells to the fluorescence value of the total sample of cells for each treatment group (by dividing the average fluorescence value of the adhered cells by that of the total sample or pool of 1 × 10⁵ cells) to obtain the fraction/percentage of adhered cells, followed by normalization of the fraction of adherent cells from the treatment group of interest to that of the vehicle control, properly corrected for treatment-induced variation in fluorescence (“corrected adherent”). Statistical analysis was conducted using Student’s t test for paired data at a confidence interval of at least 95%.
Fluorescence activated cell sorting (FACS)
FACS was used to analyze calcein fluorescence profiles after various treatments. Subconfluent cells were treated with VSSC antagonist/inhibitors or TGF-β1 in T-medium containing 1% TCM. Cells were PBS-washed, labeled with calcein AM, PBS-washed again, and harvested with disadhesion medium. Cells were fixed in 4% (v/v) paraformaldehyde for 1 hour on ice. Flow cytometry was performed using a FACSCalibur (Becton Dickinson, San Jose, CA) and cell fractions analyzed using CellQuest software (Becton Dickinson). Fluorescence values were plotted as average median fluorescence (ICM-I-136) or total cell number (TGF-β1) in M2, defined as the lower limit capturing the representative peak fluorescence of the cell population, identical for control and treated groups.
Statistical analysis
For each independent experiment, the summary value for the treated group was normalized to the vehicle control, and subsequently an average of the independent experiments and standard error was calculated from the normalized values. This approach was used to account for the inherent intra-assay variability associated with calcein AM labeling. For all experiments, statistical analysis was done using Student’s t test for paired data using original unnormalized values.
RESULTS
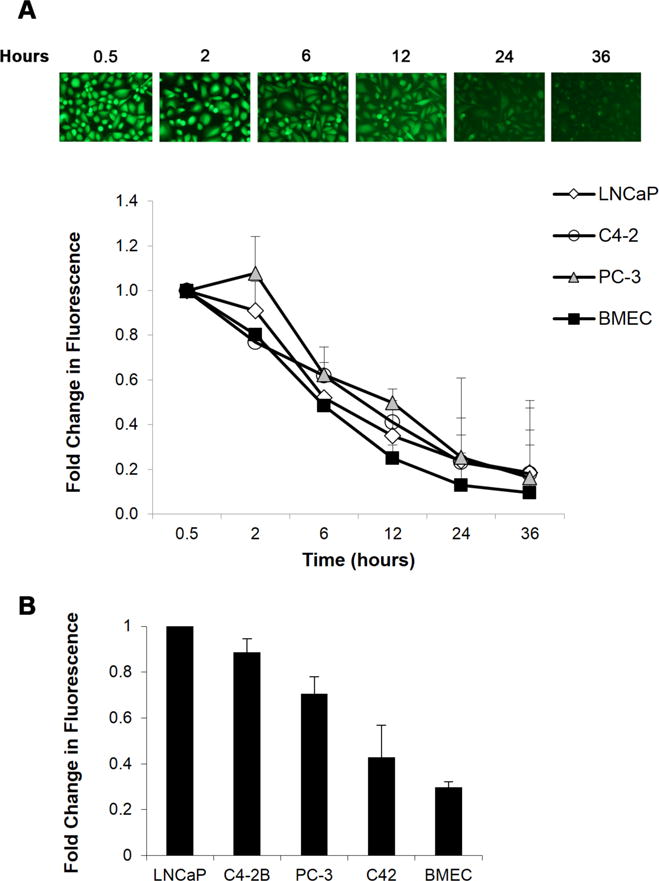
The stability of calcein fluorescence over time and among different cell lines is displayed in Figure 1. Prostate cancer cell lines: LNCaP and its isogenic sublines, the highly aggressive PC-3 cell line, and the human bone marrow endothelial cell line (BMEC) all showed progressive decreases in calcein fluorescence over time, with peak fluorescence observed 30 min (baseline) or 2 h after loading (Fig. 1A). Maximum calcein fluorescence intensity, measured 2 h after labeling, also varied among cell lines (Fig. 1B), even cells of the same lineage, with the greatest intracellular fluorescence in LNCaP cells.
Figure 1. Calcein fluorescence intensity is variable with time and cell type.

A. Subconfluent cell cultures were loaded with calcein AM and fluorescence microscopy (15×) was used to capture changes in intracellular calcein fluorescence over time (top). Calcein loaded cells were lysed at the respective time points and fluorescence intensity measured using a microplate reader. Data are normalized to total fluorescence 30 min after calcein loading (bottom). B. Calcein fluorescence intensity 2 h post-labeling was compared among several cell lines and normalized to LNCaP. Values and error bars represent the mean fold change and range of two independent experiments performed in duplicate.
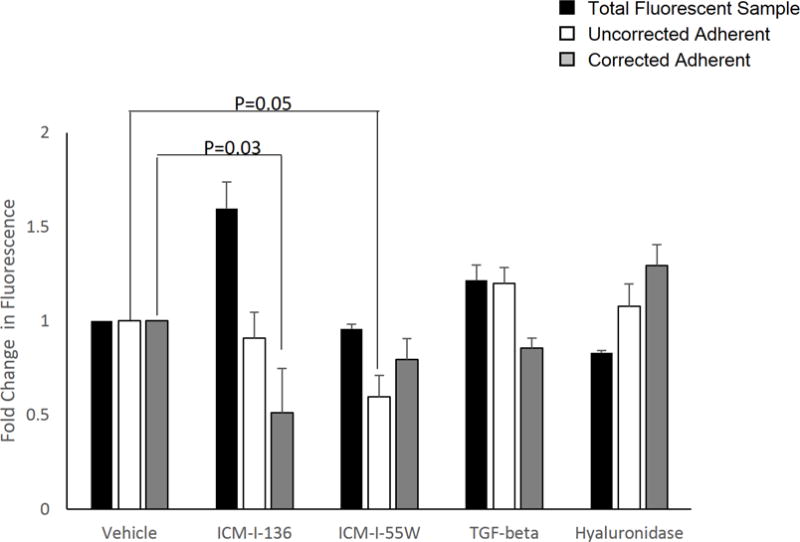
We questioned the assumption that biochemical treatment conditions are inconsequential to calcein loading in LNCaP or its metastatic subline, C4-2B, using VSSC inhibitors including ICM-I-136 and ICM-I-55W, and peptides or enzymes such as TGF-β1 and hyaluronidase (Fig. 2). When adhesion assays were performed by directly normalizing the fluorescence value of the treated adherent sample to that of the control or mock-treated sample (white bars; uncorrected adherent), adhesion was apparently decreased with ICM-I-136 treatment (9%), decreased with ICM-I-55W treatment (40%), and increased adhesion was observed after treatment with both TGF-β1 (20%), and hyaluronidase (8%). However, the fluorescence value of a sample of 1 × 10⁵ cells in each treatment group revealed a dramatic increase in fluorescence after treatment with ICM-I-136 (60%), a notable increase in fluorescence upon TGF-β1 treatment (22%), and decreased fluorescence after treatment with hyaluronidase (17%) when compared to the fluorescence of the respective vehicle control sample of 1 × 10⁵ cells (black bars; total fluorescent sample). Hence, it became necessary to perform a baseline normalization of the fluorescence of each treatment group to that of 1 × 10⁵ cells of the same treatment group in order to first obtain the percentage of adherent fluorescent cells before normalizing the treated group to its respective and similarly processed vehicle control, thereby capturing the true percentage of adherent cells (or fold-change in adhesion) after treatment. Using this method we found that adhesion to BMEC actually was decreased significantly with ICM-I-136 treatment (nearly 50%); a greater decrease in adhesion with TGF-β1 treatment was observed (15%); a more profound increase in adhesion after treatment with hyaluronidase (30%) was noted (gray bars) compared to the uncorrected results.
Figure 2. Soluble peptides and chemical inhibitors alter calcein fluorescence in a cell-based adhesion assay.

LNCaP cells or sublines were treated with VSSC inhibitors ICM-I-136 and ICM-I-55W, TGF-β1, hyaluronidase, or the respective vehicle, and labeled with calcein AM as described. Data were analyzed in three ways: (1) the fluorescence measurement of the treated adherent sample was normalized directly to that of the respective vehicle-treated adherent sample (uncorrected adherent, white bars), (2) the fluorescence measurement of the treated sample of 1 × 10⁵ cells was normalized to that of the respective mock or vehicle-treated sample in order to analyze the effect of the treatment on intracellular calcein fluorescence with a defined number of cells (total fluorescent sample, black bars), or (3) the fluorescence of each treated/mock-treated adherent sample was first normalized to its respective sample of 1 × 10⁵ cells (of the same treatment group) to obtain the percentage of adhered cells, and subsequently the percentage of adherent cells for the treatment group was normalized to that of the respective vehicle control to obtain fold change in adhesion (corrected adherent, gray bars). Values and error bars represent the mean fold change and standard error of three independent experiments performed in triplicate.
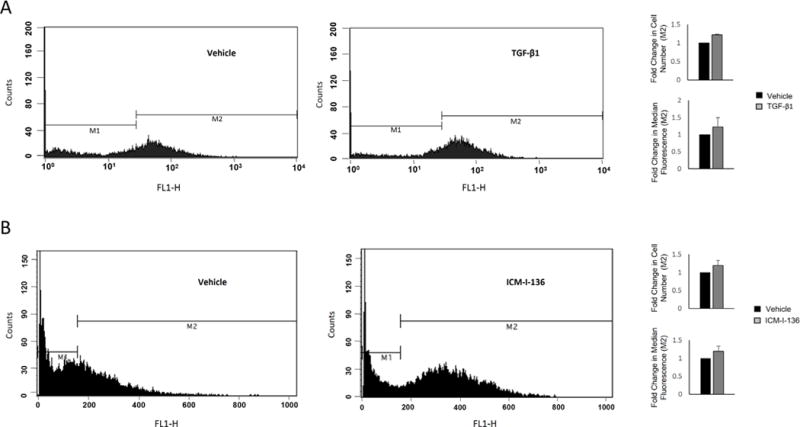
We continued analyzing the effect of cellular treatments on calcein fluorescence using FACS. Examination of TGF-β1-modulated fluorescence demonstrated an increase of 22% in fluorescence compared to vehicle, when considering both percentage of cells and median fluorescence in M2 (Fig. 3A). Similarly, there was a shift in M2 fluorescence when comparing vehicle with ICM-I-136 treatment, correlating with an increase of 17–19% with ICM-I-136 treatment (Fig. 3B).
Figure 3. Treatment-altered intracellular calcein fluorescence is evident after fluorescence activated cell sorting.

LNCaP prostate cancer cells were treated with TGF-β1 (A) or ICM-I-136 (B), and subjected to fluorescence activated cell sorting after calcein AM labeling to examine fluorescence intensity. Flow cytometry results depict shifts in the number of cells in M2. Bar graphs (right) show fold change in M2 fluorescence, based on percentage of fluorescent cells in M2, as well as median fluorescence intensity. Values and error bars represent the mean fold change and standard error or normalized range of at least two independent experiments.
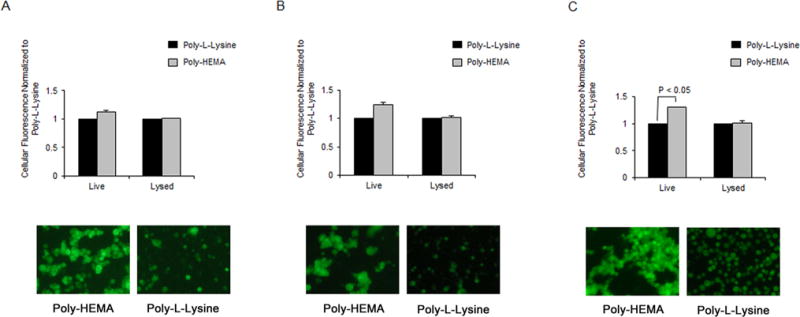
Lastly, we determined if intracellular calcein fluorescence was altered by cell morphology. Poly-HEMA and Poly-L-lysine were used as substrates to allow cells to assume a rounded or spread morphology, respectively. Cells seeded onto Poly-HEMA-coated dishes showed greater fluorescence intensity before lysis when compared to cells seeded and adhered onto Poly-L-lysine in all prostate cancer cell lines tested, with increases of 13%, 25%, and 30% in LNCaP (Fig. 4A), C4-2 (Fig. 4B), and PC-3 (Fig. 4C) cells respectively. Upon lysis, however, this difference in intracellular fluorescence was diminished. These results highlight a difference between intracellular calcein fluorescence on different substrates facilitating a rounded or spread morphology.
Figure 4. Calcein fluorescence is influenced by cell morphology.

LNCaP (A), C4-2 (B) and PC-3 (C) cells were seeded onto Poly-L-lysine or Poly-HEMA-coated wells after labeling with calcein AM, and incubated for 2 h before measuring fluorescence of lysed or intact cells. Fluorescent images of intact cells on Poly-L-Lysine and Poly-HEMA were captured, depicting one representative field (bottom). Values and error bars represent the mean fold change and standard error or range of two or more independent experiments.
DISCUSSION
Using calcein AM, we have shown the ability of exogenous biochemical treatments to modify intracellular fluorescence. When analyzing data from cell-based assays where cell number is a readout, the raw fluorescence value of all treatment and control groups should be standardized to the respective total fluorescent sample in order to generate an accurate fraction of fluorescent cells in each sample group. Alternatively, an estimate of cell number of the desired fluorescent fraction, x, can be calculated based on the fluorescence unit per cell value, which assumes equal fluorescence within the cell population:
Another alternative is direct assessment of cell number, using the fluorescent marker to identify and count cells rather than using the fluorescent readout for quantification. In addition to manual counting, this can be done using image editing software such as Adobe Photoshop or Volocity, where several images or fields of images captured are quantified by measuring pixel intensity of green objects to obtain a number or estimate of live cells per field. Additional software such as CellProfiler or Fluocell may be used as quantification tools or to generate cell counts and various measurements using fluorescence images of cell samples [17, 18].
Treatment-induced differences can be so dramatic as to alter the interpretation of the resulting data, so the trend is actually opposite of what was assumed initially through direct comparison to controls, or significant changes are under- or overestimated (Fig. 2, ICM-I-136 and I-55W) or erroneously calculated. Additionally, direct comparison of raw fluorescence values among experimental groups without first normalizing to the fluorescence of the total test sample/population can exaggerate inter-assay variation and error.
Cell morphology was an important fluorescence-altering factor, as intracellular fluorescence was greater in nonadherent or rounded cells as compared to adherent cells (Fig. 4). This might be attributed to a greater pool of free intracellular calcium in nonadherent cells. Interestingly, assay conditions also seemed to affect the magnitude of change induced by treatments. For example, the magnitude of ICM-I-136-induced alterations in calcein fluorescence was enhanced when prostate cancer cells were subjected to flow cytometry compared to cell fluorescence measured in the FluoStar microplate reader under the adhesion assay protocol using the same cell type (1.6-fold compared to 1.2-fold, Fig. 2 and Fig. 3). Similarly, fluorescence values for the C4-2B subline were higher with TGF-β1 treatment when measured with FACS analysis, compared to measurements obtained with FluoStar during the adhesion assay (data not shown). This may be a consequence of TGF-β-stimulated calcium influx [19] resulting in an increase of free intracellular calcium in more rounded, single, detached cells. Nonetheless, it highlights the potential for variation in intracellular fluorescence with different measurement tools or instruments.
The variability associated with calcein fluorescence necessitates thoughtful study design and preparation. Because calcein AM is a transient label it should be used only for short-term assays, as cells retain fluorescence very poorly by 24 h (Fig. 1A). As the cell cycle time for most of our cell lines varies between 36 h and 60 h [10, 12, 20], the decrease in intracellular calcein fluorescence is likely not due to a dilution effect as a consequence of increased cell number. However, because fluorescence profiles may differ in rapidly dividing cell lines, care should be taken to analyze the time course of calcein fluorescence when necessary. Additionally, the kinetics of the decreases in fluorescence intensity are affected by calcein leakage into the surrounding medium as well as differences in the level of intracellular sequestered calcium amongst cells. Such changes should be taken into consideration during experimental design and data analysis.
We have provided just a few examples of fluorescence modulators. However, other potential compounds and fluorescein modulators should be tested when using fluorescein derivatives. Furthermore, additional assays or technologies may alter calcein fluorescence. Accordingly, we observed a difference in calcein fluorescence after transfection of prostate cancer cells with an expression plasmid (pcDNA, data not shown).
In conclusion, we have observed that calcein conversion, and thus cellular fluorescence intensity, is impacted upon treatment with peptides and chemical compounds, and may be affected by cell morphology, cell type, or the nature of the assay itself. Other fluorescein derivatives in addition to calcein AM are likely to produce similar artifacts in intracellular fluorescence. Adequate and carefully selected fluorescence controls are crucial to preventing artifacts in intracellular fluorescence measurements.
Acknowledgments
The authors thank Alison M. Walls for her initial work determining loading concentrations of calcein AM for LNCaP cells. This work was supported in part by NIH CA-105435, NIH CA09142, DAMD 17-03-1-0043, NIH CA-98912, and The Center for Translational Cancer Research and University of Delaware Start-up funds.
Abbreviations
- AM
acetoxymethyl ester
- FACS
fluorescence activated cell sorting
- TGF-β1
transforming growth factor-beta1
- VSSC
voltage-sensitive sodium channel
- DMEM
Dulbeccos’s Modified Eagle Medium
- BMEC
bone marrow endothelial cells
- DMSO
dimethyl sulfoxide
- EDTA
ethylenediaminetetraacetic acid
Footnotes
Competing interests: The authors have declared that no competing interests exist.
References
- 1.Berggren S, Hoogstraate J, Fagerholm U, Lennernäs H. Characterization of jejunal absorption and apical efflux of ropivacaine, lidocaine and bupivacaine in the rat using in situ and in vitro absorption models. Eur J Pharm Sci. 2004;21:553–560. doi: 10.1016/j.ejps.2003.12.004. [DOI] [PubMed] [Google Scholar]
- 2.Bratosin D, Mitrofan L, Palii C, Estaquier J, Montreuil J. Novel fluorescence assay using calcein-AM for the determination of human erythrocyte viability and aging. Cytometry A. 2005;66:78–84. doi: 10.1002/cyto.a.20152. [DOI] [PubMed] [Google Scholar]
- 3.Braut-Boucher F, Pichon J, Rat P, Adolphe M, Aubery M, et al. A nonisotopic, highly sensitive, fluorimetric, cell-cell adhesion microplate assay using calcein AM-labeled lymphocytes. J Immunol Methods. 1995;178:41–51. doi: 10.1016/0022-1759(94)00239-s. [DOI] [PubMed] [Google Scholar]
- 4.Kansui Y, Garland CJ, Dora KA. Enhanced spontaneous Ca2+ events in endothelial cells reflect signalling through myoendothelial gap junctions in pressurized mesenteric arteries. Cell Calcium. 2008;44:135–146. doi: 10.1016/j.ceca.2007.11.012. [DOI] [PMC free article] [PubMed] [Google Scholar]
- 5.Opas M, Dziak E. Intracellular pH and pCa measurement. Methods Mol Biol. 1999;122:305–313. doi: 10.1385/1-59259-722-x:305. [DOI] [PubMed] [Google Scholar]
- 6.Petronilli V, Miotto G, Canton M, Brini M, Colonna R, et al. Transient and long-lasting openings of the mitochondrial permeability transition pore can be monitored directly in intact cells by changes in mitochondrial calcein fluorescence. Biophys J. 1999;76:725–734. doi: 10.1016/S0006-3495(99)77239-5. [DOI] [PMC free article] [PubMed] [Google Scholar]
- 7.So EC, Sallin MA, Zhang X, Chan SL, Sahni L, et al. A high throughput method for enrichment of natural killer cells and lymphocytes and assessment of in vitro cytotoxicity. J Immunol Methods Epub. 2013;2013:40–48. doi: 10.1016/j.jim.2013.05.001. [DOI] [PubMed] [Google Scholar]
- 8.Uggeri J, Gatti R, Belletti S, Scandroglio R, Corradini R, et al. Calcein-AM is a detector of intracellular oxidative activity. Histochem Cell Biol. 2004;122:499–505. doi: 10.1007/s00418-004-0712-y. [DOI] [PubMed] [Google Scholar]
- 9.Pliquett UF, Gusbeth CA. Overcoming electrically induced artifacts in penetration studies with fluorescent tracers. Bioelectrochemistry. 2000;51:75–79. doi: 10.1016/s0302-4598(99)00068-9. [DOI] [PubMed] [Google Scholar]
- 10.Thalmann GN, Sikes RA, Wu TT, Degeorges A, Chang SM, et al. LNCaP progression model of human prostate cancer: androgen-independence and osseous metastasis. Prostate. 2000;44:91–103. doi: 10.1002/1097-0045(20000701)44:2<91::aid-pros1>3.0.co;2-l. [DOI] [PubMed] [Google Scholar]
- 11.Chang SM, Chung LW. Interaction between prostatic fibroblast and epithelial cells in culture: role of androgen. Endocrinology. 1989;125:2719–2727. doi: 10.1210/endo-125-5-2719. [DOI] [PubMed] [Google Scholar]
- 12.Thalmann GN, Anezinis PE, Chang SM, Zhau HE, Kim EE, et al. Androgen-independent cancer progression and bone metastasis in the LNCaP model of human prostate cancer. Cancer Res. 1994;54:2577–2581. [PubMed] [Google Scholar]
- 13.Almeida-Porada G, Ascensão JL. Isolation, characterization, and biologic features of bone marrow endothelial cells. J Lab Clin Med. 1996;128:399–407. doi: 10.1016/s0022-2143(96)80012-6. [DOI] [PubMed] [Google Scholar]
- 14.Sikes RA, Walls AM, Brennen WN, Anderson JD, Choudhury-Mukherjee I, et al. Therapeutic approaches targeting prostate cancer progression using novel voltage-gated ion channel blockers. Clin Prostate Cancer. 2003;2:181–187. doi: 10.3816/cgc.2003.n.028. [DOI] [PubMed] [Google Scholar]
- 15.Anderson JD, Hansen TP, Lenkowski PW, Walls AM, Choudhury IM, et al. Voltage-gated sodium channel blockers as cytostatic inhibitors of the androgen-independent prostate cancer cell line PC-3. Mol Cancer Ther. 2003;2:1149–1154. [PubMed] [Google Scholar]
- 16.Sikes RA, Nicholson BE, Koeneman KS, Edlund NM, Bissonette EA, et al. Cellular interactions in the tropism of prostate cancer to bone. Int J Cancer. 2004;110:497–503. doi: 10.1002/ijc.20153. [DOI] [PubMed] [Google Scholar]
- 17.Jones TR, Kang IH, Wheeler DB, Lindquist RA, Papallo A, et al. CellProfiler Analyst: data exploration and analysis software for complex image-based screens. BMC Bioinformatics. 2008;9:482. doi: 10.1186/1471-2105-9-482. [DOI] [PMC free article] [PubMed] [Google Scholar]
- 18.Lu S, Kim T, Chen C, Ouyang M, Seong J, et al. Computational analysis of the spatiotemporal coordination of polarized PI3K and Rac1 activities in micro-patterned live cells. PLoS One. 2011;6 doi: 10.1371/journal.pone.0021293. [DOI] [PMC free article] [PubMed] [Google Scholar]
- 19.McGowan TA, Madesh M, Zhu Y, Wang L, Russo M, et al. TGF-beta-induced Ca(2+) influx involves the type III IP(3) receptor and regulates actin cytoskeleton. Am J Physiol Renal Physiol. 2002;282 doi: 10.1152/ajprenal.00252.2001. [DOI] [PubMed] [Google Scholar]
- 20.Horoszewicz JS, Leong SS, Kawinski E, Karr JP, Rosenthal H, et al. LNCaP model of human prostatic carcinoma. Cancer Res. 1983;43:1809–1818. [PubMed] [Google Scholar]


