Abstract
Background:
This was a retrospective cephalometric study to develop a more precise estimation of soft tissue changes related to underlying tooth movment than simple relatioship betweenhard and soft tissues.
Materials and Methods:
The lateral cephalograms of 61 adult patients undergoing orthodontic treatment (31 = premolar extraction, 31 = nonextraction) were obtained, scanned and digitized before and immediately after the end of treatment. Hard and soft tissues, angular and linear measures were calculated by Viewbox 4.0 software. The changes of the values were analyzed using paired t-test. The accuracy of predictions of soft tissue changes were compared with two methods: (1) Use of ratios of the means of soft tissue to hard tissue changes (Viewbox 4.0 Software), (2) use of stepwise multivariable regression analysis to create prediction equations for soft tissue changes at superior labial sulcus, labrale superius, stomion superius, inferior labial sulcus, labrale inferius, stomion inferius (all on a horizontal plane).
Results:
Stepwise multiple regressions to predict lip movements showed strong relations for the upper lip (adjusted R2 = 0.92) and the lower lip (adjusted R2 = 0.91) in the extraction group. Regression analysis showed slightly weaker relations in the nonextraction group.
Conclusion:
Within the limitation of this study, multiple regression technique was slightly more accurate than the ratio of mean prediction (Viewbox4.0 software) and appears to be useful in the prediction of soft tissue changes. As the variability of the predicted individual outcome seems to be relatively high, caution should be taken in predicting hard and soft tissue positional changes.
Keywords: Cephalometry, orthodontics, regression
INTRODUCTION
Prediction is an important part of orthodontic treatments. For many years, cut-and-paste techniques of cephalometric acetate tracing have been used to visualize treatment objectives. Recently, computer programs allow the clinicians to analyze and predict the treatment changes.
Many investigators analyzed the facial form to relate the soft tissue changes to the underlying hard tissue. Since the 1980s, various systems including Orthographic, Dolphin, Quick Ceph, and Viewbox have been introduced in the literature.[1,2,3,4,5] Software developers have used linear relations for soft to hard tissue movements.[6] Most researchers have stated that the predictions based on the ratios between soft tissue movement to the movement of the underlying hard tissue cannot be made accurately.[1,4,7,8,9] So attempts to find the response of the soft tissue with the help of statistical methods such as multivariable regression analysis have been made. By using statistical methods, we can explain many factors that can affect lips movement after premolar extraction such as initial lip thickness.[10,11,12,13,14,15]
Most studies have used ratios to explain lip response to incisor retraction in premolar extraction cases. Ratios of maxillary incisor retraction to movements of labrale superius (Ls) reported to vary from 1.2:1 to 3.2:1, and for lower lip ranging from 0.4:1 to 1.8:1.[16,17,18,19] Talass et al.[20] showed that multiple regression model explained only 49% of the variability in upper lip retraction. Caplan and Shivapuja[17] stated they can explain 70.1% and 42% of the variations in lip response to premolar extraction therapy with regression models. Brock et al.[21] found that 60% of the variabiliyies in upper lip retraction at superior labial sulcus (Sls) could be explained using multivariable regression. Denis and Speidel[22] stated that the predictions of lower lip movements are twice as accurate as simple ratios.
As the data for soft tissue responses to four premolars extraction and specially nonextraction treatments are limited, and most studies were accomplished on the African-American, Caucasian or Southeast Asian populations, So the purpose of this study was first to identify soft tissue profile changes associated with the movement of the incisors by using linear ratios (Viewbox 4.0 software) and regression models in an Iranian adult population. Second, the comparison of accuracy of these two methods with actual values.
MATERIALS AND METHODS
Sample size and subjects
The sample consisted of 62 orthodontic patients (17 male, 45 female) with a mean age of 23.6 years that were selected from patients treated in orthodontic clinics at Afzal and Ghaedi university affiliated clinics of Isfahan University of Mdeical Sciences, Isfahan, Iran. Thirty-one treated with four first premolar extractions and the remaining with nonextraction treatment.
The selection criteria for those patients were as follows:
Belonging to an Iranian ethnic group with a minimum age of 18 years at the beginning of treatment to reduce growth effects.
Availability of a good quality lateral cephalograms.
No syndromes or craniofacial anomalies.
No orthogenetic or cosmetic surgery.
Cephalometric procedure and measurements
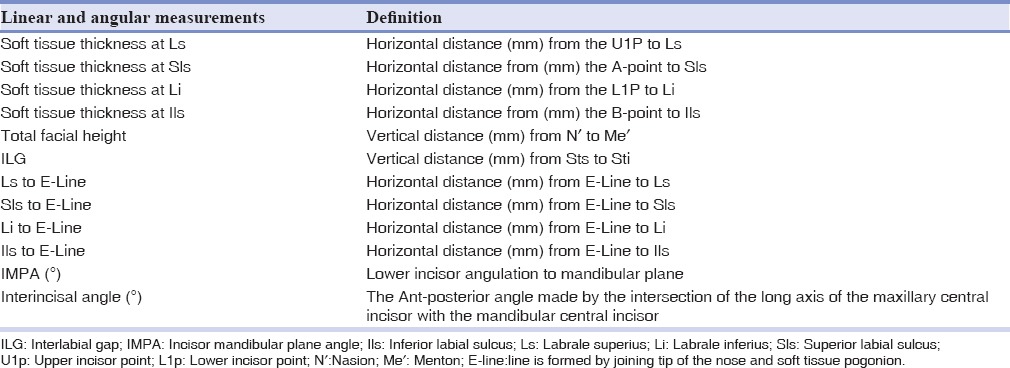
The radiographs and a transparent millimeter ruler for calibration were digitally scanned using a flatbed scanner at 300 DPI resolutions(HP Scanjet G4050, China). Radiographic images were imported into the software (Viewbox imaging software, version 4.0, dhal, Kifissia, Greece) and were digitized by one of the investigators. Magnification was corrected prior to data analysis. Since in this software magnification tool din not guess the real size correctly, so for calibrating radiographs, the real length of the ruler in each radiograph was entered in the image resized plane and then the magnification was calculated with software. Twelve hard and 11 soft tissue landmarks were identified on each digitized cephalogram [Figure 1a]. Then 12 linear and angular measurements [Table 1] were computed according to the reference lines that shown in Figure 1b. These reference lines were used in previous studies.[23]
Figure 1.
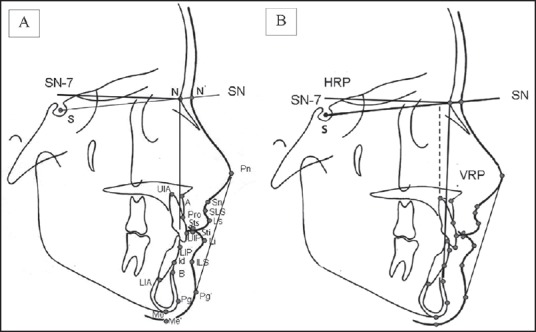
(a) Hard and soft tissue landmarks, (b) horizontal (HRP) and vertival (VRP) refrences planes.
Table 1.
Linear and angular measurements from cephalograms
Statistical analysis
T-test was used to evaluate the differences between the pre and post tratmentin extraction and nonextraction groups. A P = 0.05 was used as the minimal level of statistical significance. Stepwise multiple regression analysis was performed to detect whether the variables were helpful to predict soft tissue changes. Six dependent variables were selected for regression analyses; post treatment location of Sls, Ls, stomion superius (Sts), inferior labial sulcus (Ils), labrale inferius (Li) and stomion inferius (Sti) (all in horizontal plane). All measurements were taken from pretreatment cephalograms. The independent variables were chosen according to the most significance and the influence on the outcome of treatment mentioned in the previous studies.[13,15,24]
Predictions were carried out firstly with Viewbox 4.0 software, and secondly using equations produced by stepwise regression analysis on a small sample (n = 5) in both extraction and nonextraction groups. Finally, these data were compared with the actual values on the post treatment cephalograms. A series of 20 subjects was reassessed 2 months after initial digitization. Error of methods were calculated by Dahlberg formula:[25]
The error of the method2 = ∑d2/2n.
If the error of the method was not >0.5, the reliability in cephalometric tracing would be acceptable.
RESULTS
Table 2 shows the means and standard deviations (SDs) of the horizontal changes of the hard and soft tissue landmarks and the mean differences between the pretreatment and post treatment stages. Significant level was set at 0.05.
Table 2.
Comparision of horizontal hard and soft tissue landmark movements (mm) of extraction and nonextraction group
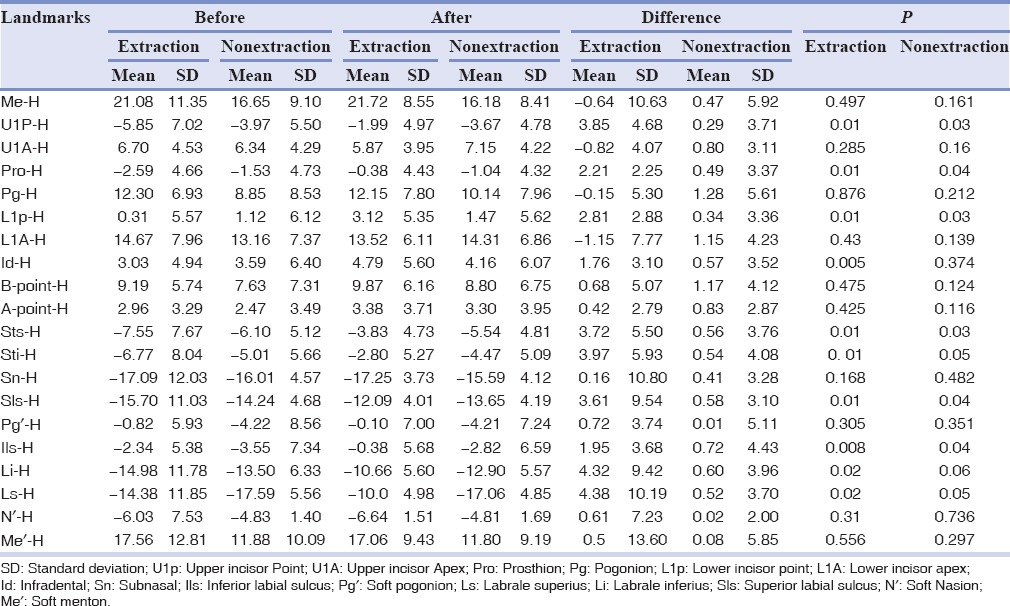
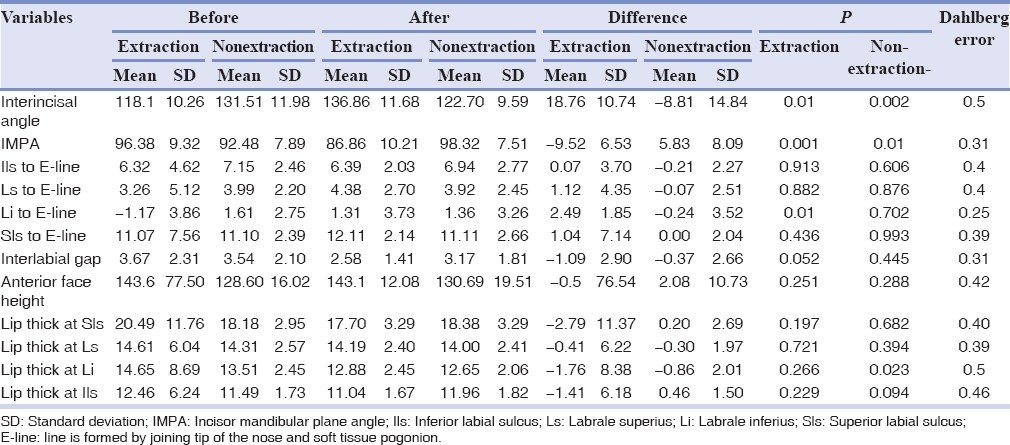
Table 3 shows the means and SDs and Dahlberg errors of the horizontal changes for hard and soft tissue variables (in mm). Significant level was set at 0.05. The error of the method was not >0.5, so reliability of cephalometric tracing was acceptable. Significant differences in hard tissue variables were noted between the stages for the variables involving the upper and lower incisors. No significant differences were found in the skeletal variables which show all the subjects were adult patients. In the soft tissue variables, significant differences were detected between the stages for the variables involving upper and lower lips.
Table 3.
Dental and soft tissue changes due to extraction and nonextraction treatments
Extraction group
For the hard tissue variables, significant differences were detected in the horizontal changes of Pro, Id, L1p, and U1p. Significant differences in the soft tissue variables were found in the horizontal changes of the upper and lower lips landmarks. The upper and lower lips at Ls and Li retracted by an average 1.86 ± 3.19 mm and 1.5 ± 2.42 mm, giving a ratio of 2:1 and 1.8:1, respectively. The mean changes for Ls and Li to E-Line were 1.12 ± 4.35 mm and 2.49 ± 1.85 mm, respectively, that showed retraction movements of lips.
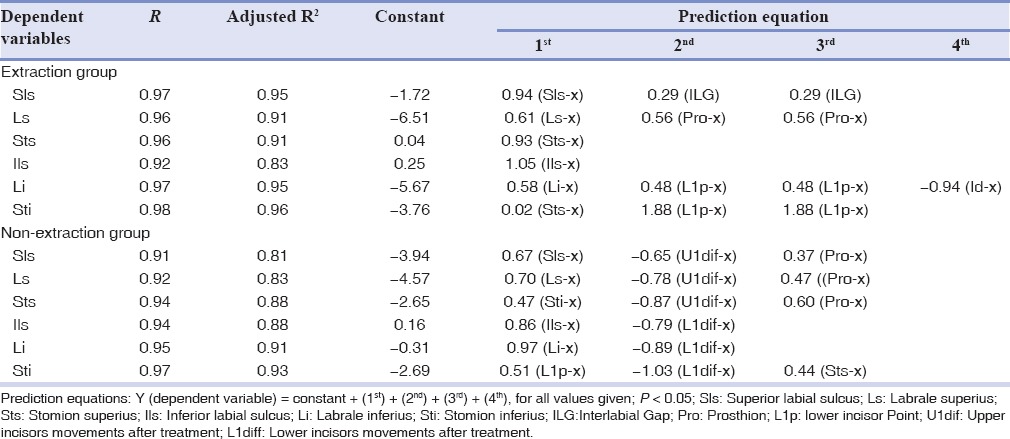
Stepwise multiple regression analysis was performed to predict the soft tissue profile changes. The results of the stepwise regression analysis [Table 4] suggested that the final position of Sti (adjusted R2 = 0.96), Li and Sls (adjusted R2 = 0.95) had strong relations with underlying structures. For the horizontal changes of upper and lower lips, incisors' facial point differences had the most effect. The other soft and hard tissue landmarks appeared to be more variable. The results indicated that the upper and lower lips could be strongly predicted, and there were a small difference between them.
Table 4.
Stepwise multivariable regression model for upper and lower lip in extraction and nonextraction gruoups
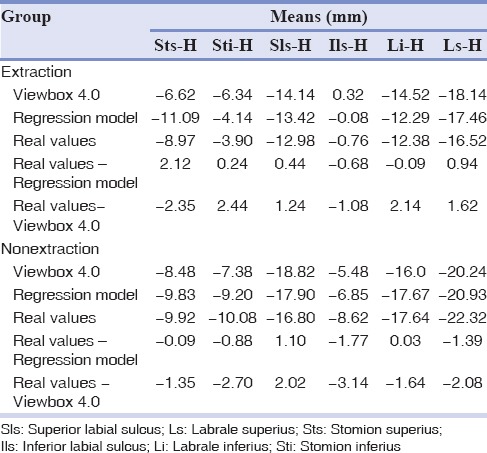
When the regression models were tested on the 5 post treatment patients, some variations were found between the actual values compared to the predicted values of multivariable models and Viewbox4.0 software. The differences between the actual and predicted mean values of variables are shown in Table 5.
Table 5.
Result of testing the prediction equations and Viewbox software on 5 new subjects: Differences of means between the result derived from the prediction equations and Viewbox and actual results on the posttreatment cephalograms
Nonextraction group
We found the ratio of 2.8:1 and 1.9:1 between upper and lower incisors and lips, respectively. This was with significant changes in inter incisal angle and incisor mandibular plane angle. The mean changes for Ls and Li to E-Line were −0.07 ± 2.51 mm and −0.25 ± 3.52 mm, respectively.
The results of the regression analysis [Table 4] suggested that the final position of Sti (adjusted R2 = 0.93) and Li (adjusted R2 = 0.91), had a strong association with associated landmarks. Like extraction group, incisors' facial point differences had the most effect on the horizontal changes of upper and lower lips.
DISCUSSION
The known ratios of soft to hard tissue movements are different in each individual, and only mean values are currently being used in the prediction programs. So we can suppose that in more instances, inaccuracy of prediction is inevitable.
Behrents[26] stated that facial growth could be detected well up to adulthood. Bishara et al.[27] also suggested that in females the most significant soft tissue changes occurs between the age of 10 and 15. Subtelny[28] and Vig and Cohen[29] noted that soft tissue changes will become complete after menarche. So we reduced the effects of growth and ethnic by selecting an Iranian adult patient especially women with a minimum age of 18 at the start of treatment which made the sample size relatively small.
For a closer look at the effect of extraction and nonextraction treatments on the soft tissue response, the following discussion is presented in two separate sections.
Extraction group
The need for extraction depends on many factors such as crowding, incisor proclination, and dentofacial esthetics.[30] In our study, the ratio between Ls and upper incisors was 2:1. Comparing the studies is difficult due to the methodological differences. For the lower lip, this ratio was 1.8:1 that falls between the ratios reported from studies with extraction, which ranged from 1.9:1 to 0.4:1.[16,17]
Like other studies, the lip thickness at Ls and Li reduced with incisors retraction.[13] This contradicts with the reports of Hasstedt[31] and Ricketts,[32] that upper lip thickness increased with incisor retraction. It is clear when lip posture is relaxed, lip thickness does not increase during the retraction of incisors.
Six dependent variables were selected to perform stepwise multivariable regression analysis. More points might be helpful to explain some of the variability in lip responses. The correlation between Sti (adjusted R2 = 0.96), Li and Sls (adjusted R2 = 0.95) were high and similar to previous studies.[24,33,34] Post treatment position of Sti was also found to be affected by pretreatment Sts. This point may indicate the importance of lip competency and taking the pretreatment cephalograms in a reproducible relaxed lip posture.[15]
The multiple regression prediction equations for upper lip retraction explained 92% of the variability. Our equations were simpler than previously reported.[15,35] Previous multiple regression prediction equation has explained from 42% to 56% of the variability in the upper lip response to incisor retraction.[17,21] The stronger association could have been due to the strict selection criteria and reducing confounding factors. Brock et al.[21] explained 60% variability in Sls retraction. Talass et al.[20] and Ramos et al.[36] found the horizontal movement of prosthion and pretreatment upper lip thickness were important predictor factors.
The multivariable prediction equation for lower lip retraction was able to explain 91% of the variability. Retraction of the lower lip was similar to the upper lip, which disagrees with others reporting that upper lip retraction is less predictable because of the complex anatomy of the upper lip.[13,20] However, in this study, difference between upper and lower lips were small and it can be negligible. Veltkamp et al.[14] showed that using simple ratios only approximately 50% of the variation in soft tissue response can be explained. According them, multivariable regression model increased predictive accuracy by up to 40%. Our findings agree with this and seem to be able to predict soft tissue response after premolar retraction with a higher degree of accuracy than using Viewbox 4.0 software.
Because it was not possible to test the prediction equations on a sufficiently large group, we used 5 patients out of the original study. However, the sample size was small, but differences between means were relatively small, and it was possible to predict the soft tissue response within clinically useful ranges [Table 3]. Our findings were similar to Kneafsey et al. study.[15]
Nonextraction group
In this study, we desired to assess the soft tissue response in extraction and nonextraction patients. Except dental measurements, both groups were similar in hard and soft tissue measurements. Forward tipping of the incisor was noted after treatment.
Similar to extraction group, regression models were more accurate than Viewbox 4.0 prediction. The multiple regression equations for upper and lower lips explained 84% and 90% of the variability, respectively, that were less than what we got in extraction group that can be explained by more personal variability in soft tissue response. Until now, there is no adequate data on nonextraction treatments.
Soft tissue activities during imaging may confound soft tissue measurements. In our study, estimating the effect of this was difficult, but we attempted to have the lips relaxed during the actual exposure as mentioned before.[37,38] Previous studies of lip profile changes following orthodontic treatments had used Caucasian,[39,40] African American,[16] and Asian[18,41] races. Our study is unique as no data exists for the Iranian population, and it may provide useful information for clinician who is treating Iranians with similar malocclusions.
Prediction using programs such as Viewbox has two obvious downsides. First, the ratios that have been used are based on the average data collected from different samples. Second, using this method, it was supposed that there is a linear and fixed relation between soft and hard tissues. These factors could result in less accuracy in comparison to regression models. Until now, there are few studies on the accuracy of the cephalometric prediction using prediction programs.[5] Our study had many limitations such as nonhomogeneous studied population and not controlling the effect of treatment variables such as the method of space closure. Since all radiographic images in this research did not have enough quality, we try to select better contrast images. However, it was possible to have some cases with not enough detectable borders of soft tissues. Future studies could be carried out with a larger sample size that has more uniform pretreatment characteristic and more controlled treatment variables.
This study showed that the soft tissue response could be predicted more accurately by multivariable regression models and in the future, these models might benefit to improve software programs.
CONCLUSION
Within the limitation of this study, the following conclusions can be made from this study:
The relationships between the lip changes and hard tissue changes are strong in both extraction and nonextraction groups, horizontally.
Incisors movements showed the strongest relationship to upper and lower lips.
With the regression models, it was possible to explain 92% and 91% of the variations in soft tissue response for upper and lower lips retraction, respectively. These models produced slightly weaker prediction in nonextraction group.
Predicting the soft tissue changes could be accomplished by using multivariable regression analysis. This method was more accurate than using simple ratios (Viewbox 4.0 software).
Prediction of soft tissue changes following orthodontic treatments showed more variability in the nonextraction group.
The variability of the predicted hard and soft tissue individual outcome seems to be relatively high.
Financial support and sponsorship
Isfahan University of Medical Sciences.
Conflicts of interest:
The authors of this manuscript declare that they have no conflicts of interest, real or perceived, financial or non-financial in this article.
REFERENCES
- 1.Aharon PA, Eisig S, Cisneros GJ. Surgical prediction reliability: A comparison of two computer software systems. Int J Adult Orthodon Orthognath Surg. 1997;12:65–78. [PubMed] [Google Scholar]
- 2.Upton PM, Sadowsky PL, Sarver DM, Heaven TJ. Evaluation of video imaging prediction in combined maxillary and mandibular orthognathic surgery. Am J Orthod Dentofacial Orthop. 1997;112:656–65. doi: 10.1016/s0889-5406(97)70231-2. [DOI] [PubMed] [Google Scholar]
- 3.Hing NR. The accuracy of computer generated prediction tracings. Int J Oral Maxillofac Surg. 1989;18:148–51. doi: 10.1016/s0901-5027(89)80113-4. [DOI] [PubMed] [Google Scholar]
- 4.Smith JD, Thomas PM, Proffit WR. A comparison of current prediction imaging programs. Am J Orthod Dentofacial Orthop. 2004;125:527–36. doi: 10.1016/S0889540604001210. [DOI] [PMC free article] [PubMed] [Google Scholar]
- 5.Davoudian M. The validity of computer assisted system for lateral cephalometric analysis in comparison with the conventional method. II. Onyxceph imaging software. Iran. J Orthod. 2009;4:67–77. [Google Scholar]
- 6.Chew MT, Sandham A, Wong HB. Evaluation of the linearity of soft- to hard-tissue movement after orthognathic surgery. Am J Orthod Dentofacial Orthop. 2008;134:665–70. doi: 10.1016/j.ajodo.2006.12.017. [DOI] [PubMed] [Google Scholar]
- 7.Lines PA, Steinhauser EW. Soft-tissue changes in relationship to the movement of hard structures in the orthognathic surgery-preliminary report. J Oral Surg. 1974;32:891–6. [Google Scholar]
- 8.Hamada T, Motohashi N, Kawamoto T, Ono T, Kato Y, Kuroda T. Two-dimensional changes in soft tissue profile following surgical mandibular advancement in Japanese retrognathic adults. Int J Adult Orthodon Orthognath Surg. 2001;16:272–9. [PubMed] [Google Scholar]
- 9.Hernandez-Orsini R, Jacobson A, Sarver DM, Bartolucci A. Short-term and long-term soft tissue profile changes after mandibular advancements using rigid fixation techniques. Int J Adult Orthodon Orthognath Surg. 1989;4:209–18. [PubMed] [Google Scholar]
- 10.Mobarak KA, Espeland L, Krogstad O, Lyberg T. Soft tissue profile changes following mandibular advancement surgery: Predictability and long-term outcome. Am J Orthod Dentofacial Orthop. 2001;119:353–67. doi: 10.1067/mod.2001.112258. [DOI] [PubMed] [Google Scholar]
- 11.Lo FD, Hunter WS. Changes in nasolabial angle related to maxillary incisor retraction. Am J Orthod. 1982;82:384–91. doi: 10.1016/0002-9416(82)90187-7. [DOI] [PubMed] [Google Scholar]
- 12.Quast DC, Biggerstaff RH, Haley JV. The short-term and long-term soft-tissue profile changes accompanying mandibular advancement surgery. Am J Orthod. 1983;84:29–36. doi: 10.1016/0002-9416(83)90145-8. [DOI] [PubMed] [Google Scholar]
- 13.Kasai K. Soft tissue adaptability to hard tissues in facial profiles. Am J Orthod Dentofacial Orthop. 1998;113:674–84. doi: 10.1016/s0889-5406(98)70228-8. [DOI] [PubMed] [Google Scholar]
- 14.Veltkamp T, Buschang PH, English JD, Bates J, Schow SR. Predicting lower lip and chin response to mandibular advancement and genioplasty. Am J Orthod Dentofacial Orthop. 2002;122:627–34. doi: 10.1067/mod.2002.128864. [DOI] [PubMed] [Google Scholar]
- 15.Kneafsey LC, Cunningham SJ, Petrie A, Hutton TJ. Prediction of soft-tissue changes after mandibular advancement surgery with an equation developed with multivariable regression. Am J Orthod Dentofacial Orthop. 2008;134:657–64. doi: 10.1016/j.ajodo.2006.11.024. [DOI] [PubMed] [Google Scholar]
- 16.Diels RM, Kalra V, DeLoach N, Jr, Powers M, Nelson SS. Changes in soft tissue profile of African-Americans following extraction treatment. Angle Orthod. 1995;65:285–92. doi: 10.1043/0003-3219(1995)065<0285:CISTPO>2.0.CO;2. [DOI] [PubMed] [Google Scholar]
- 17.Caplan MJ, Shivapuja PK. The effect of premolar extractions on the soft-tissue profile in adult African American females. Angle Orthod. 1997;67:129–36. doi: 10.1043/0003-3219(1997)067<0129:TEOPEO>2.3.CO;2. [DOI] [PubMed] [Google Scholar]
- 18.Kusnoto J, Kusnoto H. The effect of anterior tooth retraction on lip position of orthodontically treated adult Indonesians. Am J Orthod Dentofacial Orthop. 2001;120:304–7. doi: 10.1067/mod.2001.116089. [DOI] [PubMed] [Google Scholar]
- 19.Roos N. Soft-tissue profile changes in class II treatment. Am J Orthod. 1977;72:165–75. doi: 10.1016/0002-9416(77)90057-4. [DOI] [PubMed] [Google Scholar]
- 20.Talass MF, Talass L, Baker RC. Soft-tissue profile changes resulting from retraction of maxillary incisors. Am J Orthod Dentofacial Orthop. 1987;91:385–94. doi: 10.1016/0889-5406(87)90391-x. [DOI] [PubMed] [Google Scholar]
- 21.Brock RA, 2nd, Taylor RW, Buschang PH, Behrents RG. Ethnic differences in upper lip response to incisor retraction. Am J Orthod Dentofacial Orthop. 2005;127:683–91. doi: 10.1016/j.ajodo.2004.01.026. [DOI] [PubMed] [Google Scholar]
- 22.Denis KL, Speidel TM. Comparison of three methods of profile change prediction in the adult orthodontic patient. Am J Orthod Dentofacial Orthop. 1987;92:396–402. doi: 10.1016/0889-5406(87)90260-5. [DOI] [PubMed] [Google Scholar]
- 23.Legan HL, Burstone CJ. Soft tissue cephalometric analysis for orthognathic surgery. J Oral Surg. 1980;38:744–51. [PubMed] [Google Scholar]
- 24.Hodges A, Rossouw PE, Campbell PM, Boley JC, Alexander RA, Buschang PH. Prediction of lip response to four first premolar extractions in white female adolescents and adults. Angle Orthod. 2009;79:413–21. doi: 10.2319/050208-247.1. [DOI] [PubMed] [Google Scholar]
- 25.Dahlberg G. Statistical methods for medical and biological students. London: George Alien and Unwin, ltd.; 1940. p. 101. [Google Scholar]
- 26.Behrents RG. Growth in the Aging Craniofacial Skeleton. Ann Arbor: Center for Human Growth and Development, University of Michigan; 1985. p. 17. [Google Scholar]
- 27.Bishara SE, Jakobsen JR, Hession TJ, Treder JE. Soft tissue profile changes from 5 to 45 years of age. Am J Orthod Dentofacial Orthop. 1998;114:698–706. doi: 10.1016/s0889-5406(98)70203-3. [DOI] [PubMed] [Google Scholar]
- 28.Subtelny J. A longitudinal study of soft tissue facial structures and their profile characteristics, defined in relation to underlying skeletal structures. Am J Orthod. 1959;45:481–507. [Google Scholar]
- 29.Vig PS, Cohen AM. Vertical growth of the lips: A serial cephalometric study. Am J Orthod. 1979;75:405–15. doi: 10.1016/0002-9416(79)90162-3. [DOI] [PubMed] [Google Scholar]
- 30.Kachiwala VA, Kalha AS, Machado G. Soft tissue changes associated with first premolar extractions in adult females. Aust Orthod J. 2009;25:24–9. [PubMed] [Google Scholar]
- 31.Hasstedt CW. A Serial Cephalometric Study of the Effects of Orthodontic Treatment on Incisal Overbite and the Soft Tissue Profile. 1956 [Google Scholar]
- 32.Ricketts RM. Esthetics, environment, and the law of lip relation. Am J Orthod. 1968;54:272–89. doi: 10.1016/s0002-9416(68)90278-9. [DOI] [PubMed] [Google Scholar]
- 33.Kokodynski RA, Marshall SD, Ayer W, Weintraub NH, Hoffman DL. Profile changes associated with maxillary incisor retraction in the postadolescent orthodontic patient. Int J Adult Orthodon Orthognath Surg. 1997;12:129–34. [PubMed] [Google Scholar]
- 34.Hershey HG. Incisor tooth retraction and subsequent profile change in postadolescent female patients. Am J Orthod. 1972;61:45–54. doi: 10.1016/0002-9416(72)90175-3. [DOI] [PubMed] [Google Scholar]
- 35.Anderson JP, Joondeph DR, Turpin DL. A cephalometric study of profile changes in orthodontically treated cases ten years out of retention. Angle Orthod. 1973;43:324–36. doi: 10.1043/0003-3219(1973)043<0324:ACSOPC>2.0.CO;2. [DOI] [PubMed] [Google Scholar]
- 36.Ramos AL, Sakima MT, Pinto Ados S, Bowman SJ. Upper lip changes correlated to maxillary incisor retraction - A metallic implant study. Angle Orthod. 2005;75:499–505. doi: 10.1043/0003-3219(2005)75[499:ULCCTM]2.0.CO;2. [DOI] [PubMed] [Google Scholar]
- 37.Wholley CJ, Woods MG. The effects of commonly prescribed premolar extraction sequences on the curvature of the upper and lower lips. Angle Orthod. 2003;73:386–95. doi: 10.1043/0003-3219(2003)073<0386:TEOCPP>2.0.CO;2. [DOI] [PubMed] [Google Scholar]
- 38.Mamandras AH. Growth of lips in two dimensions: A serial cephalometric study. Am J Orthod. 1984;86:61–6. doi: 10.1016/0002-9416(84)90277-x. [DOI] [PubMed] [Google Scholar]
- 39.Shearn BN, Woods MG. An occlusal and cephalometric analysis of lower first and second premolar extraction effects. Am J Orthod Dentofacial Orthop. 2000;117:351–61. doi: 10.1016/s0889-5406(00)70240-x. [DOI] [PubMed] [Google Scholar]
- 40.Rains MD, Nanda R. Soft-tissue changes associated with maxillary incisor retraction. Am J Orthod. 1982;81:481–8. doi: 10.1016/0002-9416(82)90427-4. [DOI] [PubMed] [Google Scholar]
- 41.Xu TM, Liu Y, Yang MZ, Huang W. Comparison of extraction versus nonextraction orthodontic treatment outcomes for borderline Chinese patients. Am J Orthod Dentofacial Orthop. 2006;129:672–7. doi: 10.1016/j.ajodo.2005.12.007. [DOI] [PubMed] [Google Scholar]


