Abstract
Objective
Brain regions are localized for resection during epilepsy surgery based upon rare seizures observed during a short time period of intracranial EEG (iEEG) monitoring. Interictal epileptiform bursts, which are more prevalent than seizures, may provide complementary information to aid in epilepsy evaluation. In this study, we leverage a long-term iEEG dataset from canines with naturally occurring epilepsy to investigate interictal bursts and their electrographic relationship to seizures.
Methods
Four dogs were included in this study, each previously monitored with continuous iEEG for periods of 475.7, 329.9, 45.8, and 451.8 days respectively for a total of over 11,000 hours. Seizures and bursts were detected and validated by two board-certified epileptologists. A published Bayesian model was applied to analyze the dynamics of interictal epileptic bursts on EEG and compare them to seizures.
Results
In three dogs, bursts were stereotyped and found to be statistically similar to periods before or near seizure onsets. Seizures from one dog during status epilepticus were markedly different than other seizures in terms of burst similarity.
Significance
Shorter epileptic bursts explored in this work have the potential to yield significant information about the distribution of epileptic events. In our data, bursts are at least an order of magnitude more prevalent than seizures and occur much more regularly. Our finding that bursts often display pronounced similarity to seizure onsets suggests that they contain relevant information about the epileptic networks from which they arise and may aide in the clinical evaluation of epilepsy in patients.
Keywords: intracranial, EEG, canine, burst
Introduction
Epilepsy affects 60 million people worldwide, of whom one third have seizures not controlled with medications 1. For many patients who are refractory to medications, surgical intervention is the only possibility for cure. Prior to surgical resection, patients with neocortical epilepsy typically undergo intracranial EEG (iEEG) monitoring to localize the seizure onset zone. Unfortunately, after undergoing extensive pre-surgical evaluation, often lasting several weeks, only ~50% of patients with neocortical epilepsy will become seizure-free or have a significant reduction in their seizure burden following surgery 2. A long-standing goal of the epilepsy research community is to identify electrophysiological biomarkers of epileptic networks and their dynamics to better target anti-seizure therapies, particularly surgery and implantable devices. The identification and validation of these biomarkers necessitates long-term iEEG recordings through which many repeated observations can be detected and analyzed.
In prior work from our lab, we presented recordings from a novel implantable device that continuously records iEEG for prolonged periods 3. Six dogs with naturally occurring cryptogenic localization related epilepsy were monitored for over 11,000 hours with 16 intracranial electrodes, eight implanted over each hemisphere. Over 200 ictal events which showed remarkable similarity to human seizures were recorded across these canines. Background EEG and interictal bursts of epileptiform discharges in these animals were also indistinguishable from human iEEG recordings. This work validated canines with spontaneous seizures as a promising model of human epilepsy and provides a rich dataset of unprecedented length for biomarker detection and analysis.
One potential biomarker of interest is interictal bursts observed on human iEEG as well as on our canine recordings. These bursts have been described in various studies as brief rhythmic discharges (BRDs) and brief potentially ictal rhythmic discharges (B(I)RDs) 3–8 and have been associated with epilepsy and cerebral trauma. These patterns exhibit similarities to electrographic seizures in that they are paroxysmal, stereotyped, and can evolve temporally and spatially. However, it is currently not known how these epileptiform bursts relate to epileptic networks, their dynamics, or if they quantitatively resemble epileptic seizures. Some investigators differentiate between bursts and seizure by an arbitrary duration set at 10 seconds, which we investigate and address in the discussion below. Furthermore, since interictal bursts occur much more regularly than seizures, they may aid in the localization of epileptic networks for surgical resection or serve as an important feature in seizure prediction.
The primary goal of this study is to investigate interictal bursts and to determine their relationship to clinical seizures on continuous iEEG from canines with naturally occurring epilepsy. Specifically, we aim to characterize interictal bursts and determine their dynamic similarity to seizures. Assessing the relationship between bursts to well-established seizures will allow us to determine the importance of these epileptiform discharges and to justify future in-depth studies of these interictal patterns. Furthermore, we can improve our understanding of how these bursts relate to seizures and potentially shed light on mechanisms of seizure onset and propagation.
A secondary goal of this study is to focus on the challenges presented by new devices that continuously monitor and process human data over long periods – “big neural data”. This work has evolved and improved steadily over recent years, embodied in devices to detect, predict and respond to seizures in several new implantable devices3,9,10. Traditionally, iEEG is interpreted by human readers and marked by hand. The large archive of continuous data analyzed for this project required rigorous, automated methods for detecting and processing bursts of activity. In this study we leverage automated, machine learning approaches to data reduction to study interictal bursts in data streams too long and complex to be marked manually by human readers. These methods offer more flexibility and the ability to learn patterns from data, a substantial improvement from rule-based methods employed in epilepsy monitoring equipment and implantable anti-seizure devices currently being deployed.
Methods
Dataset
Four dogs originally described in Davis et al., 2011 were included in this study each monitored with continuous iEEG for periods of 475.7, 329.9, 45.8, and 451.8 days 3. All dogs were observed to have spontaneous focal epilepsy of unknown etiology with secondary generalization. All dogs exhibited focal onset seizures with and without generalization. The dogs were normal on physical and neurological exam with no history of trauma. The dogs were housed at BioAssist Inc., a USDA Class R research facility located in Vacaville, CA. None of the dogs were on antiepileptic medication at the start of the study. One of the four dogs included in the present study died from status epilepticus during the monitoring period, after which phenobarbital (PHB) therapy was initiated in all remaining dogs. The results from this dog are discussed separately.
Each dog exhibited similar seizure symptomatology. Typically, focal seizures with secondary generalization proceeded in four phases. The first phase lasted 5–12 seconds and started with vigorous side-to-side shaking of the head, or jerking of the head followed by shaking, with altered awareness. The second tonic phase lasted 2–15 seconds with extensor rigidity of the jaw and opisthotonus of the head, neck, and limbs. These tonic movements were followed by rhythmic clonic jerking of the limbs, which were initially rapid (25–30 seconds) but slowed to resembled post-ictal running movements (10–50 seconds). In the recovery phase, the dogs lay quietly in lateral recumbency, with occasional jerks and hyperventilation.
Event Detection
Both seizures as well as interictal bursts were initially detected with a sensitive line-length detector and subsequently validated manually. Line-length is a feature that incorporates both the amplitude and frequency components of a signal and has been shown to be robust for detection of epileptiform events 9. Detections that were interrupted by data dropout from device dysfunction or repair were eliminated from analysis. Three channels with significant electrode artifacts in dog 4 were also omitted from analysis.
To detect seizures, the average line-length feature was calculated across all 16 channels with a 2-second moving window, and candidate event EEG clips with line-length above a specified threshold were saved. Thresholds for each dog were individually set to be of high sensitivity and low specificity in order to capture all events. Clinical seizure candidates were validated with simultaneously video by a consensus of two board-certified epileptologists (B.L. and G.W.).
To detect interictal bursts, a similar line-length detector was used and candidate bursts were further refined by both quantitative and qualitative criteria. We excluded candidate events with maximum average line length feature values two times above the maximum value observed during known ictal events, since artifacts often displayed large-amplitude, high-frequency noise simultaneously on all channels. We eliminated candidate non-seizure events with above-threshold activity shorter than 500 ms and longer than 30 seconds. Longer events were manually reviewed to insure that real clinical events were not eliminated. Burst detections were validated by a consensus of two board-certified epileptologists (B.L. and K.D.).
After interictal epileptiform burst and seizure detections were finalized, each iEEG event was low-pass filtered at 100 Hz and downsampled from 400 Hz to 200 Hz, preserving event features relevant to clinical practice while reducing computational burden. iEEG voltages in each event were rescaled to [−10, 10] based on data that lies within a 99% confidence interval. This scaling prevents the extreme outliers from compressing the majority of the data and is necessary for numerical stability of statistical inference, but no data in any event was discarded.
Once the events (bursts and seizures) were identified, we then aimed to parse the dynamic activity of each event into states and determined the relationship between bursts and seizures. This is described below, and readers are referred to the supplementary materials for technical details.
Modeling
In order to assign a state to each timepoint during the bursts as well as seizures, we looked directly at the evolution of raw EEG voltages across time. This approach is similar to that which an epileptologist would use to analyze EEG, and captures evolving trends within time-traces. Here, we use an autoregressive hidden Markov model (AR-HMM) to parse the voltage signal into interpretable states that “switch”.. Specifically, we model a single channel’s activity as switching between a set of autoregressive (AR) processes, which are each locally stationary to account for the non-stationary properties of EEG. From a particular configuration of channel states, we can then assign global event states at any point in time11. This global event state, capturing the activity of all channels, is the focus of our analysis and the basis for determining similarity between two events.
Notably, two extensions make this model suitable for this analysis. We mimic focal changes in the iEEG by allowing channels to share AR states and allowing asynchronous state switching. Finally, a spatial constraint is added due to the physical electrode configuration, allowing for spatial propagation of activity and more tractable statistical inference. Readers are referred to the supplementary materials and published literature for further details and technical implementation 10,11.
Event comparisons
For each dog, all bursts and seizure events, regardless of focality were modeled together. This allows sharing of event states between both bursts and seizures as well as comparing dynamic similarity between events. We then ask the question: what parts of a seizure are most similar to bursts? This can be answered by determining the similarity of the timepoints in a seizure to all bursts. Specifically, we first calculate the probability that a given timepoint in a seizure is assigned to the same state as a given timepoint in a burst. This probability is derived from the Bayesian estimation of the AR-HMM model, and readers are referred to the supplementary materials and references for further details 12,14,15. Secondly, we take the maximum probability across all time points in the given burst to find the similarity between the seizure timepoint and the given burst. Finally, we average this probability across all bursts to obtain the similarity between a given timepoint in a seizure and all bursts. Intuitively, this represents the average probability that a given time point in a seizure clusters with a burst.
The model inference and analysis were run primarily on a cluster of ten 8-core Amazon EC2 machines (http://aws.amazon.com/documentation/), linked together into a cluster with the third-party StarCluster (http://star.mit.edu/cluster/). Matlab code for this model is available online (www.seas.upenn.edu/~wulsin).
Results
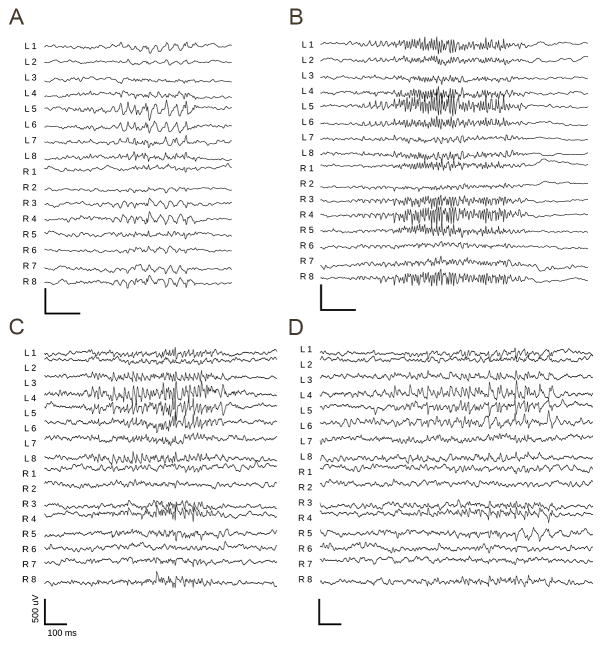
Table 1 summarizes resulting data segments containing event detections analyzed for each of the four subject dogs. Bursts were on average 3.97 seconds long with a standard deviation of 2.48 seconds. The 95% interval is between 1.2 seconds and 11.08 seconds. Qualitative analysis of bursts indicates that they are very similar to the bursts described in human EEG. Figure 1 shows examples of 4 bursts from one dog in this study, which is representative of all animals monitored for this experiment. Figure 1A shows a burst of sharply contoured rhythmic alpha activity present over both hemispheres, most prominent at channels L5, L6, R3, and R4. In Figure 1B, a burst of diffuse rhythmic gamma activity most marked at channels L4, L5, R3 and R4 is present. The sharply contoured burst of rhythmic gamma activity is more focal in Figure 1C in the left hemisphere channels 4 and 5. Figure 1D also shows a burst of more focal sharply contoured beta activity also in the left hemisphere channels 4 and 5.
Table 1. Distilled data from the four dogs with recorded iEEG.
Initial and final detections are noted. Dog 005* died from status epilepticus during this study.
| Dog ID | ECoG Time (days) | Initial Burst Detections | Final Burst Detections | Final Seizure Detections# |
|---|---|---|---|---|
| 002 | 475.7 | 1,846 | 740 | 37 |
| 004 | 329.9 | 16,026 | 758 | 14 |
| 005* | 45.8 | 6,437 | 811 | 91 |
| 007 | 451.8 | 11,149 | 1001 | 48 |
clinically validated.
Figure 1.
Examples of bursts detected on the canine iEEG data. There are 8 electrodes on each hemisphere, two parallel strips of four electrodes each. L1-8 are over the left hemisphere and R1-8 are over the right hemisphere. An average referential montage is displayed. (A) Burst of sharply contoured rhythmic alpha activity seen bilaterally most prominent at channels L5, L6, R3, R4. (B) Burst of diffuse rhythmic gamma activity most marked at channels L4, L5, R3, R4. (C) Focal burst of rhythmic gamma activity most prominent in L4, L5. (D) Burst of focal sharply contoured beta activity most prominent at L4, L5.
Do Bursts Correlate with Seizures?
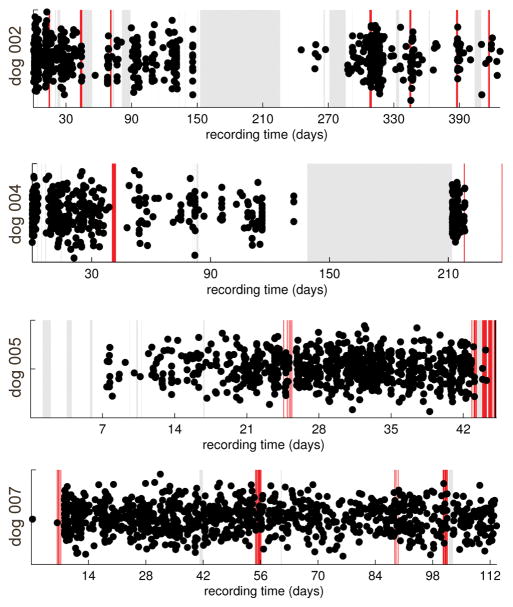
A time line of the seizures (red vertical bars) and sub-clinical bursts (dots scattered vertically for display) is shown in Figure 2 for each dog over the span of the dog’s entire continuous recording. Note that most seizures occur in clusters spaced a few hours from each other. A correlation analysis of burst distribution with seizure distribution indicated that bursts tended to cluster around seizures in dog 2, though not tightly (r=0.31, p=0.006). This pattern was not evident in the other dogs and bursts did not statistically predict seizures in any of the 4 subjects.
Figure 2.
Timelines of the seizures (red vertical bars) and sub-clinical bursts (dots jittered vertically for display) for each dog over the span of the continuous recording. Gray periods in the recording denote times of no available data. The majority of the seizures occur in groups spaced a few hours from each other. The last 73 days of dog 004’s record are omitted because only bursts excluded during the culling (and no seizures) occurred during that time frame.
Bursts Characteristics and Similarity to Seizures
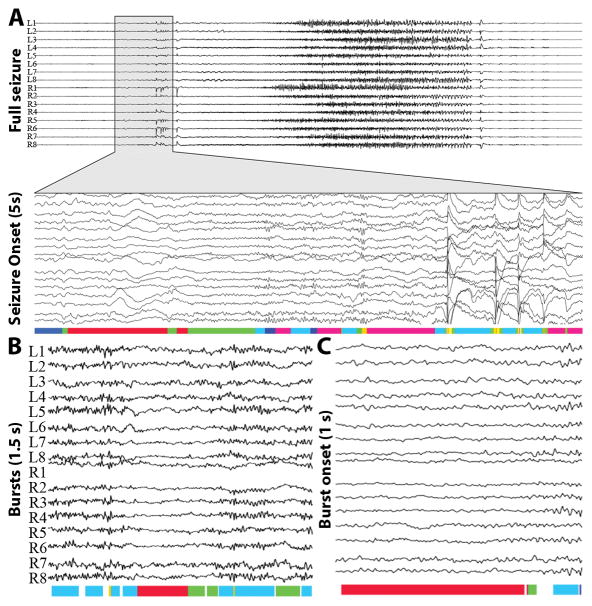
An example of event state assignments over EEG is shown in Figure 3. In panel A, the full seizure and 5 seconds of the seizure onset are shown. The colors beneath each EEG represent the state assignment at each timepoint. In panel B, the state assignments are shown for two bursts with transient decrease in activity in the center. Panel C shows the state assignments for the onset of a burst.
Figure 3.
Multichannel examples of seizure onset and interictal bursts with corresponding event states. Colors below EEG represent state assignment. (A) Full seizure with event state assignments for the seizure onset (5 s). (B) Interictal bursts and corresponding state assignments (1 s). (C) Interictal EEG showing burst onset (1 s).
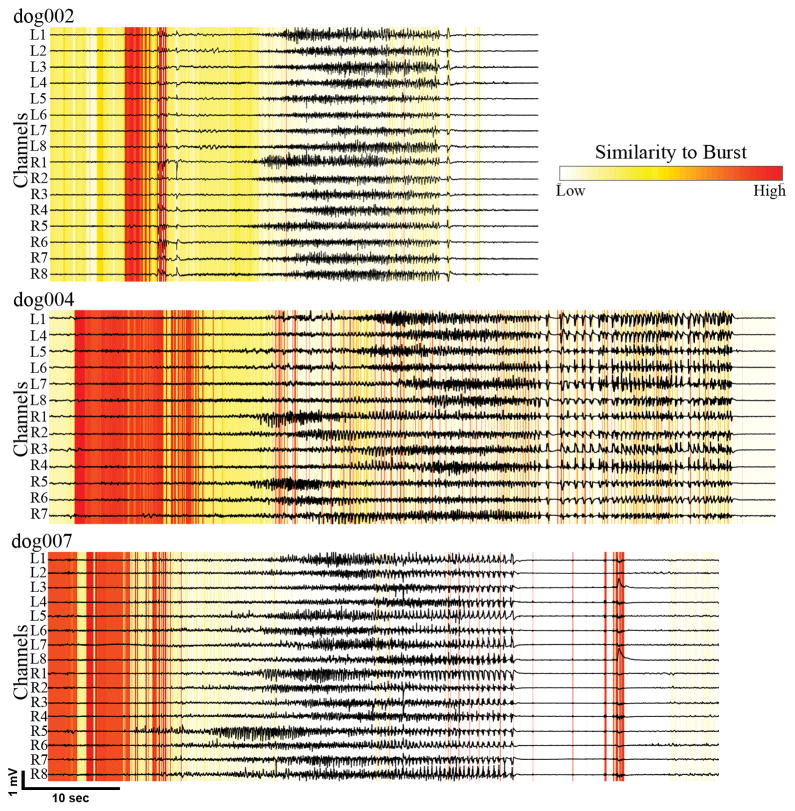
Figure 4 shows the average burst similarity for one representative seizure from each dog. In three dogs (excluding dog 5, who died from status epilepticus) bursts were stereotyped and found to be statistically similar to periods before or near seizure onsets. Higher amplitude activity following seizure onset had relatively little similarity with interictal bursts.
Figure 4.
Burst similarities for a representative seizure in each dog. Each horizontal line is a channel. Vertical lines indicate averaged similarity of given timepoint with all bursts. Red denotes timepoints with high similarity to all bursts. Bursts were stereotyped and found to be statistically similar to periods before or near seizure onsets.
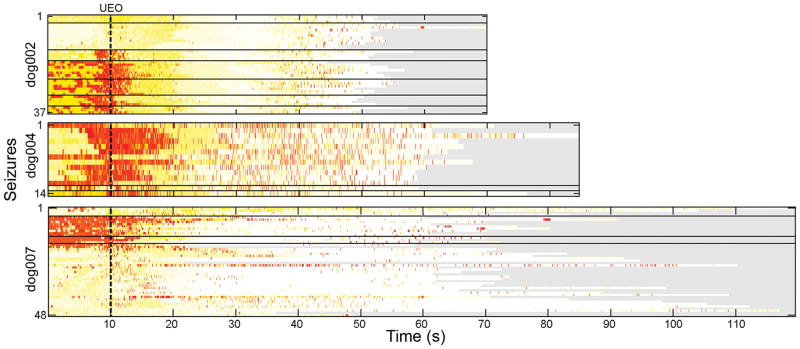
Figure 5 shows the averaged burst similarity across all the seizures for each dog 10 seconds prior to marked unequivocal electrographic onset (UEO) 12, where each row contains the same information in the EEG shown in Figure 3. This displays how the burst similarities change across seizures and over each subject’s monitoring period. Of particular interest, note how each cluster of seizures (denoted by the horizontal black lines) tends to display similar organization. There were few seizures during phenobarbital administration, but the relationship of bursts to non-status epilepticus seizures was unchanged.
Figure 5.
Burst similarities across all the bursts b (rows) for each seizure in each dog. Horizontal axis denotes the time series of each seizure. The vertical axis stacks seizures in time over the course of the monitoring period. Horizontal black lines separate clusters of seizures, defined as >24 hours apart. Vertical dashes line defines the unequivocal electrographic onset (UEO). Red denotes timepoints with high similarity to all bursts.
In dog 2, the first two clusters of seizures have little onset similarity with interictal bursts, though the later groups all display strong onset similarities. The high-amplitude seizure activity is in general not very similar to the bursts, though very discrete periods of the offsets tend to display strong similarities. The less marked similarity present at the end of the seizures occur at discrete, low-amplitude post-ictal discharges.
In dog 4, 12 of the 14 seizures recorded occurred within the period of just a few days. These all display strong onset similarities with a subset of interictal bursts on iEEG, generally those bursts that occur before the large data gap shown in Figure 2. The two seizures occurring much later in the record contain similarities across more of the bursts. As in dog 2, all of the seizures in dog 4 contain patterns of very brief but very strong similarity at seizure offset.
In dog 7, an early cluster of four seizures, as well as a late cluster of 32 seizures which occurred within two days also showed onset similarities with the bursts. However, the strongest similarity occurs with two clusters totaling 12 seizures. Bursts are similar to seizure onsets in the first three groups of seizures.
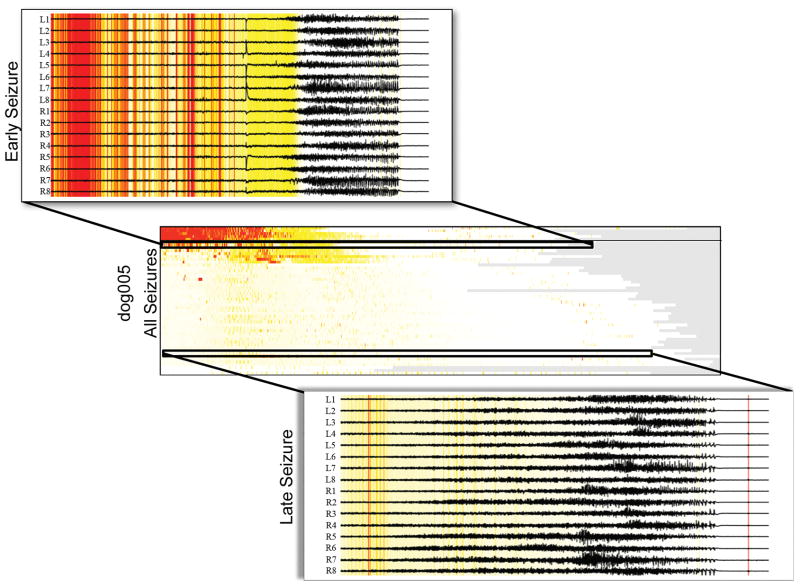
Dog 5 is a particularly interesting case in that it contained two main groups of seizures, the second of which occurred while the dog was in status epilepticus. The five seizures in the first group all contain very strong onset similarities and a few brief periods of offset similarity across almost all the bursts, as in dogs 2, 4, and 7. The second group of seizures display physiologic changes associated with status epilepticus that manifest in changes in iEEG seizure dynamics (Figure 5, see discussion below). During status epilepticus the bursts no longer are similar to the seizure onset or offset as seen in prior seizures.
Discussion
EEG representations of seizures can be thought of as observations from a complex physiologic network. We have every reason to believe that this network can change, especially after acute injury like traumatic brain injury or electrode implantation. We can think about these networks as creating a probability distribution of epileptic events, where each epileptic event is a sample from this distribution. Perturbations increase the probability of certain epileptic events, including seizures. Ideally, clinicians would have a reasonably high degree of confidence about the distribution of epileptic events, and thus confidence in the probability of future seizures, before making a dramatic clinical decision. However, this requires many observations of epileptic events, and often only a few seizures are recorded over weeks of intracranial monitoring. Furthermore, the network can generate a multimodal seizure distribution, meaning that a patient may have more than one type of seizure which could be missed during observations in the Epilepsy Monitoring Unit. Furthermore, the network can change, meaning that a seizure observed at one point in time may not be representative of events in the future. Can we really be confident in the conclusions we draw about the underlying epileptic networks when we have so few observations generated by it?
We believe that the interictal bursts explored in this work have the potential to yield significant information about the distribution of epileptic events. Our data shows that bursts are at least an order of magnitude more prevalent than seizures and occur much more regularly. Interestingly, although our algorithm detected all bursts less than 30 seconds, 95% of the finalized bursts were between 1.2 seconds and 11.8 seconds. This aligns with the 10 second cutoff that originated from the Young Criteria for subclinical seizures which is often extrapolated to the intracranial EEG setting by clinicians 17. However, since bursts longer than 11.8 seconds were rare, it is plausible that bursts represent a continuous spectrum of subclinical seizures and that a longer duration interictal burst may reach a physiological threshold for propagation, manifesting as clinical seizures.
We also showed that bursts display pronounced similarity to seizure onsets, suggesting that they contain relevant information about the epileptic networks from which they arise. In Figure 3, the state assignments of two interictal segments provide insight into the particular burst patterns and their similarity to seizure onset. Panel B shows two bursts with state assignments similar to high voltage activity at the earliest electrographic onset (EEC). The transient decrease in voltage, assigned a “red” state, likely corresponds to a quieting phase as seen in Panel C before burst onset. Because these event states are switching between AR processes, similar state assignments can be interpreted on a high level as having similar evolving frequency compositions. Physiologically, this similarity of bursts to the onset of a seizure may represent “aborted” seizure onsets, and comparing them to seizures may yield important mechanistic information on how clinical events are generated and guide surgical decision making.
In addition to being similar to seizure onset, we noted that burst similarities were statistically similar to seizure offset as well, but not the “middle” of seizures. Similar findings have been noted by other investigators who have shown dynamic iEEG network synchronization and desynchronization as a seizure progresses 14,15, which is thought to reflect changes in network topology. It is, however, not well understood why the “middle” of seizures shows decreased network synchronization. Some have postulated that there exists a relationship between network topology and bursting dynamics, which is also supported by in vitro studies 16,17. It is plausible that bursting activity characterizes a transition between various brain states, which would explain the similarity to seizure onsets and offsets, but not the middle of seizures.
Dog 5, who unfortunately died from status epilepticus, is a case that allows us to explore differences between isolated seizures and status epilepticus. The onsets of the initial isolated seizures were similar to interictal bursts. However, seizures that occurred during status epilepticus were not similar to the bursts. Although not well established in the literature, clinicians often note a substantial change in seizure characteristics during status epilepticus, in comparison with isolated spontaneous seizures in the same individual. The lack of burst similarity in dog 5 during status epilepticus is consistent with this finding. The transition of burst dynamics as this animal entered status epilepticus is also of great interest. The change in structure appears to change abruptly within the first several clinical events, suggesting that status epilepticus may represent an acute transition in epileptic networks, not a gradual transition into a stable, pathological state. However, these anecdotal observations are of only one dog, and further study in a larger dataset is needed for confirmation.
Limitations
The observations in this study suffer from several potential short-comings. First, the number of animals is quite small, as this was a pilot study meant to gather preliminary data for a larger, more detailed study. Though there is variability between dogs in this study, recording periods were very prolonged, much longer than previous work in the literature, and our conclusions regarding bursts, their relationship to seizures and their clustering behavior are supported by a large number of observed events and strong statistical significance.
Secondly, the question of seizure typing and classification in the dogs used in this study is one that affects the extension of our findings to human epilepsy. While there is significant literature qualitatively describing canine epilepsy 18, there is little published on iEEG in these animals, and their epilepsy syndromes are poorly characterized. We have described the seizure disorders and EEG in our subject animals previously 3 and found both well localized partial onset epilepsy in these animals, as well as poorly localized, regional onset frontal lobe seizures, though these were partial in onset. However, the range of patterns observed compares well to humans with medically refractory epilepsy undergoing iEEG presurgical evaluation. None of the animals monitored in this study appeared to have syndromes suggestive of disorders analogous to human primary generalized epilepsy, though these entities are less well described in these animals. Certainly relating our findings to those in human epilepsy will require similar extended recordings in patients, in order to determine whether our findings hold in the human condition.
Finally, the interictal bursts detected in this study likely encapsulated different subtypes. Here, the bursts we studied involved the majority of EEG channels because we were interested in the electrographic characteristics of each burst and not the spatial patterns. However, there was clear focality in many of these bursts. Furthermore, in the current analysis we did not stratify our analyses by the variability in the frequency composition (such as those shown in Figure 1). It is possible that a certain subtype of burst with certain frequency composition or focality is most similar to seizure onsets, and this is current topic of investigation in our lab.
Future directions
We believe we can use burst-burst similarity to determine when the epileptic network has stabilized and thus when the seizure observations from that network are truly representative of the future events. Based upon the known immunologic reaction to chronic intracranial implants and the resulting anatomical changes, 19–24 some investigators postulate that the implantation process itself may introduce epileptiform activity that can confound localization of epileptiform activity (Hudgins et al., submitted for publication, 2014). Current work in our lab is focused on analysis of burst dynamics to determine if these patterns can be used as a proxy for network stabilization.
Future research will help determine whether these bursts also contain localization information similar to that found in seizures. Since we have established that interictal bursts occur with greater frequency than seizures, this information might be harnessed to reduce or perhaps eliminate the requirement to record ictal events to map patients for epilepsy surgery or device placement. This study was not designed to test this hypothesis, but suggests that further investigation in this area could be fruitful. This issue that has not been assessable until now, with the appearance of prolonged intermittent recordings and more detailed, continuous recordings from devices like the one used in this study25.
Finally, an underlying theme of this research is using unsupervised methods to analyze massive streams of continuous iEEG, raising the significance of “big neural data” in clinical care. Our ability to analyze and categorize continuous iEEG recordings spanning up to a year in duration on Amazon’s Elastic Computing Cloud, suggests a possible paradigm shift in epilepsy research and potential clinical care. We now possess tools that make continuous access to extremely dense, prolonged and detailed brain recordings possible, with the ability to share them world wide on “The Cloud.” These advances have tremendous potential to accelerate collaborative research and facilitate rigorous validation of studies like this one. In this light, we are posting all of the data from this study on the International Epilepsy Electrophysiology Portal (http://ieeg.org) after publication of this study.
Conclusion
We believe that the findings in this study expand our current knowledge about the prevalent interictal bursts observed on iEEG and warrant further investigation into the predictive and localizing ability of these patterns. We show that these interictal bursts are very similar to both the onsets and offsets of seizures, potentially indicating that the bursts represent aborted seizures or changes in brain state. Whether this belief is correct will depend upon further human studies, now in progress, on a richer, larger continuous iEEG dataset. We also believe that the power of faster digital computers, machine learning, cloud computing and “big neural data” are poised to have dramatic impact on epilepsy research and clinical care.
Supplementary Material
Figure 6.
Burst similarities for the seizures of dog 005 (middle), similar to those shown for the other three dogs in Figure 5. An early (top) and late seizure (bottom) in dog005’s status epilepticus, where the time points of each seizure are colored based on their similarities to the other bursts. Red denotes timepoints with high similarity to all bursts.
Key Points of Article.
Epileptic bursts, which are more prevalent than seizures, have the potential to yield significant information about the distribution of epileptic events
Bursts display pronounced similarity to seizure onsets and may contain relevant information about the underlying epileptic networks.
The ability to analyze yearlong continuous EEG recordings on Amazon’s Computing Cloud suggests a possible paradigm shift in epilepsy research.
Acknowledgments
Funding:
This study was funded by National Institutes of Health (NIH) and the Mirowski Family Foundation grants through the University of Pennsylvania and Mayo Clinic. National Institutes of Health (NIH) (1-P20-NS-080181-01); NIH (U01-NS-073557-01A1). The International Epilepsy Electrophysiology Portal is funded by the NIH (5-U24-NS-063930-05).
We confirm that we have read the Journal’s position on issues involved in ethical publication and affirm that this report is consistent with those guidelines.
Footnotes
Disclosure of Conflicts of Interest: none
References
- 1.Kwan P, Brodie MJ. Early identification of refractory epilepsy. N Engl J Med. 2000;342:314–9. doi: 10.1056/NEJM200002033420503. [DOI] [PubMed] [Google Scholar]
- 2.Lee SK, Lee SY, Kim KK, Hong KS, Lee DS, Chung CK. Surgical outcome and prognostic factors of cryptogenic neocortical epilepsy. Ann Neurol. 2005;58:525–32. doi: 10.1002/ana.20569. [DOI] [PubMed] [Google Scholar]
- 3.Davis KA, Sturges BK, Vite CH, et al. A novel implanted device to wirelessly record and analyze continuous intracranial canine EEG. Epilepsy Res. 2011;96:116–22. doi: 10.1016/j.eplepsyres.2011.05.011. [DOI] [PMC free article] [PubMed] [Google Scholar]
- 4.Abend NS, Wusthoff CJ. Neonatal seizures and status epilepticus. J Clin Neurophysiol. 2012;29:441–8. doi: 10.1097/WNP.0b013e31826bd90d. [DOI] [PMC free article] [PubMed] [Google Scholar]
- 5.Gaspard N, Hirsch LJ. Pitfalls in ictal EEG interpretation: critical care and intracranial recordings. Neurology. 2013;80:S26–42. doi: 10.1212/WNL.0b013e31827974f8. [DOI] [PubMed] [Google Scholar]
- 6.Yoo JY, Rampal N, Petroff OA, Hirsch LJ, Gaspard N. Brief Potentially Ictal Rhythmic Discharges in Critically Ill Adults. JAMA Neurol. 2014 doi: 10.1001/jamaneurol.2013.6238. [DOI] [PubMed] [Google Scholar]
- 7.Nagarajan L, Palumbo L, Ghosh S. Brief electroencephalography rhythmic discharges (BERDs) in the neonate with seizures: their significance and prognostic implications. J Child Neurol. 2011;26:1529–33. doi: 10.1177/0883073811409750. [DOI] [PubMed] [Google Scholar]
- 8.Scher MS, Hamid MY, Steppe DA, Beggarly ME, Painter MJ. Ictal and Interictal Electrographic Seizure Durations in Preterm and Term Neonates. Epilepsia. 1993;34:284–8. doi: 10.1111/j.1528-1157.1993.tb02412.x. [DOI] [PubMed] [Google Scholar]
- 9.Fisher R, Salanova V, Witt T, et al. Electrical stimulation of the anterior nucleus of thalamus for treatment of refractory epilepsy. Epilepsia. 2010;51:899–908. doi: 10.1111/j.1528-1167.2010.02536.x. [DOI] [PubMed] [Google Scholar]
- 10.Morrell MJ. Responsive cortical stimulation for the treatment of medically intractable partial epilepsy. Neurology. 2011;77:1295–304. doi: 10.1212/WNL.0b013e3182302056. [DOI] [PubMed] [Google Scholar]
- 11.Esteller R, Echauz J, Tcheng T, Litt B, Pless B. Line length: an efficient feature for seizure onset detection. 2001 Conf Proc 23rd Annu Int Conf IEEE Eng Med Biol Soc. 2001;2 [Google Scholar]
- 12.Wulsin D, Litt B, Fox EB. Parsing epileptic events using a Markov switching process model for correlated time series. Proceedings of the 30th International Conference on Machine Learning (ICML-13) 2013:356–64. [Google Scholar]
- 13.Wulsin DF, Fox EB, Litt B. Modeling the complex dynamics and changing correlations of epileptic events. Artif Intell. 2014;216:55–75. doi: 10.1016/j.artint.2014.05.006. [DOI] [PMC free article] [PubMed] [Google Scholar]
- 14.Fox E, Sudderth E, Jordan M, Willsky A. Bayesian nonparametric methods for learning markov switching processes. IEEE Signal Process Mag. 2010;27:43–54. [Google Scholar]
- 15.Fox EB, Sudderth EB, Jordan MI, Willsky AS. Sharing Features among Dynamical Systems with Beta Processes. Advances in Neural Information Processing Systems 23: 24th Annual Conference on Neural Information Processing Systems 2010. 2009:388–96. [Google Scholar]
- 16.Worrell GA, Parish L, Cranstoun SD, Jonas R, Baltuch G, Litt B. High-frequency oscillations and seizure generation in neocortical epilepsy. Brain. 2004;127:1496–506. doi: 10.1093/brain/awh149. [DOI] [PubMed] [Google Scholar]
- 17.Young GB, Jordan KG, Doig GS. An assessment of nonconvulsive seizures in the intensive care unit using continuous EEG monitoring: an investigation of variables associated with mortality. Neurology. 1996;47:83–9. doi: 10.1212/wnl.47.1.83. [DOI] [PubMed] [Google Scholar]
- 18.Kramer MA, Eden UT, Lepage KQ, Kolaczyk ED, Bianchi MT, Cash SS. Emergence of persistent networks in long-term intracranial EEG recordings. J Neurosci. 2011;31:15757–67. doi: 10.1523/JNEUROSCI.2287-11.2011. [DOI] [PMC free article] [PubMed] [Google Scholar]
- 19.Schindler KA, Bialonski S, Horstmann M-T, Elger CE, Lehnertz K. Evolving functional network properties and synchronizability during human epileptic seizures. Chaos. 2008;18:033119. doi: 10.1063/1.2966112. [DOI] [PubMed] [Google Scholar]
- 20.Kramer MA, Eden UT, Kolaczyk ED, Zepeda R, Eskandar EN, Cash SS. Coalescence and fragmentation of cortical networks during focal seizures. J Neurosci. 2010;30:10076–85. doi: 10.1523/JNEUROSCI.6309-09.2010. [DOI] [PMC free article] [PubMed] [Google Scholar]
- 21.Netoff TI, Schiff SJ. Decreased Neuronal Synchronization during Experimental Seizures. J Neurosci. 2002;22:7297–307. doi: 10.1523/JNEUROSCI.22-16-07297.2002. [DOI] [PMC free article] [PubMed] [Google Scholar]
- 22.Löscher W. Animal models of intractable epilepsy. Prog Neurobiol. 1997;53:239–58. doi: 10.1016/s0301-0082(97)00035-x. [DOI] [PubMed] [Google Scholar]
- 23.Polikov VS, Tresco PA, Reichert WM. Response of brain tissue to chronically implanted neural electrodes. J Neurosci Methods. 2005;148:1–18. doi: 10.1016/j.jneumeth.2005.08.015. [DOI] [PubMed] [Google Scholar]
- 24.Prasad A, Sanchez JC. Quantifying long-term microelectrode array functionality using chronic in vivo impedance testing. J Neural Eng. 2012;9:026028. doi: 10.1088/1741-2560/9/2/026028. [DOI] [PubMed] [Google Scholar]
- 25.Van Kuyck K, Welkenhuysen M, Arckens L, Sciot R, Nuttin B. Histological alterations induced by electrode implantation and electrical stimulation in the human brain: a review. Neuromodulation. 2007;10:244–61. doi: 10.1111/j.1525-1403.2007.00114.x. [DOI] [PubMed] [Google Scholar]
- 26.Sun Da, Yu H, Spooner J, et al. Postmortem analysis following 71 months of deep brain stimulation of the subthalamic nucleus for Parkinson disease. J Neurosurg. 2008;109:325–9. doi: 10.3171/JNS/2008/109/8/0325. [DOI] [PubMed] [Google Scholar]
- 27.Yuen GH, Bullara FA. Tissue response to potential materials implanted neuroprosthetic subdurally. 1986. [DOI] [PubMed] [Google Scholar]
- 28.Hanisch U-K. Microglia as a source and target of cytokines. Glia. 2002;40:140–55. doi: 10.1002/glia.10161. [DOI] [PubMed] [Google Scholar]
Associated Data
This section collects any data citations, data availability statements, or supplementary materials included in this article.


