Abstract
Enumerating and analyzing circulating tumor cells (CTCs)—cells that have been shed from primary solid tumors—can potentially be used to determine patient prognosis and track the progression of disease. There is a great challenge to create an effective platform that can isolate these cells, as they are extremely rare: only 1-10 CTCs are present in a 7.5mL of a cancer patient's peripheral blood. We have developed a novel microfluidic system that can isolate CTC populations label free. Our system consists of a multistage separator that employs inertial migration to sort cells based on size. We demonstrate the feasibility of our device by sorting colloids that are comparable in size to red blood cells (RBCs) and CTCs.
Keywords: Microfluidics, Cancer, CTCs, Inertial, Isolation, Particle Separation
1. Introduction
A current focus in microfluidics has been to develop a platform that can isolate circulating tumor cells (CTCs) from the peripheral blood of patients with solid tumors[1]. CTCs are cells that are shed from a primary solid tumor and enter the vasculature. The leading hypothesis is that they play a key role in the metastatic progression of cancer. Very little is known about them, as they are extremely rare: only 1-10 cells per 7.5 mL of patient peripheral blood. The ability to isolate these rare cells with high purity and high recovery would represent a significant advance in cancer screening and monitoring.
Current techniques for isolating and identifying CTCs rely either on the physical properties of these cells (e.g. size, buoyant density, charge, cellular mass, and deformability[2-5]) or on the expression of particular markers, such as EpCAM, in combination with CK8, 18, and/or 19. Since CTCs are larger than red blood cells (RBCs, ~ 6 μm), isolation based on cell size via membrane filters[6] has been a large focus.
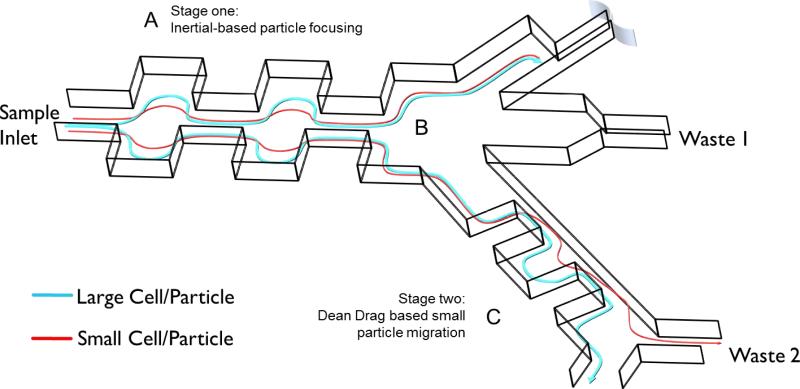
We have developed a microfluidic device, shown in Figure 1, which employs inertial migration to manipulate cell streamlines with respect to cell diameter. This technique utilizes two basic concepts: equilibrium and kinematic separation[7, 8]. In equilibrium separation, cells occupy unique equilibrium positions that are dependent on cell properties, such as size. In kinematic separation, secondary flows that are perpendicular to the primary flow direction are employed to manipulate cells to maintain different positions [9]. Under these working concepts, we demonstrate that our device is able to achieve high throughput and label-free sorting.
Fig. 1.
Complete schematic of multistage separator device. A) Stage 1: Particles are focused to the outer walls of the microchannel through a balance of wall lift and shear gradient lift forces. The contraction and expansion widths and lengths are 60 and 180, respectively. Stage one consists of 50 symmetric contraction expansion pairs. B) Trifurcating junction between stages. C) Stage 2: The inertial focused streamlines are exposed to dean drag forces where small particles migrate to different equilibrium positions. Stage 2 dimensions are defined as: expansion width and length are 300 and 900, respectively and the contraction width and lengths are 50 and 900, respectively. Stage 2 consists of 10 pairs of asymmetric contraction expansion pairs.
2. Theory and Device Design
Our microfluidic device utilizes a balance of inertial lift and Dean drag forces to focus cells into the desired equilibrium positions during fluid flow[10]. In order to separate larger cells (i.e. cancer cells >15 μm) selectively, we employ a two-stage process, shown in Figure 1. Stage 1 focuses all cells into a tight streamline along the outer microfluidic walls via a balance of shear gradient and wall inertial-lift forces; Stage 2 utilizes a Dean drag force to size separate the cells in the streamline prepared by Stage 1.
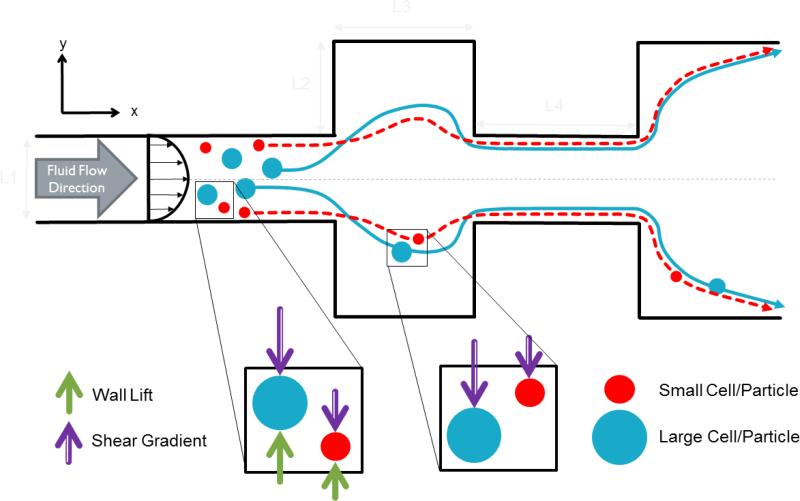
In more detail, cells in Stage 1 are subject to inertial focusing due to a balance of wall lift and shear gradient lift forces. The wall lift force, FWL, acts to push cells toward the centerline of the microchannel and is defined by,
| (1) |
where, fL, a, W, ρ, Um, Dh, and μ are the dimensionless lift coefficient, cell diameter, channel width, fluid density, maximum velocity, hydraulic diameter, and fluid viscosity. The shear gradient lift force, FSL, acts to push cells toward the channel walls and is defined by,
| (2) |
As shown in Figure 2, cells that are randomly dispersed at the microfluidic inlet are eventually ordered within their respective equilibrium position and re-focused toward the microfluidic walls.
Fig. 2.
Top view schematic of stage one: cell inertial focusing. Fluid flow in the x-direction. Cells are randomly dispersed at the inlet. They are then focused to their respective equilibrium positions. Further focusing is achieved as cells enter expansion regions where shear lift forces dominate to pull cells closer the outer walls. At the outlet, two compact streamlines are observed close to the outer walls of the microchannel.
In Stage 2 of our device, we utilize both inertial lift (FWL + FSL) and Dean drag forces,
| (3) |
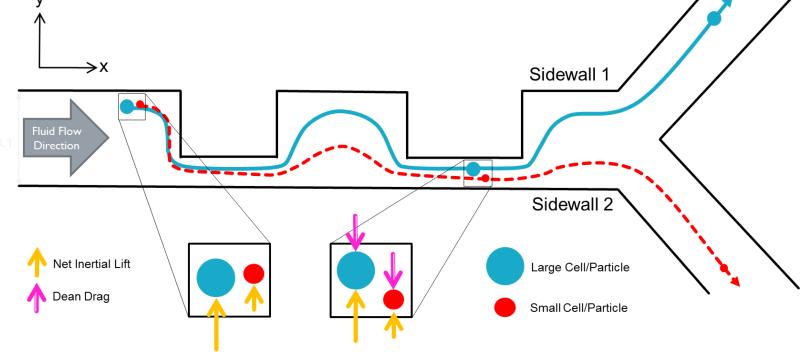
where UDean is the transverse velocity by Dean flow, to separate particles based on size. As shown in Figure 3, Stage 2 consists of a single microchannel that has asymmetrical expansion and contraction regions. This is a direct adaptation of the contraction expansion array (CEA), omitting sheath flow, developed by Lee et al. [11] The abrupt changes in the cross sectional area due to these expansion and contraction areas accelerate and decelerate the flow velocity and induce Dean-like flow. Cells are inertially focused toward Sidewall 1 upon being injected into Stage 2. The net inertial lift force dominates larger-sized cells to Sidewall 1 and to a specific output. In contrast, a Dean-drag force dominates and directs smaller-sized particles to the opposite Sidewall 2 and to a different output.
Fig. 3.
Schematic of Stage two: Dean drag force focusing of small cells. While inertial lift forces direct larger sized cells (blue) toward W1, Dean drag forces direct smaller cells (red) toward W2. Cells can thus be separated into two different outlets.
3. Materials and Methods
To demonstrate the functionality of our device, we screened fluorescent beads with nominal diameters of 6 ± 0.9 μm (similar in size to RBCs) and 18 ± 0.7 μm (similar in size to CTCs). The different-sized beads were both screened individually and in a 1:4 (6 μm: 18 μm bead) ratio mixture. To prevent clogging due to clusters of beads, we included in-plane filters that we positioned at the entrance of our devices. The beads were tested in our fabricated microfluidic device with an inlet flowrate of 300μ/min generated by a KDS 210 syringe pump.
3.1 Device Fabrication
The microfluidic devices were fabricated using standard soft lithography techniques. Briefly, we created a negative master of our device by first spin-coating a 3” silicon wafer with a 90 μm thick layer of negative photoresist (SU8 3050, Microchem). We then UV-exposed the prepared wafer to our mask, post-exposure baked for 15 minutes, and subsequently developed using SU 8 Developer (Microchem). The completed negative masters were hard baked at 150°C for 30 minutes. Polydimethylsiloxane (PDMS) was prepared at a 9:1 polymer to curing agent ratio, degassed, poured over the mold ,and cured at 85°c for 50 minutes. The cured PDMS cast was removed from the mold and the inlets and outlets were cored with a punch (Harris 1.5mm Core). The cored PDMS cast was treated with oxygen plasma with a Harrick Plasma System (PC-001) for 30 seconds and immediately bonded to a glass slide.
3.2 Particle Suspension Preparation
Fluorescent polystyrene beads of 6 ± 0.9 μm (Product No. 36-2, 15%CV, Thermo Fisher) and 18 ± 0.7 μm (Product No. 19096, 4%CV, Bangs Lab) mean diameters were used in all experiments. The 6 μm dry stock beads and the aqueous 18 μm beads were suspended and diluted, respectively, in 0.2% pluronic solution (Sigma-Aldrich) in phosphate buffer solution (PBS) to prevent particle aggregation. The weight ratio of beads in the suspension was 0.05%. The final concentration of beads was 6.3×10⁴ and 3.8×10⁴ beads/mL for the 6 μm and 18 μm beads, respectively.
4. Results & Discussion
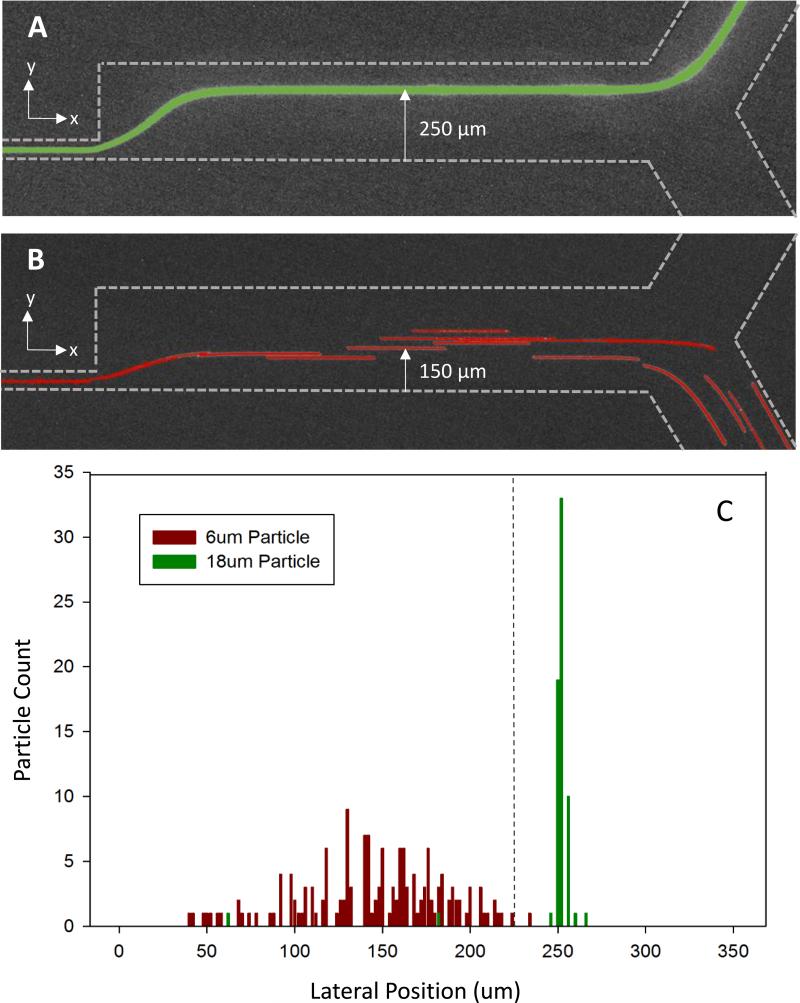
Figure 4 shows the bead streamlines and lateral position measurements at the end of the multistage separation device. The lateral position was taken as the distance from one wall of the channel straight microchannel to the particle's position within that channel, as shown in Fig. 4A and B. 18 μm green florescent beads flow in a compact streamline near one wall of the microchannel leading to a collection outlet (Figure 4A). In a separate measurement, 6 μm red florescent beads are streamlined near the opposite wall of the microfluidic channel leading to a separate outlet (Figure 4B). Time lapse videos were recorded and analyzed, frame by frame, to measure the precise lateral position of beads passing through a device that was 350 μm wide. The 6 and 18 μm beads occupied distinct lateral positions within the channel. The 6 um beads occupied an average lateral position of 150 μm from one wall of the channel. In contrast, the 18 μm beads occupied an average lateral position of 250 μm from the same wall. The distinct cut-off for separation lies at a lateral position of 225 μm (Figure 4C).
Fig. 4.
Microscopy image of particle streamlines and distribution of 6 and 18 μm particle lateral position. A) 18 μm green florescent particles confined to a tight streamline leading into an upper collection outlet B) 6 μm red florescent particles distributed within the bottom half of the microchannel to lead to lower waste outlet. C) Separation of 6 μm and 18 μm particles in multistage microfluidic separation device. Green 18 μm florescent highly concentrated at 250 μm lateral position from the bottom of the microchannel. 6 μm florescent particles distributed between 40 – 240 μm lateral positions from the bottom of the microchannel.
When screening a 1:4 mixture of 6 to 18 μm beads, we successfully sorted the different sized beads, Figure 5. All 18 μm beads were observed within a confined streamline leading toward the upper outlet while a majority of 6 μm beads went towards the lower outlet. We are currently optimizing the integration of Stage 1 and Stage 2 such that smaller particles (beads, cells) do not escape into wrong outlet.
Fig. 5.
Microscopy image of 1:4 mixture of 6 (red) to 18 (green) μm beads and their respective streamlines.
4.1 Conclusions
Although we have demonstrated our device using beads that are comparable in size to RBCs and CTCs, the work we have presented show great promise in the isolation of CTCs from patient blood samples. We should expect high recovery of the rare cells; but purity will still be an issue. In order to deplete the sample of any remaining leukocytes whose size range might overlaps with that of the targeted CTCs, we may be able to utilize immunoaffinity negative selection techniques to remove the contaminating leukocytes.
References
- 1.Hong B, Zu Y. Detecting circulating tumor cells: current challenges and new trends. Theranostics. 2013;3:377–94. doi: 10.7150/thno.5195. [DOI] [PMC free article] [PubMed] [Google Scholar]
- 2.Yu M, Stott S, Toner M, Maheswaran S, Haber DA. Circulating tumor cells: approaches to isolation and characterization. The Journal of cell biology. 2011;192:373–82. doi: 10.1083/jcb.201010021. [DOI] [PMC free article] [PubMed] [Google Scholar]
- 3.Phillips KG, Velasco CR, Li J, Kolatkar A, Luttgen M, Bethel K, et al. Optical quantification of cellular mass, volume, and density of circulating tumor cells identified in an ovarian cancer patient. Frontiers in oncology. 2012;2:72. doi: 10.3389/fonc.2012.00072. [DOI] [PMC free article] [PubMed] [Google Scholar]
- 4.Park JM, Lee JY, Lee JG, Jeong H, Oh JM, Kim YJ, et al. Highly efficient assay of circulating tumor cells by selective sedimentation with a density gradient medium and microfiltration from whole blood. Analytical chemistry. 2012;84:7400–7. doi: 10.1021/ac3011704. [DOI] [PubMed] [Google Scholar]
- 5.Autebert J, Coudert B, Bidard FC, Pierga JY, Descroix S, Malaquin L, et al. Microfluidic: an innovative tool for efficient cell sorting. Methods. 2012;57:297–307. doi: 10.1016/j.ymeth.2012.07.002. [DOI] [PubMed] [Google Scholar]
- 6.Vona G, Sabile A, Louha M, Sitruk V, Romana S, Schutze K, et al. Isolation by size of epithelial tumor cells : a new method for the immunomorphological and molecular characterization of circulatingtumor cells. The American journal of pathology. 2000;156:57–63. doi: 10.1016/S0002-9440(10)64706-2. [DOI] [PMC free article] [PubMed] [Google Scholar]
- 7.Gossett DR, Weaver WM, Mach AJ, Hur SC, Tse HT, Lee W, et al. Label-free cell separation and sorting in microfluidic systems. Analytical and bioanalytical chemistry. 2010;397:3249–67. doi: 10.1007/s00216-010-3721-9. [DOI] [PMC free article] [PubMed] [Google Scholar]
- 8.Pamme N. Continuous flow separations in microfluidic devices. Lab on a chip. 2007;7:1644–59. doi: 10.1039/b712784g. [DOI] [PubMed] [Google Scholar]
- 9.Di Carlo D, Edd JF, Irimia D, Tompkins RG, Toner M. Equilibrium separation and filtration of particles using differential inertial focusing. Analytical chemistry. 2008;80:2204–11. doi: 10.1021/ac702283m. [DOI] [PubMed] [Google Scholar]
- 10.Amini H, Lee W, Di Carlo D. Inertial microfluidic physics. Lab on a chip. 2014;14:2739–61. doi: 10.1039/c4lc00128a. [DOI] [PubMed] [Google Scholar]
- 11.Lee MG, Shin JH, Bae CY, Choi S, Park JK. Label-free cancer cell separation from human whole blood using inertial microfluidics at low shear stress. Analytical chemistry. 2013;85:6213–8. doi: 10.1021/ac4006149. [DOI] [PubMed] [Google Scholar]


