

Abstract
We developed a simulation model to study the effect of ventilation airflow rate with and without filtered recirculation on airborne contaminant concentrations (dust, NH3, CO, and CO2) for swine farrowing facilities. Energy and mass balance equations were used to simulate the indoor air quality and operational cost for a variety of ventilation conditions over a 3-month winter period, using time-varied outdoor temperature. The sensitivity of input and output parameters on indoor air quality and operational cost were evaluated. Significant factors affecting model output included mean winter temperature, generation rate of contaminants, pit-air-exchange ratio, and recirculation ratio. As mean outdoor temperature was decreased from −2.5 °C to −12.5 °C, total operational costs were increased from $872 to $1304. Dust generation rate affected dust concentrations linearly. When dust generation rates changed −50% and +100% from baseline, indoor dust concentrations were changed −50% and +100%, respectively. The selection of a pit-air-exchange ratio was found critical to NH3 concentration, but has little impact on other contaminants or cost. As the pit-air-exchange ratio was increased from 0.1 to 0.3, the NH3 concentration was increased by a factor of 1.5. The recirculation ratio affected both IAQ factors and total operational cost. As the recirculation ratio decreased to 0, inhalable and respirable dust concentrations, humidity, NH3 and CO2 concentrations decreased and total operational cost ($2216) was 104% more than with pit-fan-only ventilation ($1088). When the recirculation ratio was 1, the total operational cost was increased by $573 (53%) compared to pit-fan-only. Simulation provides a useful tool for examining the costs and benefits to installing common ventilation technology to CAFO and, ultimately, making sound management decisions.
Keywords: Swine farrowing facility, Dust, Ammonia, Air quality, Simulation, Simulink
1. Introduction
Modern swine barns are generally enclosed structures with a high density of swine, commonly referred to as confined animal feeding operations (CAFOs). Feed, swine, and swine waste contribute to elevated concentrations of hazardous airborne dust and gases in these structures. Swine barn dust suspended in the air is small enough to be inhaled, and its respirable fraction has been observed to range from 2% to 30% by mass, with an overall mean of 11% (Maghirang et al., 1997). The swine barn dust is composed of animal feed, swine feces, mold, pollen grains, insect parts, and mineral ash (Donham et al., 1986). Various gases, including ammonia (NH3), methane (CH4), and hydrogen sulfide (H2S), are released from the digestion of swine manure stored in the pit below the floor, and carbon dioxide (CO2) is generated by the respiration of swine (Donham, 1988 and Chang et al., 2001).
Inhalation of these dusts and gases have been associated with adverse health outcomes in swine workers (Donham et al., 1986, Donham et al., 1989, Larsson et al., 1994, Donham et al., 1995, Iversen et al., 2000, Kirkhorn and Garry, 2000, Donham et al., 2002, Charavaryamath et al., 2005 and Hong et al., 2012) and may also depress the health status of swine (Stombaugh et al., 1969, Drummond et al., 1980, Donham, 1991, Diekman et al., 1993 and Pedersen et al., 2000). Exposures to swine barn air induce lung inflammation and airway hyper-responsiveness (Larsson et al., 1994), chronic respiratory diseases (Donham et al., 1995) and asthma (Iversen et al., 2000) in workers. Higher concentration of hazardous gases and dusts reduced growth rate and increased respiratory health problems in swine as well (Pedersen et al., 2000). Lower exposure limits are advised for simultaneous exposure to organic dust and NH3 because of their synergistic effect on adverse respiratory health (Donham et al., 2002).
Mechanical ventilation is the primary means to control dust and gaseous contaminants in a swine barn, where air inside the barn is exhausted and clean outside air is brought into the barn. However, in winter, swine barns are generally enclosed with minimal ventilation since exhausted air must be replaced with cold outside air that must be heated, resulting in increased heating cost (Peters et al., 2012). O'Shaughnessy et al. (2010) reported that the personal inhalable dust concentrations in gestation/farrowing facilities were 4.7 times higher in winter than summer. Takai et al. (1998) observed that lower ventilation rates led to about 30% higher inhalable dust concentrations in winter compared to summer. Reeve et al. (2013) found that the use of pit fans in winter reduced dust, NH3 and H2S concentrations in a farrowing facility. Where H2S concentration was low with or without the pit fans in operation, they found that NH3 and dust concentrations remained above concentrations associated with adverse health outcomes.
Numerous researchers have used computer simulations to study the effect of mechanical ventilation in livestock facilities on parameters of heat, moisture and CO2. Soldatos et al. (2005) developed a control method based on simulation of temperature and humidity in swine barn during summer and winter. Pedersen et al. (1998) investigated the agreement between estimates of the ventilation airflow based on the heat, moisture and CO2 balances in houses for cattle, swine and laying hens. Schauberger et al., 2000a and Schauberger et al., 2000b applied heat, CO2 and odor balances to predict the indoor climate in a fattening and finishing swine unit. Blanes and Pedersen (2005) compared ventilation airflow measured in a swine barn to that calculated from heat, moisture and CO2 balances. Cortus et al. (2010a) simulated recirculated air and filtration for a swine barn using heat, moisture and gas balances. However, the effect of ventilation airflow rate and filter performance on energy consumption has not been studied. Further, no simulation studies have addressed how ventilation airflow rates affect the levels of multiple contaminants present in livestock facilities.
In this study, we developed a mass and energy simulation model to study the effect of ventilation airflow rate, both with and without filtered recirculation, on airborne contaminant concentrations (dust, NH3, CO, and CO2) specifically for swine farrowing facilities. Given inputs of ventilation configuration (e.g., airflow rate and air pollution control device efficiency) and weather conditions (temperature), the simulation model was designed to output: (1) air quality factors (temperature, humidity, and contaminant concentrations) and (2) operational costs associated with heating required maintain optimal temperatures for sows and piglet production and electricity required to run ventilation equipment. In this manuscript, we present the model and include a sensitivity analysis to determine the most important input parameters influencing air quality and operational cost in a swine farrowing facility in winter. We focus here on farrowing because this phase of swine rearing requires workers to spend long hours in the barn performing a number of specialized tasks. In future studies, we will use the model to optimize ventilation systems for livestock facilities to provide good air quality at the lowest cost.
2. Method
2.1. Simulated swine farrowing facility
A generalizable model was developed, but parameters were assigned to represent the building and operation of a specific swine farrowing facility (Mansfield Swine Education Center at Kirkwood Community College, Cedar Rapids, IA, USA). In previous research (Reeve et al., 2013), we fully described this facility (e.g., dimensions and airflow rates) and contaminant concentrations measured inside the facility in winter. Briefly, four wall fans and two pit fans were fixed on the north and south room walls and at the end of pit on the west side of the building, respectively (Fig. 1(a) and (b)). Wall fans were turned off but pit fans were turned on in winter time. The airflow rate of each pit fan was 0.412 m3/s (=872 ft3/min). There were two gas heaters (17,585 W = 60,000 BTU/h each), which cycled on when room temperature dropped below 20 °C (=68°F) and cycled off when room temperature exceeded 22.2 °C (=72°F). In addition, one electrical heating lamp (125 W) was positioned in each of the 20 crates housed in the room. Two manure pits were located under the four rows of crates housed in this farrowing room, with pit air exchanging with room air above the slatted floor (Qae). For the simulation model, an air pollution control (APC) device (filtration unit with shaker) was simulated outside the farrowing facility such that room air was treated by the APC device to remove the dust. After removing dust, a portion of treated room air (rapc = 0–1.0) was recirculated into the room. When less than 100% treated air was brought back into the room, cold (but clean) outdoor air was added to recirculated air to maintain system balance. Contaminant concentrations measured in the facility in winter as reported by Reeve et al. (2013) were used to validate the model.
Fig. 1.
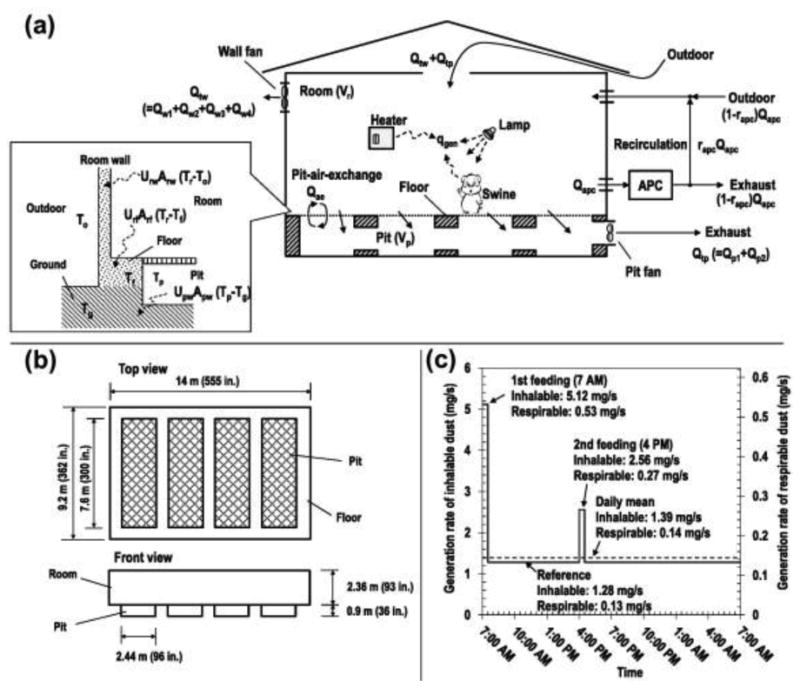
Schematic diagram of the modeled swine farrowing facility, identifying (a) airflow pathways and (b) dimensions. Time-dependent dust generation depicted in panel (c).
The simulated room volume was divided into two compartments, as shown Fig. 1(a). One section was the habitable portion of the building occupied by swine and workers, the other section contained the manure pit for storing the waste from swine. The room was assumed to be a rectangular box with a total room volume (Vr) of 304 m3 (W × L × H = 14 m × 9.2 m × 2.36 m) as shown in Fig. 1(b). The pit was modeled as four equally sized rectangular boxes with a total pit volume (Vp) of 66.8 m3 (4 × 2.44 m × 7.6 m × 0.9 m). Both metal and plastic grating separated the swine crates from the manure pit. Simulations were conducted using the total occupancy of the field test site: 20 sow (181.4 kg each) and 170 piglets (4.53 kg each). Time-dependent dust generation incorporated two daily feeding periods, as shown in Fig. 1(c).
This project generated a time-dependent simulation model using MatLab® R2011b (version 7.13.0.564, MathWorks, Inc., Natick, Massachusetts, USA) with Simulink® (version 7.8, MathWorks Inc.).
2.2. Temperature equations
Energy balance equations were used to calculate the temperature of room and pit as follows,
Room:
| (1) |
Pit:
| (2) |
where ρa is the air density (1.225 kg/m3) and ca is the specific heat at constant pressure of air (1005.4 J/kg K). Arw, Arf, Apw are the surface area of the room-walls (including ceiling), floor, and pit-walls, respectively. The temperature of room, pit, outdoor, floor, and ground are indicated by Tr, Tp, To, Tf, and Tg, respectively. We assumed that Tf was the same as Tg, which was set to 0.9 °C, the mean soil temperature of Cedar Rapids, IA, US from December 2011 to February 2012, the period of the field study for model validation. The total airflow rate of the four wall fans is Qtw = Qw1 + Qw2 + Qw3 + Qw4, which was set to zero during winter to match our test facility. The total airflow rate of two pit fans is Qtp = Qp1 + Qp2. The airflow rate of the APC fan (Qapc) was set to zero (no air cleaning) or 0.472 m3/s (=1000 ft3/min), and the recirculation ratio (rapc) was varied from 0 (outdoor air only) to 1.0 (room air only). The airflow rate of pit-air-exchange (Qae) was varied from 1% to 21% of the total ventilation rate (Cortus et al., 2010b). Total heat generation rate (q̇gen) summed sources from the heaters (q̇heater), heating lamps (q̇lamp) and swine (q̇swine) is,
| (3) |
The heat generation rate by 20 sows and 170 piglets was calculated as (Brown-Brandl et al., 2004),
where msow and mpiglet are the total weights of sows and piglets, respectively. Constant values for heat transfer coefficients (U-values) in Eqs. (1) and (2) were used for the room-walls (Urw = 0.286 W/m2 K), room-floor (Urf = 0.568 W/m2 K), and the pit-walls (Upw = 0.568 W/m2 K), (Zhang and Barber, 1993). For this simulation, U-value of ceiling and Urf were assumed to be the same as Urw and Upw, respectively.
A non-constant outside temperature (To) was used to reflect within- and between-day temperature changes typical of diurnal and seasonal cycles in the Midwest. The outside temperature was computed as a combination of sine waves,
| (5) |
The first sine wave equation has a frequency of 24 h, used to generate simulated temperature changes throughout a day, and the second sine wave has a frequency of 365 days, used to generate simulated temperature changes over a year. Tbias was included to adjust the baseline temperature to a mild winter (Tbias = 283 K, mean −2.5 °C), a median winter (Tbias = 278 K, mean −7.5 °C), or an extremely cold winter (Tbias = 273 K, mean −12.5 °C) the average temperature over the 3-month period. These values were chosen to represent averaged winter temperatures in Cedar Rapids, IA, US for six years. The simulation starting time was 7 AM on December 1st and proceeded through the end of February for 90 days.
2.3. Indoor air quality (IAQ) equations
Under the assumption of a well-mixed indoor space and steady-state conditions, the mass-balance equations for dust, humidity, NH3, CO and CO2 for the pit and room volumes were as follows,
Room:
| (6) |
Pit:
| (7) |
where Po is the outdoor concentration, Pr is the room concentration, and Pp is the pit concentration. Values for the input parameters for the contaminant generation rate for the room (ĠPr) and for the manure pit, (ĠPp) and the APC device (ηP) are given in Table 1. Additional details on these parameters are discussed below.
Table 1. Input parameters for IAQ calculation.
| Parameter | Description | Inhalable dust | Respirable dust | Humidity | NH3 | CO | CO2 |
|---|---|---|---|---|---|---|---|
| Po | Outdoor concentration | 0 (mg/m3) | 0 (mg/m3) | 0 (kg/m3) | 0 (ppm) | 0 (ppm) | 400 (ppm) |
| ĠPrĠPr | Generation rate in the room | 1.39 (mg/s) | 0.14 (mg/s) | 2.9 (g/s) | 0 (mg/s) | 0.6a(mg/s) | Heater: 1800a Swine: 1060a (mg/s) |
| ĠPpĠPp | Generation rate in the pit | 0 (mg/s) | 0 (mg/s) | 0 (kg/s) | 1.11a(mg/s) | 0 (mg/s) | 400a(mg/s) |
| ηP | Removal efficiency | 0–1 | 0–1 | 0 | 0 | 0 | 0 |
As conversion factor, 1.141, 0.856, and 0.546 were used to change the unit of mg to one of ppm for NH3, CO and CO2, respectively.
2.3.1. Dust
The overall mean inhalable and respirable dust generation rates per 500-kg swine mass were 567 and 59 mg/h 500-kg, respectively (Takai et al., 1998). From 20 sows and 170 piglets, the mean generation rates of inhalable and respirable dust were calculated as 1.39 and 0.14 mg/s, respectively. To account for the fact that dust generation depends on feeding time, the dust generation rate was assumed to increase during the feeding as shown in Fig. 1(c). The first feeding was prescribed at 7 AM and the second feeding at 4 PM. Dust concentrations at first feeding and second feeding were modeled as four and two times higher than reference concentration, respectively, based on previous research (O'Shaughnessy et al., 2010).
2.3.2. Humidity
Outdoor air was assumed to be dry in winter, and the input value for outdoor humidity was assumed zero. Humidity was assumed to be generated only by swine respiration. The humidity generation rate based on swine weight is about 2.4 g/kg h (Scott et al., 1983). From this, total vapor generation rate was calculated to 2.9 g/s.
2.3.3. Ammonia (NH3)
The only source of NH3 was assumed to be the waste in the pit. The total NH3 generation rate in the pit was assigned a value of 1.11 mg/s, using Iowa farrowing facility emission data measured by Cortus et al. (2010c), who reported a mean NH3 emission rate of 180 g/day in a winter cycle (December 2008–February 2009) for a 139 m2 manure pit area.
2.3.4. Carbon monoxide (CO)
CO was generated by heaters in the room. When heaters were turned on, the CO generation rate was 0.6 mg/s, which was calculated using,
| (8) |
where Qheater is the natural gas consumption of two heaters (2 × 0.472 L/s = 2 × 60 ft3/h). The CO emission rate from natural gas combustion, ERCO, was 640 kg/106 m3 (40 lb/106 ft3) (EPA, 1998).
2.3.5. Carbon dioxide (CO2)
Outdoor CO2 concentration in proximity to swine barn was reported between 186 and 408 ppm (Pedersen et al., 1998); we used 400 ppm as the outdoor concentration of CO2. Sources of CO2 inside the barn included heaters, swine exhalation in the room, and digestion of slurry in the pit. CO2 generation rate by heaters was assumed to be zero when off and 1800 mg/s when on, which was calculated as,
| (9) |
where ERCO2 is the CO2 emission rate from natural gas combustion (1,920,000 kg/106 m3 = 120,000 lb./106 ft3) (EPA, 1998). The generation of CO2 by swine respiration was assigned a constant value of 1060 mg/s, based on 20 head of swine in the barn (Blanes and Pedersen, 2005). The generation of CO2 from slurry in the pit was 400 mg/s, taken as 37.5% of swine exhalation (Ni et al., 1999).
2.3.6. Cost simulation
Total operational costs for three months in winter were calculated as,
| (10) |
where Pelect is the electricity cost, Pgas is the natural gas cost, q̇fan q̇fan and q̇apc q̇ apc are power consumption of pit fans (345 W each) and APC devices (4950 W), respectively. The switch function of heater operation (Sheater) was computed by the model as 0 (off) or 1 (on) at any moment in time as determined by the need for the heater to activate to warm the room, based on computed room temperatures. Calculations were performed using an electricity cost of $0.0536/kW h, which was the industrial price in Iowa in 2010, and natural gas cost of 0.19 $/m3 (=5.39 $/1000 ft3), which was the average industrial price in Iowa during December 2011–February 2012.
2.4. Simulation scenarios and sensitivity analysis
Simulations were performed for three different ventilation conditions: (1) pit fans as the only ventilation, (2) pit fans and recirculation with no APC device (ηP = 0), and (3) pit fans and recirculation with a dust filtration system as the APC device (ηP ≠ 0). Simulation conditions are documented in Table 2. Baseline output was obtained for each ventilation condition with the following parameters fixed: two pit fans operating, medium cold outdoor temperature, wall insulation of 0.286 W/m2 K, pit-air-exchange ratio of 0.1, and daily mean inhalable and respirable dust generation rates of 1.39 and 0.14 mg/m3 (with two 30-min peak periods). For the simulations that included recirculation, the baseline of recirculation ratio was 0.75. For the APC device applied scenarios, the baseline conditions were recirculation ratio of 0.75 and dust collection efficiency of 100%.
Table 2. Simulation conditions.
| Ventilation condition | Variable parameters | Values | Fixed parameters |
|---|---|---|---|
| Pit-fans-only | Pit fan | One pit fan | Medium cold Wall insulation: 0.286 W/m2·K Pit-air-exchange ratio: 0.1 Inhalable dust: 1.39 mg/s Respirable dust: 0.14 mg/s |
| Two pit fans | |||
|
| |||
| Outdoor temperature | Mild cold | Two pit fans Wall insulation: 0.286 W/m2·K Pit-air-exchange ratio: 0.1 Inhalable dust: 1.39 mg/s Respirable dust: 0.14 mg/s |
|
| Medium cold | |||
| Extremely cold | |||
|
| |||
| Wall insulation (W/m2·K) | 0.2 | Two pit fans Medium cold Pit-air-exchange ratio: 0.1 Inhalable dust: 1.39 mg/s Respirable dust: 0.14 mg/s |
|
| 0.286 | |||
| 0.3 | |||
| 0.4 | |||
|
| |||
| Pit-air-exchange ratio | 0.01 | Two pit fans Medium cold Wall insulation: 0.286 W/m2·K Inhalable dust: 1.39 mg/s Respirable dust: 0.14 mg/s |
|
| 0.10 | |||
| 0.20 | |||
| 0.30 | |||
|
| |||
| Pit fans + Recirculation | Recirculation ratio | 0 | Two pit fans Medium cold Wall insulation: 0.286 W/m2·K Pit-air-exchange ratio: 0.1 Inhalable dust: 1.39 mg/s Respirable dust: 0.14 mg/s |
| 0.25 | |||
| 0.50 | |||
| 0.75 | |||
| 1.00 | |||
|
| |||
| Pit fans + Recirculation + APC device | Filtration efficiency | 0.50 | Two pit fans Medium cold Wall insulation: 0.286 W/m2·K Pit-air-exchange ratio: 0.1 Recirculation ratio: rapc = 0.75 Inhalable dust: 1.39 mg/s Respirable dust: 0.14 mg/s |
| 0.75 | |||
| 1.00 | |||
|
| |||
| Recirculation ratio | 0.25 | Two pit fans Medium cold Wall insulation: 0.286 W/m2·K Pit-air-exchange ratio: 0.1 Filtration efficiency: 1.00 Inhalable dust: 1.39 mg/s Respirable dust: 0.14 mg/s |
|
| 0.50 | |||
| 0.75 | |||
| 1.00 | |||
|
| |||
| Dust generation (mg/s) Inhalable/Respirable dust |
0.69/0.07 | Two pit fans Medium cold Wall insulation: 0.286 W/m2·K Pit-air-exchange ratio: 0.1 Recirculation ratio: rapc = 0.75 Filtration efficiency: 1.00 |
|
| 1.39/0.14 | |||
| 2.77/0.29 | |||
Sensitivity to the model's output was examined by varying the pit fan (one or two pit fans on), outdoor temperature (±5 °C mean winter season), wall insulation (0.2–0.4 W/m2 K), pit-air-exchange ratio (0.01–0.3), amount of recirculation ratio (0–1), and dust generation factors (inhalable 0.69–2.77 mg/s and respirable 0.07–0.29 mg/s). Changes in cost and contaminant concentrations associated with these range of factors will be reported. Results from pit-fan-only simulations were compared to field measurements to determine model parameters that best represent the test site.
3. Results and discussion
All simulated output results are documented in supplementary information (Table S1). The notable results are presented in Table 3 and Table 4. Bold values are baseline conditions. Notable across all simulations was the general trend of particle concentrations increasing over the first 8-h of the day (7 AM to 3 PM), corresponding with feeding events, but then decreasing over the subsequent 8-h periods. For all other contaminants, the values within a day had little change, primarily due to constant generation rates for the contaminant sources within the barn. Even accounting for within- and between-day temperature changes, contaminant concentrations within any one simulation scenario remained relatively constant. While we were interested in using the model to examine the frequency of cases in which concentrations exceeded recommended occupational exposure limits, the lack of variability across the three month study period allowed us to examine and report 3-month mean concentrations as the general contaminant level in the barn.
Table 3. Simulation results for pit fans only (bold indicates baseline condition).
| Pit fan number | ||||
|---|---|---|---|---|
| Parameter | 1 pit fan | 1 pit fan (measured)a | 2 pit fans | |
| NH3 (ppm) | 0.35 | 3.9 | 0.17 | |
| CO (ppm) | 0.13 | 1.16 | 0.32 | |
| CO2 (ppm) | 2100 | 2920 | 1750 | |
| Total operational cost ($) | 472 | - | 1088 | |
|
| ||||
| Winter 3-Month Mean Outdoor Temperature | ||||
| Parameter | Extremely cold (-12.5°C) | Medium cold (-7.5°C) | Mild cold (-2.5°C) | |
|
| ||||
| NH3 (ppm) | 0.17 | 0.17 | 0.17 | |
| CO (ppm) | 0.42 | 0.32 | 0.23 | |
| CO2 (ppm) | 1940 | 1750 | 1560 | |
| Total operational cost ($) | 1304 | 1088 | 872 | |
| Wall Insulation (W/m2·K) | ||||
| 0.2 | 0.286 | 0.3 | 0.4 | |
|
| ||||
| NH3 (ppm) | 0.17 | 0.17 | 0.17 | 0.17 |
| CO (ppm) | 0.31 | 0.32 | 0.33 | 0.34 |
| CO2 (ppm) | 1730 | 1750 | 1750 | 1780 |
| Total operational cost ($) | 1064 | 1088 | 1091 | 1119 |
| Pit-air-exchange ratio | ||||
| 0.01 | 0.1 | 0.2 | 0.3 | |
|
| ||||
| NH3 (ppm) | 0.02 | 0.17 | 0.32 | 0.44 |
| CO (ppm) | 0.32 | 0.32 | 0.33 | 0.33 |
| CO2 (ppm) | 1720 | 1750 | 1770 | 1790 |
| Total operational cost ($) | 1083 | 1088 | 1093 | 1097 |
Measured data from Reeve et al. (2013)
Table 4. Simulation results for recirculation ratio (bold indicates baseline condition).
| Parameter |
|
||||
|---|---|---|---|---|---|
| 0 | 0.25 | 0.5 | 0.75 | 1 | |
| Inhalable dust (mg/m3) | 1.07 | 1.18 | 1.31 | 1.47 | 1.68 |
| Respirable dust (mg/m3) | 0.11 | 0.12 | 0.14 | 0.15 | 0.17 |
| Humidity (kg/m3) | 2.26 | 2.49 | 2.77 | 3.12 | 3.56 |
| NH3 (ppm) | 0.11 | 0.12 | 0.14 | 0.15 | 0.17 |
| CO (ppm) | 0.37 | 0.37 | 0.37 | 0.35 | 0.32 |
| CO2 (ppm) | 1570 | 1630 | 1670 | 1710 | 1750 |
| Total operational cost ($) | 2216 | 2122 | 1995 | 1828 | 1661 |
3.1. Pit fan ventilation only
For the baseline condition, mean inhalable dust concentration for winter was 1.68 mg/m3. Mean inhalable dust concentration for 8 h was 1.85 mg/m3 during the period of 7 AM to 3 PM and decreased to 1.65 mg/m3 and 1.55 mg/m3 during the period of 3 PM to 11 PM and 11 PM to 7 AM, respectively. Higher inhalable dust concentrations coincided with feeding (first feeding at 7 AM, second feeding at 4 PM, and no feeding at night). Respirable dust concentrations were similar to inhalable dust results. The mean respirable dust concentration during winter was 0.17 mg/m3. The mean respirable concentrations were 0.19 mg/m3 during 7 AM to 3 PM, 0.17 mg/m3 during 3 PM to 11 PM, and 0.16 mg/m3 during 11 PM to 7 AM. Humidity and NH3 concentration were 3.56 kg/m3 and 0.173 ppm.
3.1.1. Pit fan
When only one pit fan was turned on, dust concentrations, humidity, and NH3 concentration were doubled compared to baseline (two pit fans on). These results are consistent with mass balance, which dictates that contaminant concentrations are directly proportional to airflow in the facility. However, CO concentration was lowered from 0.32 to 0.13 ppm because less heating was required to heat cold outdoor air with only one fan on compared to two fans on.
Measured respirable dust concentrations (0.33 mg/m3) matched simulated concentrations (0.35 mg/m3) well (Reeve et al., 2013). However, NH3 concentrations in the test site averaged 3.9 ppm, whereas the simulation provided a concentration of 0.13 ppm. This discrepancy is discussed below. CO2 concentration was 2100 ppm, which was slightly lower than what was observed during field testing (2900 ppm).
3.1.2. Outdoor temperature
Although outdoor temperatures did not affect indoor inhalable and respirable dust concentrations, humidity, and NH3 concentration, they were an important determinant in CO and CO2 concentrations as shown Fig. 2(a) and (b). Concentrations of CO and CO2 decreased about 0.02 ppm and 38 ppm, respectively, for each 1 °C increase in outdoor temperature. Within a day, CO and CO2 concentrations were highest during the coldest period because the heater, which produces CO and CO2, must operate more frequently and for a longer time to maintain acceptable indoor air temperatures. While CO concentrations increased throughout the day, at no time were levels in the range of health concerns. However, heaters in need of maintenance could generate significantly more CO than what was modeled here, so maintenance concerns, particularly in colder conditions, are warranted. Concentrations of CO2 exceeded comfort levels established by ASHRAE 62-1999 (1000 ppm) and were generally higher than industry recommendations (1540 ppm) (Donham et al., 1989).
Fig. 2.
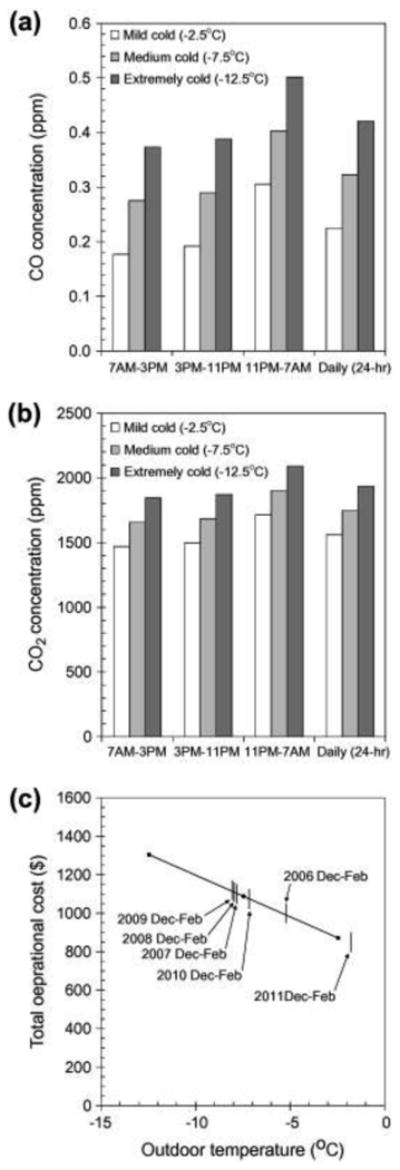
CO, CO2 concentrations and total operational costs for seasonal mean outdoor temperatures.
As shown in Fig. 2(c), when the mean outdoor temperature was −2.5 °C (mild cold winter), the total operational cost was $872. When the mean outdoor temperature was decreased to −7.5 °C (medium cold winter) and −12.5 °C (extremely cold winter), total operational cost was increased to $1088 (25%) and $1304 (50%), respectively. Operational costs of pit fans and heating lamps were $80 and $289, respectively, and were not changed with changes in outdoor temperature. However, the change in the operational costs of heater use was substantial, since longer and more frequent heating was required to maintain acceptable indoor temperatures with colder outdoor temperature. When the mean outdoor temperature decreased by 1 °C, the total operational cost increased about 4% until reading an upper limit defined by the condition when heaters were continuously on. Mean winter outdoor temperatures in Cedar Rapids were added in Fig. 2(c) to illustrate the range of studied temperatures relative to recent historical temperatures observed near our test facility.
3.1.3. Wall insulation
Wall insulation did not affect IAQ except CO and CO2 concentration. As shown in Table 3, indoor CO and CO2 concentrations changed linearly with heat transfer coefficient of wall. When the heat transfer coefficient for the room walls (U-value) was increased from 0.2 to 0.4, CO and CO2 concentrations increased by 7.9% and 2.7%, respectively. Wall insulation affected indoor heating time. Less insulation means increasing heating time, which results in increased generation of CO and CO2.
Total operational costs are also documented in Table 3. When the U-value was 0.2 W/m2 K, the total operational cost was $1064. When the U-value was increased to 0.4 W/m2 K, total operational cost was increased by only 5% to $1119. Generally, a well-insulated wall has a U-value of less than 0.25 W/m2 K (Doran, 2000). The model farrowing facility had a slightly higher value (0.286 W/m2 K) than a well-insulated wall.
3.1.4. Pit-air-exchange ratio
The pit-air-exchange ratio did not affect inhalable and respirable dust concentration or humidity estimations, as anticipated, although it did affect NH3, CO and CO2 concentrations as shown in Table 3. When the pit-air-exchange ratio was increased from 0.1 to 0.3, NH3 concentration was increased by 154% from 0.173 ppm to 0.440 ppm, both well below the 7 ppm industry exposure recommendations (Donham et al., 1995). When the pit-air-exchange ratio was increased from 0.1 to 0.3, CO and CO2 concentrations were increased by 1.3% and 2.5%, respectively. Since NH3 was generated only from the pit and transferred to the room via the pit-air-exchange ratio, accurate characterization of the exchange factor is recommended as future work to accurately model NH3 concentrations. The pit-air-exchange ratio is important to estimate NH3, and this model indicates that minimizing the transfer between under crate manure pits and the room air above it can aid in minimizing NH3 concentrations in the room. CO2 was generated from the pit, the heaters, and swine respiration; therefore it was not surprising that CO2 concentration was affected more by heating time than pit-air-exchange ratio. Note that the test facility used to generate this simulation had a relatively deep manure pit compared to other farrowing facilities in the Midwest, and the extra air between the top of the pit liquid and the room may not represent other farrowing facilities.
Total operational cost changed by less than 1% by adjusting the pit-air-exchange ratio. When the pit-air-exchange ratio was increased from 0.1 to 0.3, total operational cost changed minimally because pit-air-exchange did not change indoor heating needs.
3.2. Ventilation with recirculation
IAQ parameters as a function of recirculation ratio are provided in Table 4. When the recirculation ratio was 1, the IAQ was the same as with pit-fan-only ventilation: without clean outdoor air, contaminants were not diluted. As the recirculation ratio decreased to 0, inhalable and respirable dust concentrations, humidity, NH3 and CO2 concentrations decreased, as fresh air with negligible contaminant concentrations replaced exhausted air. However, CO concentration increased with decreased recirculation, as heaters had longer on cycle times, generating more CO. However, the CO concentration did not change linearly, as estimates stabilized at 0.37 ppm for recirculation ratio of 0–0.5.
When the recirculation ratio was 1, the total operational cost was increased by $573 (53%) compared to pit-fan-only due to the operational cost of APC device fan. Concentrations were lower when the recirculation ratio was 0 (i.e., 0% of the air returning to the building). However, the total operational cost ($2216) was 104% more than with pit-fan-only ventilation ($1088). Increased costs were attributable to energy needed to move the air through the ventilation system and to heat the makeup air. This increased cost is the primary reason why swine barns operators reduce airflow through the buildings during the Midwest winters.
3.3. Ventilation with recirculation and filtration
A more realistic intervention to reduce contaminant concentrations in winter in swine CAFO is to ventilate the building, treat the air, then reintroduce the still warm air into the building. This proposes to reduce heating costs and reduce contaminant concentrations. However, efficient and cost-effective equipment may not be available for all contaminants. For this study, we examined a single air pollution control device (APC) to remove particulates and examine recirculating this treated air into the barn. Because this APC does not remove other contaminant gases (e.g., NH3, CO2), we examined the combination of diluting treated air with fresh (but cold) ambient air to examine cost and mean barn concentrations.
3.3.1. Dust filtration efficiency
Inhalable and respirable dust concentrations for APC with three filtration efficiencies (1.0, 0.75, and 0.5) are shown in Fig. 3(a). When the filtration efficiency was 1 (i.e., 100% dust collection), both dust concentrations were the same as that of ventilation without an APC device operated at recirculation ratio of 0. However, the benefit of reduced heating costs (identical to the recirculation ratio 1 without an APC) was achieved. Total operational cost decreased from $2216 to $1661 with the same dust concentrations. As the filtration efficiency was decreased to 0.75 and 0.5, both inhalable and respirable dust concentrations were increased by 7.3% and 15.8%, respectively.
Fig. 3.
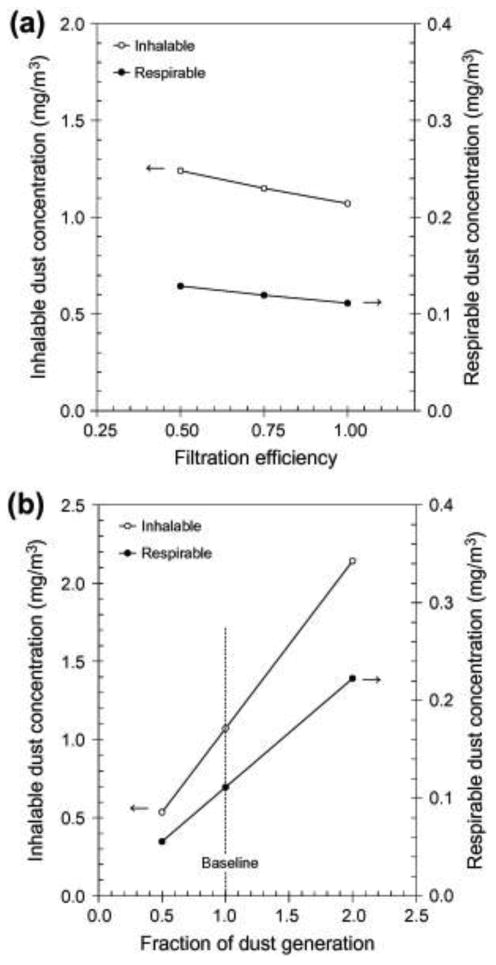
Dust concentrations for filtration efficiency and fraction of dust generation.
In reality, many dust control systems (cyclone, electrostatic precipitator, filtration system) report collection efficiencies in the range of 92–100% for the large particles typical of swine barns. While the baseline concentrations of the pit-fan-only operation yielded seasonal daytime mean indoor respirable dust concentrations 0.19 mg/m3 for this barn, the use of a filtration device and 100% recirculation could reduce these mean, and possibly peak, concentrations by a factor of two.
3.3.2. Recirculation ratio
When the APC efficiently removes particles (filtration efficiency of 1), there is no difference in estimates of dust concentrations with changing recirculation ratio. Inhalable and respirable dust concentrations were 1.17 mg/m3 and 0.11 mg/m3, which are same as results of APC device without filter at recirculation ratio of 0. Bringing dust-free air in from the outside (cold) versus dust-free air from the APC unit (warm) makes no difference to dust concentrations. However, selection of the recirculation ratio does affect cost (heating) and concentrations of other contaminant gases that can accumulate with no fresh air. As the recirculation ratio was increased to 1, humidity, NH3, and CO2 concentration increased, but CO concentration and total operational cost were decreased.
3.3.3. Dust generation rate
Changes in the dust generation rate (50% reduction and 200% increase) had a linear effect of estimates of indoor inhalable and respirable concentrations, as shown in Fig. 3(b). While dust generation events had two peaks, 30-min events during each 24-h period, the effects of room concentration were seen throughout the daytime shift. The model output is sensitive to the estimate of dust generation, and extra caution to characterize a realistic estimate for dust generation is necessary when applying this model to estimate room concentrations.
3.4. Sensitivity between inputs and outputs
A schematic of the relationship between required model inputs and computed outputs is shown in Fig. 4. Outdoor temperature, wall insulation, pit-air-exchange ratio, and recirculation ratio all affected heater operational cost. Outdoor air temperature and recirculation ratio were more sensitive to heater operation than wall insulation and pit-air-exchange ratio, since cooling by incoming outdoor air affected more than heat loss through wall and pit-air-exchange ratio was had little effect relative to other factors. Any operation that increased the duration that the heater stayed on, in order to maintain the CAFO temperature between 20 and 22.2 °C to optimize swine health, resulted in increased CO and CO2 concentration and total operational cost. Pit-air-exchange ratio and recirculation ratio affected to indoor NH3, CO and CO2 concentrations, although NH3 was the most sensitive to the pit-air-exchange ratio was because the only NH3 source was in the pit. However, CO and CO2 concentration were more sensitive to the recirculation ratio than the pit-air-exchange ratio since additional CO and CO2 sources were in the room.
Fig. 4.
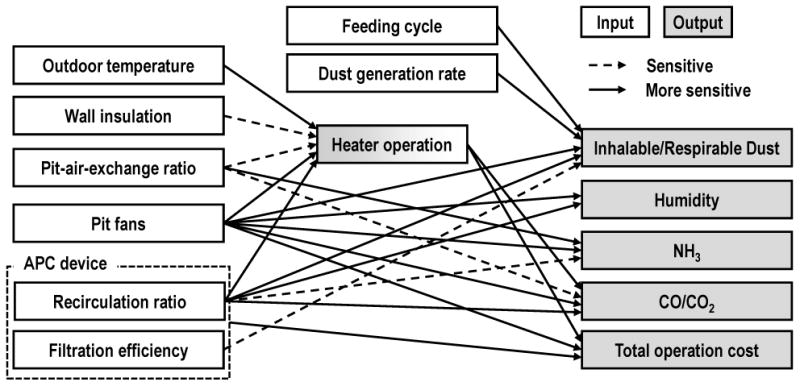
Depiction of sensitivity between inputs and outputs.
Feeding cycle, dust generation rate, recirculation ratio, and filtration efficiency affected indoor dust concentrations. Feeding cycle affected time dependent dust concentrations. Dust generation rate and recirculation ratio were more sensitive than filtration efficiency since it was assumed that outdoor air was clean and there was no cross contamination between exhausted air and incoming air. Estimated dust concentrations changed linearly with dust generation rates. While the APC device increased total operational costs relative to current pit-fan-only farrowing facilities, heat can be recovered while particulate levels are reduced. Thus, it is more cost efficient to ventilate, treat, and recirculate the air (53% more expensive than two pit fans) than to ventilate the barn without treating the air (104% more expensive than two pit fans). Increased operating costs, relative to the pit-fan-only baseline condition, can be expressed in terms of per piglet production for the 90-day winter period, using 10 piglets/sow, 20 sows for the room and a 21-day farrowing cycle: recirculated air costs an additional $0.67 per piglet, while ventilation with heating 100% fresh air was an additional $1.32 per piglet.
The recirculation ratio, describing how much air from the air exhausted out of the barn, was most important parameter because it affects all output parameters, except NH3 concentration. Finding an optimal recirculation ratio is complex since there is a trade-off between total operational cost (heating increases with decreased recirculation) and the IAQ (quality decreases for some contaminants with increased recirculation, but decreases with others). For example, increasing the recirculation ratio decreased total operational cost and CO concentration, however, increased other indoor contaminants.
Simulation provides a useful tool for examining the costs and benefits to installing common ventilation technology to CAFO and, ultimately, making sound management decisions. However, there are some limitations to this model. The findings presented here apply only to the physical geometry and occupancy of the test barn used to test and examine the barn. The manure pit dimensions and, hence, pit-air-exchange ratio, apply only to the deep manure pit in this barn, atypical of newer farrowing structures, where the shallow manure pit's air volume decreases at a much larger rate than the one modeled here. This model also assumed that three walls were in direct contact with the outside, whereas the modern farrowing facility typically has a limited number of walls in contact with the outside air; cost savings from heat-exchange factors (U-values) may be less of an issue with other structure types. Finally, all farrowing rooms have doors, gaps in ventilation seals, and structural gaps that allow cold, fresh air in during the cold winter. For example, most openings in CAFO consist of louver covered radial fans, perhaps with plastic covering for sealing during the winter, but these surfaces represent a small fraction of the total wall surface although infiltration through the louver affects indoor temperature similar to pit fan operation. We only examined one geometry and production level (20 sows), so we cannot yet extrapolate to other farrowing facility layouts or occupancy. However, the model generated similar concentrations to the test site for which the model parameters dimensions and management practices were based, indicating a reasonable baseline model to relate indoor air quality, ventilation, heating needs, and operational costs for ranking basic ventilation/APC performance for indoor air quality intervention investigations.
4. Conclusions
We developed and evaluated a mass and energy balance model to examine the relationship between indoor air quality, wintertime ventilation, air pollution control equipment, and heating needs within a swine farrowing CAFOs. Significant factors affecting model output include mean ambient air over the winter period, generation rate of contaminants within the barn (e.g., dust generation), and recirculation. The selection of a pit-air-exchange ratio is critical to model NH3 concentrations, but has little impact on other contaminants or cost. For the barn geometry and occupancy associated with the input parameters for the model presented here, the effect of using a 0.472 m3/s ventilation system to reduce inhalable dust concentrations by 36% over the current pit-fan-only operation by either using an efficient filtration system and recirculation of 1, at an increased cost of 53% ($0.67/piglet) but with a build-up of CO2, or by simply exhausting 100% of the air at a cost of 104% ($1.32/piglet), with no buildup of CO2.
In future studies, we will use the model to optimize ventilation systems for livestock facilities to provide good air quality at the lowest cost. We will also include an APC device with NH3 removal in future simulations.
Supplementary Material
Acknowledgments
This research was funded by CDC/NIOSH Great Plains Center for Agricultural Health, U50 OH007548.
References
- American Society of Heating, Refrigerating and Air-Conditioning Engineers (ASHRAE) Ventilation for Acceptable Indoor Air Quality (62-1999) Atlanta, Ga: [Google Scholar]
- Blanes V, Pedersen S. Ventilation flow in pig houses measured and calculated by carbon dioxide, moisture and heat balance equations. Biosyst Eng. 2005;92:483–493. [Google Scholar]
- Brown-Brandl TM, Nienaber JA, Xin H, Gates RS. A Literature review of swine heat prodiction. Am Soc Agric Engs. 2004;47:250–270. [Google Scholar]
- Chang CW, Chung H, Huang CF, Su HJJ. Exposure assessment to airborne endotoxin, dust, ammonia, hydrogen sulfide and carbon dioxide in open style swine houses. Ann Occup Hyg. 2001;45:457–465. [PubMed] [Google Scholar]
- Charavaryamath C, Janardhan KS, Townsend HG, Willson P, Singh B. Multiple exposures to swine barn air induce lung inflammation and airway hyper-responsiveness. Respir Res. 2005;6:50. doi: 10.1186/1465-9921-6-50. [DOI] [PMC free article] [PubMed] [Google Scholar]
- Cortus EL, Spronk S, Lanoue C, Nicolai R, Pohl S. ASABE/CSBE North Central Intersectional Meeting. MBSK; 2010a. Heat and moisture balances for a new barn design with recirculated air; pp. 10–202. [Google Scholar]
- Cortus EL, Lemay SP, Barber EM. Dynamic simulation of ammonia concentration and emission within swine barns Part I. Model development. Am Soc Agric Biol Engs. 2010b;53:911–923. [Google Scholar]
- Cortus EL, Koziel J, Cai L, Hoff SJ, Harmon J, Mickelson J, Heber AJ. National Air Emissions Monitoring Study: Emissions Data from Two Sow Barns and One Swine Farrowing Room in Iowa- Site IA4B. Purdue University; West Lafayette, IN: 2010. Jul 26, Final Report. [Google Scholar]
- Donham KJ, Popendorf W, Palmgren U, Larsson L. Characterization of dusts collected from swine confinement buildings, Am. J Ind Med. 1986;10:294–297. doi: 10.1002/ajim.4700100318. [DOI] [PubMed] [Google Scholar]
- Donham KJ. Production rates of toxic gases from liquid swine manure health implications for workers and animals in swine confinement buildings. Biol Waste. 1988;24:161–173. [Google Scholar]
- Donham K, Haglind P, Peterson Y, Rylander R, Belin L. Environmental and health studies of farm workers in Swedish swine confinement buildings. Brit J Ind Med. 1989;46:31–37. doi: 10.1136/oem.46.1.31. [DOI] [PMC free article] [PubMed] [Google Scholar]
- Donham KJ. Association of environmental air contaminants with disease and productivity in siwne. Am J Vet Res. 1991;52:1723–1730. [PubMed] [Google Scholar]
- Donham KJ, Reynolds SJ, Whitten P, Merchant JA, Burmeister L, Popendorf WJ. Respiratory dysfunction in swine production facility workers Dose-response relationships of environmental exposures and pulmonary-function. Am J Ind Med. 1995;27:405–418. doi: 10.1002/ajim.4700270309. [DOI] [PubMed] [Google Scholar]
- Donham KJ, Cumro D, Reynolds S. Synergistic effects of dust and ammonia on the occupational health effects of poultry production workers. J Agromedicine. 2002;8:57–76. doi: 10.1300/J096v08n02_09. [DOI] [PubMed] [Google Scholar]
- Diekman MA, Scheidt AB, Sutton AL, Green ML, Clapper JA, Kelly DT, Van Alstine WG. Growth and reproductive performance, during exposure to ammonia, of gilts afflicted with pneumonia and atrophic rhinitis. Am J Vet Res. 1993;54:2128–2131. [PubMed] [Google Scholar]
- Drummod JG, Curtis SE, Simon J, Norton HW. Effects of aerial ammonia on growth and health of young pigs. J Anim Sci. 1980;50:1085–1091. [Google Scholar]
- EPA. Emission factor documentation for AP-42. Compilation of air pollutant emission factors. Volume 1: Stationary point and area sources. Chapter 1: External combustion sources. 1998 1.4 Natural gas combustion. http://www.epa.gov/ttn/chief/ap42/ch01/final/c01s04.pdf.
- Hong PY, Li X, Yang X, Shinkai T, Zhang Y, Wang X, Mackie RI. Monitoring airborne biotic contaminants in the indoor environment of pig and poultry confinement buildings. Environ Microbiol. 2012;14:1420–1431. doi: 10.1111/j.1462-2920.2012.02726.x. [DOI] [PubMed] [Google Scholar]
- Iversen M, Kirychuk S, Drost H, Jacobson L. Human health effects of dust exposure in animal confinement buildings. J Agric Saf Health. 2000;6:283– 288. doi: 10.13031/2013.1911. [DOI] [PubMed] [Google Scholar]
- Kirkhorn SR, Garry VF. Agricultural lung diseases. Environ Health Perspect. 2000;108:705–712. doi: 10.1289/ehp.00108s4705. [DOI] [PMC free article] [PubMed] [Google Scholar]
- Larsson KA, Eklund AG, Hansson LO, Isaksson BM, Malmberg PO. Swine dust causes intense airways inflammation in healthy subjects, Am. J Respir Crit Care Med. 1994;150:973–977. doi: 10.1164/ajrccm.150.4.7921472. [DOI] [PubMed] [Google Scholar]
- Maghirang RG, Puma MC, Liu Y, Clark P. Dust concentrations and particle size distribution in an enclosed swine nursery. Am Soc Agric Engs. 1997;40:749–754. [Google Scholar]
- Ni JQ, Hendriks J, Coenegrachts J, Vinckier C. Production of carbon dioxide in a fattening pig house under field conditions. I Exhalation by pigs Atmos Environ. 1999;33:3691–3696. [Google Scholar]
- Ni JQ, Vinckier C, Hendriks J, Coenegrachts J. Production of carbon dioxide in a fattening pig house under field conditions. II Release from the manure Atmos Environ. 1999;33:3697–3703. [Google Scholar]
- O'Shaughnessy PT, Donham KJ, Peters TM, Taylor C, Altmaier R, Kelly KM. A task-specific assessment of swine worker exposure to airborne dust. J Occup Environ Hyg. 2010;7:7–13. doi: 10.1080/15459620903327970. [DOI] [PMC free article] [PubMed] [Google Scholar]
- Pearson CC, Sharples TJ. Airborne dust concentrations in livestock buildings and the effect of feed. J Agric Engng Res. 1995;60:145–154. [Google Scholar]
- Pedersen S, Takai H, Johnsen JO, Metz JHM, Groot Koerkamp PWG, Uenk GH, Phillips VR, Holden MR, Sneath RW, Short JL, White RP, Hartung J, Seedorf J, Schröder M, Linkert KHH, Wathes CM. A comparison of three balance methods for calculating ventilation rates in livestock buildings. J Agric Engng Res. 1998;70:25–37. [Google Scholar]
- Pedersen S, Nonnenmann M, Rautiainen R, Demmers TG, Banhazi T, Lyngbye M. Dust in pig buildings. J Agric Saf Health. 2000;6:261–274. doi: 10.13031/2013.1909. [DOI] [PubMed] [Google Scholar]
- Peters TM, Anthony TR, Taylor C, Altmaier R, Anderson K, O'Shaughnessy PT. Distribution of particle and gas concentrations in Swine gestation confined animal feeding operations. Ann Occup Hyg. 2012;56:1080–1090. doi: 10.1093/annhyg/mes050. [DOI] [PMC free article] [PubMed] [Google Scholar]
- Reeve KA, Peters TM, Anthony TR. Wintertime factors affecting contaminant distribution in a swine farrowing room. J Occup Environ Hyg. 2013 doi: 10.1080/15459624.2013.777303. In press. [DOI] [PMC free article] [PubMed] [Google Scholar]
- Reynolds SJ, Donham KJ, Stookesberry J, Thorne PS, Subramanian P, Thu K, Witten P. Air quality assessments in the vicinity of swine production facilities. J Agromedicine. 4:37–45. doi: 10.1300/J096v11n03_03. [DOI] [PubMed] [Google Scholar]
- Takai H, Pedersen S, Johnsen JO, Metz JHM, Groot Koerkamp PWG, Uenk GH, Phillips VR, Holden MR, Sneath RW, Short JL, White RP, Hartung J, Seedorf J, Schröder M, Linkert KH, Wathes CM. Concentrations and emissions of airborne dust in livestock buildings in Northern Europe. J Agric Engng Res. 1998;70:59–77. [Google Scholar]
- Schauberger G, Piringer M, Petz E. Dynamic model of the indoor climate inside livestock buildings. Swine housing; Proceedings of the First International Conference; Des Moines, Iowa. 2000a. [Google Scholar]
- Schauberger G, Piringer M, Petz E. Steady-state balance model to calculate the indoorclimate of livestock buildings, demonstrated for finishing pigs. Int J Biometeorol. 2000b;43:154–162. doi: 10.1007/s004840050002. [DOI] [PubMed] [Google Scholar]
- Soldatos AG, Arvanitis KG, Daskalov PI, Pasgianos GD, Sigrimis NA. Nonlinear robust temperature-humidity control in livestock buildings. Comput Eelctron Agr. 2005;49:357–376. [Google Scholar]
- Stombaugh DP, Teague HS, Roller WL. Effects of Atmospheric ammonia on the pig. J Anim Sci. 1969;28:844–847. doi: 10.2527/jas1969.286844x. [DOI] [PubMed] [Google Scholar]
- Zhang Y, Barber EM. Variable ventilation rate control below the heat-deficit temperature in cold-climate livestock buildings. Am Soc Agric Engs. 1993;36:1473–1482. [Google Scholar]
Associated Data
This section collects any data citations, data availability statements, or supplementary materials included in this article.