Given our results linking myeloperoxidase (MPO) to epileptogenesis and the highly sensitive ability to image its increased activity, MPO may provide a complementary imaging approach in patients with refractory or cryptogenic epilepsy, in whom conventional imaging fails to demonstrate an abnormality.
Abstract
Purpose
To determine if myeloperoxidase (MPO) is involved in epileptogenesis and if molecular nuclear imaging can be used to noninvasively map inflammatory changes in epileptogenesis.
Materials and Methods
The animal and human studies were approved by the institutional review boards. Pilocarpine-induced epileptic mice were treated with 4-aminobenzoic acid hydrazide (n = 46), a specific irreversible MPO inhibitor, or saline (n = 42). Indium-111-bis-5-hydroxytryptamide-diethylenetriaminepentaacetate was used to image brain MPO activity (n = 6 in the 4-aminobenzoic acid hydrazide and saline groups; n = 5 in the sham group) by using single photon emission computed tomography/computed tomography. The role of MPO in the development of spontaneous recurrent seizures was assessed by means of clinical symptoms and biochemical and histopathologic data. Human brain specimens from a patient with epilepsy and a patient without epilepsy were stained for MPO. The Student t test, one-way analysis of variance, and Mann-Whitney and Kruskal-Wallis tests were used. Differences were regarded as significant if P was less than .05.
Results
MPO and leukocytes increased in the brain during epileptogenesis (P < .05). Blocking MPO delayed spontaneous recurrent seizures (99.6 vs 142 hours, P = .016), ameliorated the severity of spontaneous recurrent seizures (P < .05), and inhibited mossy fiber sprouting (Timm index, 0.31 vs 0.03; P = .003). Matrix metalloproteinase activity was upregulated during epileptogenesis in an MPO-dependent manner (1.44 vs 0.94 U/mg, P = .049), suggesting that MPO acts upstream of matrix metalloproteinases. MPO activity was mapped during epileptogenesis in vivo in the hippocampal regions. Resected temporal lobe tissue from a human patient with refractory epilepsy but not the temporal lobe tissue from a patient without seizures demonstrated positive MPO immunostaining, suggesting high translational potential for this imaging technology.
Conclusion
The findings of this study highlight an important role for MPO in epileptogenesis and show MPO to be a potential therapeutic target and imaging biomarker for epilepsy.
© RSNA, 2015
Introduction
Epilepsy is a common neurological disorder that affects 50 million people worldwide. Treatment is aimed at preventing recurrent seizures by using blockers of neuronal excitability, but more than one-third of affected individuals are refractory to such interventions (1). Epilepsy can be acquired through genetic mutations in receptors, channels, and neurotransmitters that regulate neuronal excitability but can also occur after an insult to the brain, including status epilepticus (SE), trauma, infection, and cancer (2).
The mechanisms underlying epileptogenesis are largely undefined, but increasing evidence points to the role of inflammation (3). Gene array profiling shows upregulation of genes associated with immune response during epileptogenesis (4). Leukocytes appear to be important during epileptogenesis, since depletion of neutrophils inhibits both seizure induction and epilepsy development in animal models (5).
Myeloperoxidase (MPO) is a potent inflammatory mediator found in leukocytes (6). MPO generates oxidizing species such as hypochlorite. MPO can inactivate inhibitors of matrix metalloproteinases (MMP) (7) and activate MMP (8) to break down the blood-brain barrier (BBB), and BBB leakage is implicated in seizure induction and progression (9). The brain is particularly susceptible to oxidative stress, since it contains large quantities of oxidizable lipids and metals and has fewer antioxidant mechanisms than other tissues (10). During epileptogenesis, there is a marked increase in oxidative stress (11,12). Moreover, increased levels of hydrogen peroxide, a critical substrate for MPO, are found in mice brains during epileptogenesis (10).
To investigate the relationship between MPO and seizures, we used the pilocarpine model of epileptogenesis. This animal model has been used extensively to study the pathogenesis of epilepsy and recapitulates the clinical hallmarks of temporal lobe epilepsy, the most common type of complex seizure in adulthood (13), including the formation of epileptogenic foci in the limbic system, an initial precipitating injury, the “latent period” between precipitating injury and development of seizure activity, and the presence of hippocampal sclerosis that leads to reorganization of neuronal networks (14). We aimed to determine if MPO is involved in epileptogenesis and if molecular nuclear imaging that targets MPO could noninvasively demonstrate the inflammatory changes in epileptogenesis.
Materials and Methods
Seizure Induction
The protocol for animal experiments was approved by the institutional animal care committee. This study was performed from August 1, 2009, to July 30, 2013, and 274 mice were used for experiments (study flowchart shown in Fig E1 [online]). Male C57BL/6NCrl mice (n = 241; Charles River Laboratory, barrier K96, Wilmington, Mass), male C57BL/6 J mice (n = 10; Jackson Laboratory, Bar Harbor, Maine), female SJL mice (n = 10; National Cancer Institute, Frederick, Md), and MPO-knockout mice (n = 13; Jackson Laboratory) were used. All mice were 5–8 weeks old at the time of the experiments. To induce seizure, we pretreated mice with methylscopolamine (1 mg per kilogram of body weight, intraperitoneal administration). Thirty minutes later, we administered 350 mg of pilocarpine per kilogram of body weight in 0.01-mol/L phosphate-buffered saline with a pH level of 7.4 (n = 206). We evaluated seizures during SE according to a modified Racine scale (15). A mouse with a minimum of three category 3–5 seizures within 2 hours was considered to have undergone SE. Two hours after SE conversion, mice were injected with diazepam (3 mg per kilogram of body weight, intraperitoneal administration) to achieve uniform SE duration. After a latent phase of a few weeks, the mice developed spontaneous recurrent seizures (SRS). Mice were monitored for at least 1 hour daily during and after SE induction (30 minutes in the morning and 30 minutes in the afternoon) by two independent observers (Y.Z. and W.A., each with 2 years of experience) who were blinded to the treatment status. We also evaluated jerky motion, defined as motor activity along the horizontal direction, which corresponded to the rapid motion during myoclonic seizures (16). Sham mice (n = 28) were induced with the same procedure as that described earlier, except pilocarpine was not administered.
Therapeutic Intervention
For treatment trials, we injected the specific irreversible MPO inhibitor 4-aminobenzoic acid hydrazide (ABAH, 40 mg per kilogram of body weight, intraperitoneal administration) (17) twice daily (n = 46) or injected the same volume of saline as that used in control mice (n = 42). The first dose of ABAH was administered at least 2 hours after SE conversion (after diazepam administration) to ensure that the initial insult from SE was the same in both groups. The remaining C57BL/6 mice (n = 118) received no treatment and were used for biochemical and histopathologic studies.
SPECT/CT and Autoradiography
Seventeen mice were used for single photon emission computed tomography (SPECT)/computed tomography (CT) (six ABAH-treated SE mice, six saline-treated control SE mice, and five sham mice). The MPO-sensing activatable imaging agent indium-111-bis-5-hydroxytryptamide-diethylenetriaminepentaacetate was used (18). In the presence of MPO, the agent is oligomerized and binds to proteins, causing retention of the activated agents at sites of increased MPO activity (19). Ten minutes prior to radiotracer injection, 250 μL of 25% mannitol was administered to transiently open up the BBB for sham mice (20). A removable bed with fiducial markers (two lengths of PE10 tubing filled with approximately 100 µCi of the MPO-sensing agent) was interchanged between CT (Inveon; Siemens, Norwood, Mass) and SPECT (X-SPECT; Gamma Medica Ideas, Northridge, Calif) systems. SPECT images were acquired by using a dual-headed gamma camera with 1-mm medium energy pinhole collimators 3 hours after injection over 128 projections at 60 seconds per projection over a radius of 4 cm for 1 hour. The images were reconstructed by using an ordered-subsets expectation maximization algorithm with four subsets and 10 iterations into a 256 × 256 × 256 matrix with isotropic voxels of 140.6 µm. The cone-beam CT images were acquired over 360 projections by using a 500-mA 80-kVp x-ray tube on a flat-panel detector over 10 minutes. The images were reconstructed by using a modified Feldkamp cone-beam reconstruction algorithm (COBRA; Exxim, Pleasanton, Calif) into a 512 × 512 × 768 matrix with 110-µm isotropic voxels. The reconstructed images were registered by using a normalized mutual information algorithm in Amira (version 5.4.3; FEI, Hillsboro, Ore). Spherical regions of interest were drawn around the hippocampus and muscle by two reviewers (G.R.W. and J.W.C., each with more than 10 years of experience; sample regions of interest are shown in Fig E2 [online]) who were blinded to the treatment status. A ratio between the hippocampal regions of interest and the muscle regions of interest was computed.
For ex vivo autoradiography, 1-mm sections were placed on a phosphorimager plate for 18 hours and counted by using a Typhoon 9410 imager (GE, Piscataway, NJ). Analysis was performed with background subtraction (air) by two blinded reviewers (G.R.W. and J.W.C.). Counts were decay corrected to the time after animal sacrifice and normalized according to injected dose.
Biochemical and Histopathologic Experiments
Please see Appendix E1 (online) for additional details on the following experiments.
Flow cytometry.—Excised brain specimens were evaluated for neutrophils; monocytes, macrophages, and/or microglia; and lymphocytes.
Peroxidase activity assays and MPO enzyme-linked immunosorbent assay.—Peroxidase activity assays were performed by using 10-acetyl-3,7-dihydroxyphenoxazine (AAT Bioquest, Sunnyvale, Calif) at an excitation wavelength of 535 nm and an emission wavelength of 590 nm.
Western blot.—Proteins extracted from each brain were evaluated for MPO and 3-chlorotyrosine.
Timm staining.—An FD Rapid TimmStain Kit (NDT106; NeuroDigiTech, San Diego, Calif) was used.
MPO Immunostaining in a Patient with Temporal Lobe Epilepsy
The protocol was approved by the institutional review board. MPO immunostaining was performed in the left temporal lobe of a patient with epilepsy and a control patient with an intraventricular meningioma. The patient with seizures was a 25-year-old woman with paroxysmal loss of consciousness and limb twitching for a duration of 13 years, and the patient was refractory to medical therapy. The control patient had no history of seizures. Paraffin-embedded 5-μm-thick sections were incubated with a rabbit polyclonal anti-myeloperoxidase antibody (ab45977; Abcam, Cambridge, Mass). Hematoxylin-eosin staining was also performed on adjacent sections.
Statistical Analysis
We performed statistical analysis with GraphPad Prism 5.0 (GraphPad, La Jolla, Calif). Results were expressed as means ± standard errors of measurement. Sample size was estimated before the initiation of the study on the basis of our prior experience with ABAH, which showed about a 40% decrease in MPO-mediated uptake with about 20% standard deviation (21). For 90% power, the minimum sample size was found to be three. The nonparametric two-tailed Mann-Whitney and Kruskal-Wallis tests, followed by the Dunn multiple comparisons test, were used except for as follows: The Fisher exact test was used to compare the SRS incidence; repeated-measures one-way analysis of variance was performed for SRS severity measures (SRS and jerky motion frequency and duration); the log-rank test was used for survival analysis. For SRS onset, only data from mice that had confirmed SRS were included. Differences were regarded as significant if they had a P value less than .05.
Results
MPO Activity after Pilocarpine-induced SE
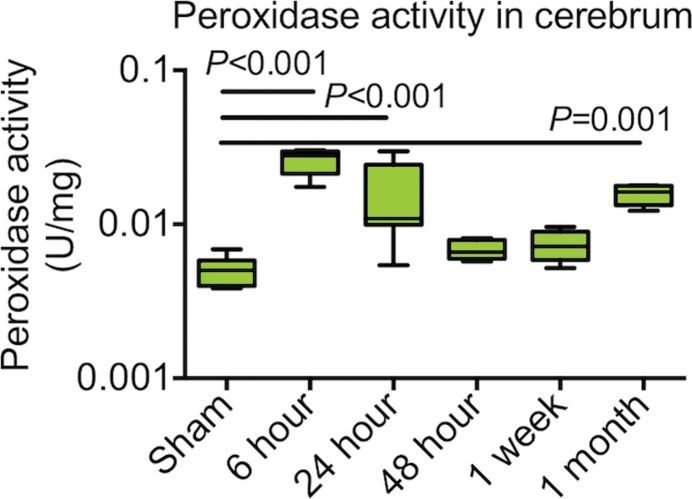
In animals with seizure, brain (cerebrum) peroxidase activity was maximally increased 6 hours after SE conversion when compared with sham-induced animals (P < .001, n = 6 per group, Fig 1a). Brain peroxidase activity decreased but remained significantly increased compared with that of sham-induced animals 24 hours after SE conversion (P < .01). By 48 hours after SE, brain peroxidase activity returned to levels of activity similar to those of sham animals. Plasma peroxidase activity was similarly maximally increased 6 hours after SE compared with that of sham animals (P < .0001; n = 6 per group; Fig E3a [online]) but returned to sham levels 24 hours after induction. One month after induction, a time point during which SRS was observed, peroxidase activity in the brain was again increased (P < .01, Fig 1a). There was also increased MPO protein 6 hours after SE (Fig E3b [online]). After 48 hours, MPO protein levels declined, mirroring the time course of enzymatic activity (Fig 1a, Fig E3b [online]). Brains perfused with heparinized saline 6 hours after SE induction to wash out possible endothelium-bound MPO (22) showed no change in peroxidase activity compared with brains without heparin treatment (Fig E4 [online]), suggesting that MPO secreted during epileptogenesis was predominantly parenchymal.
Figure 1a:
Plots of MPO and leukocytes in epileptogenesis. (a) Peroxidase activity after SE in cerebrum (n = 6 per group; data were obtained by using one-way analysis of variance, followed by the Bonferroni multiple-comparisons test in which the values from each day are compared with those of shams). (b) Microglia activation and numbers of lymphocytes and neutrophils were increased in mice with seizures (n = 6 per group; the Kruskal-Wallis test was used, followed by the Dunn multiple-comparisons test, as compared with sham values). All data are means ± standard errors of measurement. MFI = mean fluorescence intensity.
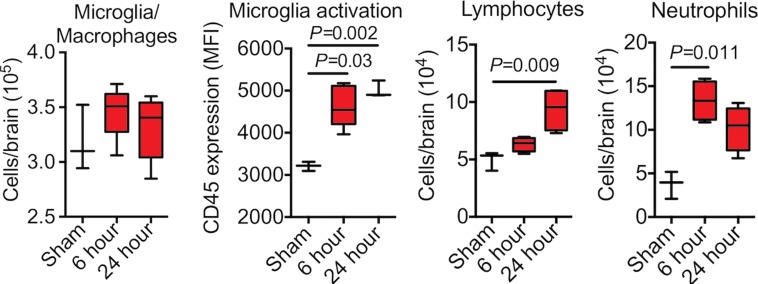
Microglia activation, but not the number of microglia and/or macrophages in the brain, increased after SE (Fig E3c [online]). Lymphocytes increased in number in the brain after SE ([4.9 ± 0.5] × 104 in sham mice and [9.4 ± 0.9] × 104 in the other groups 24 hours after SE; P = .009; n = 6 per group; Fig 1b). Neutrophils increased the most (threefold) in the brain after SE, with an early peak 6 hours after SE ([13.4 ± 1.1] × 104 vs [3.7 ± 0.9] × 104; P = .011; Fig1b), paralleling the time course of MPO protein and enzymatic activity during epileptogenesis, suggesting that neutrophils may be the dominant source of MPO (Fig 2).
Figure 1b:
Plots of MPO and leukocytes in epileptogenesis. (a) Peroxidase activity after SE in cerebrum (n = 6 per group; data were obtained by using one-way analysis of variance, followed by the Bonferroni multiple-comparisons test in which the values from each day are compared with those of shams). (b) Microglia activation and numbers of lymphocytes and neutrophils were increased in mice with seizures (n = 6 per group; the Kruskal-Wallis test was used, followed by the Dunn multiple-comparisons test, as compared with sham values). All data are means ± standard errors of measurement. MFI = mean fluorescence intensity.
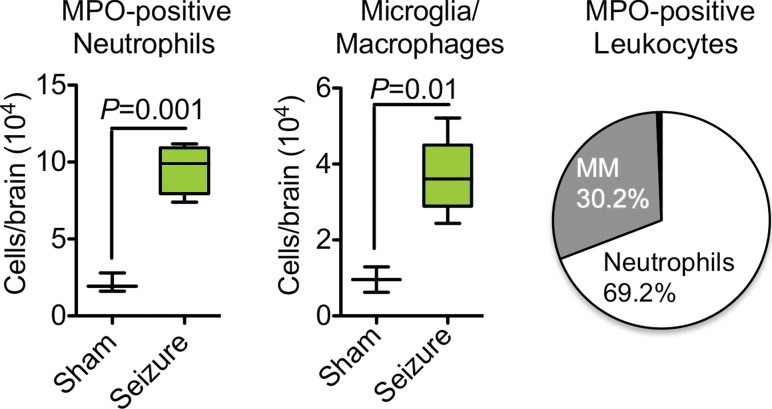
Figure 2a:
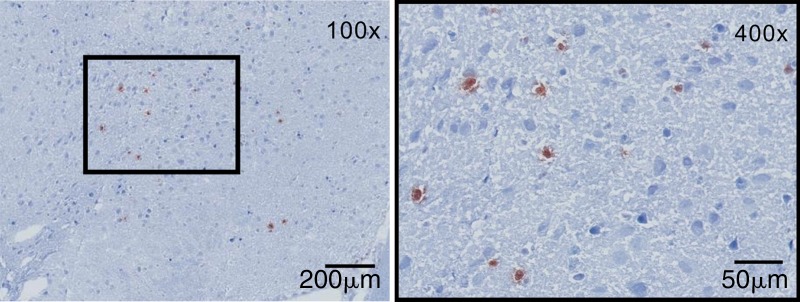
Sources of brain MPO. (a) Plots (left) and graph (right) show quantification of MPO-positive cells (n = 6 per group; the Mann-Whitney test was used). All data in the plots are means ± standard errors of measurement. (b) Photomicrographs (Timm stain; original magnification, ×100 [left] and ×400 [right]) show that MPO-positive cells were mainly found in the hippocampal and parahippocampal regions. MM = macrophages and microglia.
Blocking MPO activity with ABAH reduced brain peroxidase activity by approximately 40% (0.014 vs 0.009, P = .016; n = 6 per group; Fig3a). Induction of neuroinflammation in both wild-type and MPO-deficient, or MPO−/−, mice yielded increased peroxidase activity in wild-type mice but only baseline control levels in MPO−/− mice (peroxidase activity, 0.23 U/mg ± 0.06 vs 0.06 U/mg ± 0.02, P = .045; n = 7 for wild-type experimental autoimmune encephalomyelitis; n = 3 for knockout experimental autoimmune encephalomyelitis; n = 3 for sham; Fig E5 [online]). Twenty-four hours after SE (to allow time for product accumulation), we detected accumulation of 3-chlorotyrosine (an MPO-specific product) in the brain, and this was attenuated with ABAH (P = .016; n = 4 for saline, n = 5 for ABAH; Fig E6a, E6b [online]).
Figure 3a:
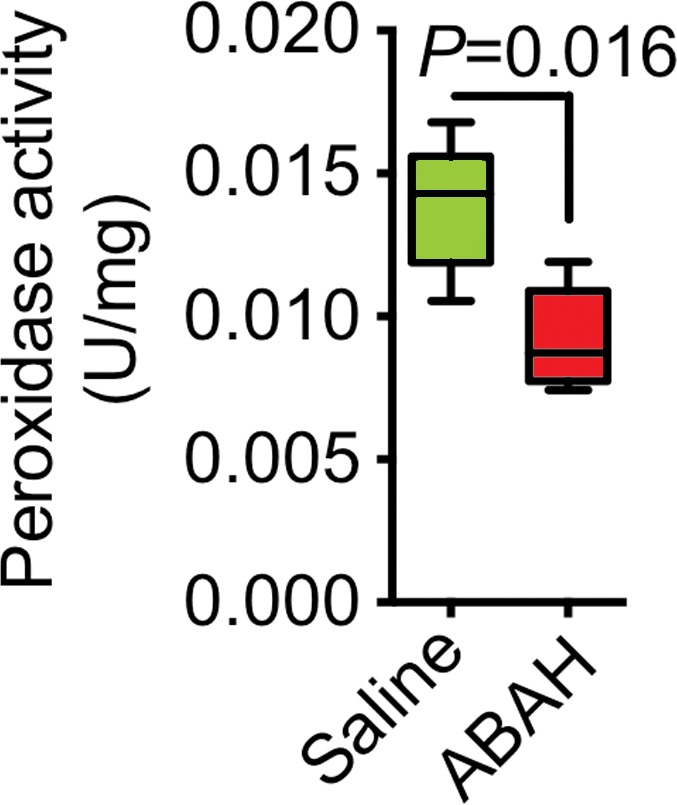
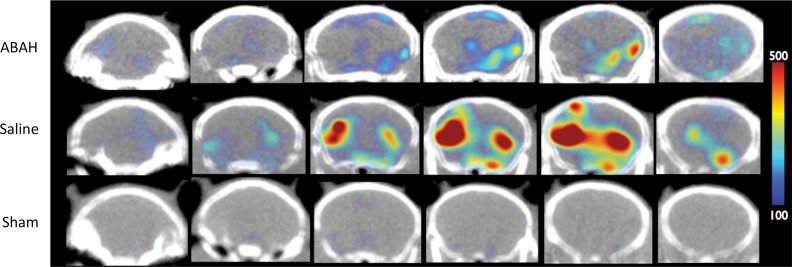
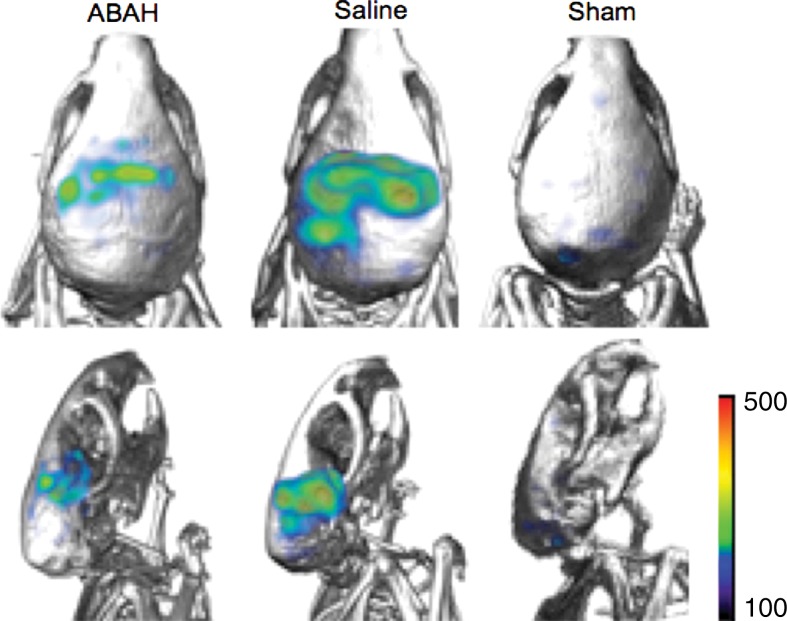
MPO activity and its product decreased with MPO inhibition ex vivo and in vivo. (a) Plot shows that peroxidase activity decreased with MPO inhibition 6 hours after SE (n = 6 per group; P = .02, according to results of the Student t test). (b) Representative SPECT/CT images show that in vivo MPO activity increased after SE and was partially blocked with MPO inhibition. (c) Three-dimensional representations of MPO activity in the entire mouse brains are shown for the same groups as those in in b. (d) Plot shows the quantification of imaging findings (according to the Kruskal-Wallis test, followed by the Dunn multiple-comparisons test). All data in plots are means ± standard errors of measurement.
In Vivo and ex Vivo Imaging of MPO Enzyme Activity during Epileptogenesis
We observed increased in vivo uptake of the MPO-sensing radiotracer in the hippocampal regions in the mice with seizures but not in other regions or in sham mice that were given mannitol to open up the BBB (radiotracer uptake, 0.78 ± 0.1 vs 0.18 ± 0.03, P < .001; n = 6 each for saline and ABAH groups and n = 5 for the sham group; Fig 3b, 3c). Treating mice that had seizures with ABAH resulted in diminished radiotracer uptake relative to animals with seizures that were given saline (radiotracer uptake, 0.78 ± 0.1 vs 0.60 ± 0.04, P = .03; Fig 3d). At autoradiography, ABAH treatment showed decreased uptake compared with saline treatment (radiotracer uptake, 22.6 ± 1.0 vs 15.0 ± 1.6, P = .02; Fig E6c [online]). These results indicate that MPO activity is upregulated and can be tracked noninvasively in the brain during epileptogenesis.
Figure 3b:
MPO activity and its product decreased with MPO inhibition ex vivo and in vivo. (a) Plot shows that peroxidase activity decreased with MPO inhibition 6 hours after SE (n = 6 per group; P = .02, according to results of the Student t test). (b) Representative SPECT/CT images show that in vivo MPO activity increased after SE and was partially blocked with MPO inhibition. (c) Three-dimensional representations of MPO activity in the entire mouse brains are shown for the same groups as those in in b. (d) Plot shows the quantification of imaging findings (according to the Kruskal-Wallis test, followed by the Dunn multiple-comparisons test). All data in plots are means ± standard errors of measurement.
Figure 3c:
MPO activity and its product decreased with MPO inhibition ex vivo and in vivo. (a) Plot shows that peroxidase activity decreased with MPO inhibition 6 hours after SE (n = 6 per group; P = .02, according to results of the Student t test). (b) Representative SPECT/CT images show that in vivo MPO activity increased after SE and was partially blocked with MPO inhibition. (c) Three-dimensional representations of MPO activity in the entire mouse brains are shown for the same groups as those in in b. (d) Plot shows the quantification of imaging findings (according to the Kruskal-Wallis test, followed by the Dunn multiple-comparisons test). All data in plots are means ± standard errors of measurement.
Figure 3d:
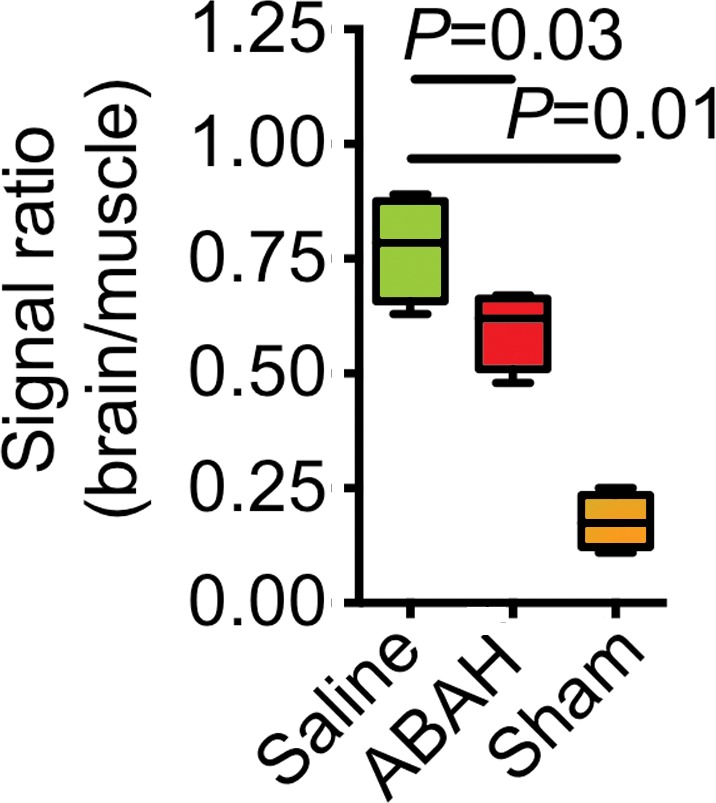
MPO activity and its product decreased with MPO inhibition ex vivo and in vivo. (a) Plot shows that peroxidase activity decreased with MPO inhibition 6 hours after SE (n = 6 per group; P = .02, according to results of the Student t test). (b) Representative SPECT/CT images show that in vivo MPO activity increased after SE and was partially blocked with MPO inhibition. (c) Three-dimensional representations of MPO activity in the entire mouse brains are shown for the same groups as those in in b. (d) Plot shows the quantification of imaging findings (according to the Kruskal-Wallis test, followed by the Dunn multiple-comparisons test). All data in plots are means ± standard errors of measurement.
Source of MPO and Role of MPO in MMP Activity and Mossy Fiber Sprouting during Epileptogenesis
We found that neutrophils were responsible for most MPO in the brain (approximately 70%), with the remaining MPO contributed by microglia and/or macrophages (approximately 30%) (Fig E7a [online], Fig 2a; n = 6 per group). MPO-positive cells were predominantly found in the hippocampal and parahippocampal regions, which corroborates imaging findings (Fig 2b). Immunofluorescence imaging further confirmed that most MPO-positive cells were neutrophils (Ly-6G+; Fig E7b [online]), while a smaller number of MPO-positive cells were microglia and/or macrophages (CD68+; Fig E7b [online]). MPO did not co-localize with CD31 (an endothelial cell marker), which is consistent with the parenchymal location of MPO (Fig E7b [online]).
Figure 2b:
Sources of brain MPO. (a) Plots (left) and graph (right) show quantification of MPO-positive cells (n = 6 per group; the Mann-Whitney test was used). All data in the plots are means ± standard errors of measurement. (b) Photomicrographs (Timm stain; original magnification, ×100 [left] and ×400 [right]) show that MPO-positive cells were mainly found in the hippocampal and parahippocampal regions. MM = macrophages and microglia.
In ABAH-treated SE animals, there was reduced brain MMP activity (1.44 relative fluorescence units per second ± 0.2) compared with that in saline-treated control animals (0.9 relative fluorescence units per second ± 0.2) (P = .049; n = 5 per group; Fig E8a [online]). Adding purified MPO to brain extracts from SE mice further increased MMP activity over control animals that were given saline (3.3 relative fluorescence units per second ± 0.3 vs 1.1 relative fluorescence units per second ± 0.2, P < .0001; n = 10 per group; Fig E8b [online]). Wild-type animals without prior treatment that were injected with MPO intrathecally showed increased MMP activity compared with that in control animals that received saline (0.03 U/mg ± 0.0 vs 0.01 U/mg ± 0.0, P = .016; n = 5 per group; Fig E8c [online]).
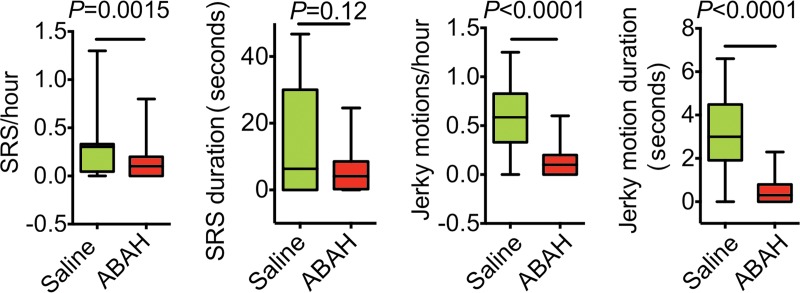
The weight of ABAH-treated SE animals and saline-treated control animals during the first 30 days after SE was not significantly different (Fig E9a [online]; n = 15 for the saline group and n = 18 for the ABAH group in Fig E9a [online]). The SRS incidence was 100% in the saline-treated group and 78% in the ABAH-treated group, although this did not reach statistical significance (P = 0.11, Fig E9b [online]). Blocking MPO activity led to a delay in SRS onset compared with control animals that received saline (142 hours ± 10 vs 100 hours ± 11, P = .016; Fig E9c [online]). There was decreased frequency of both SRS (0.31 SRS per hour ± 0.05 vs 0.12 SRS per hour ± 0.03, P = .0015) and jerky motion (0.59 jerky motions per hour ± 0.05 vs 0.12 jerky motions per hour ± 0.02, P < .0001) in the ABAH-treated group compared with the control group (Fig 4). The SRS duration was shorter in ABAH-treated mice (5.6 seconds ± 1.6) than in saline-treated mice (14.1 seconds ± 4.1) (P = .12, Fig 4). The mean jerky motion duration decreased in the ABAH group (3.2 seconds ± 0.3 vs 0.51 seconds ± 0.11, P < .0001; Fig 4). More mice died in the saline group than in the ABAH group, but this did not reach statistical significance (P = .19, Fig E9d [online]).
Figure 4:
Plots show a reduction in recurrent seizure activity with MPO inhibition. There is decreased frequency and duration of both SRS and jerky motion over 60 days in the ABAH-treated group (according to repeated-measures one-way analysis of variance).
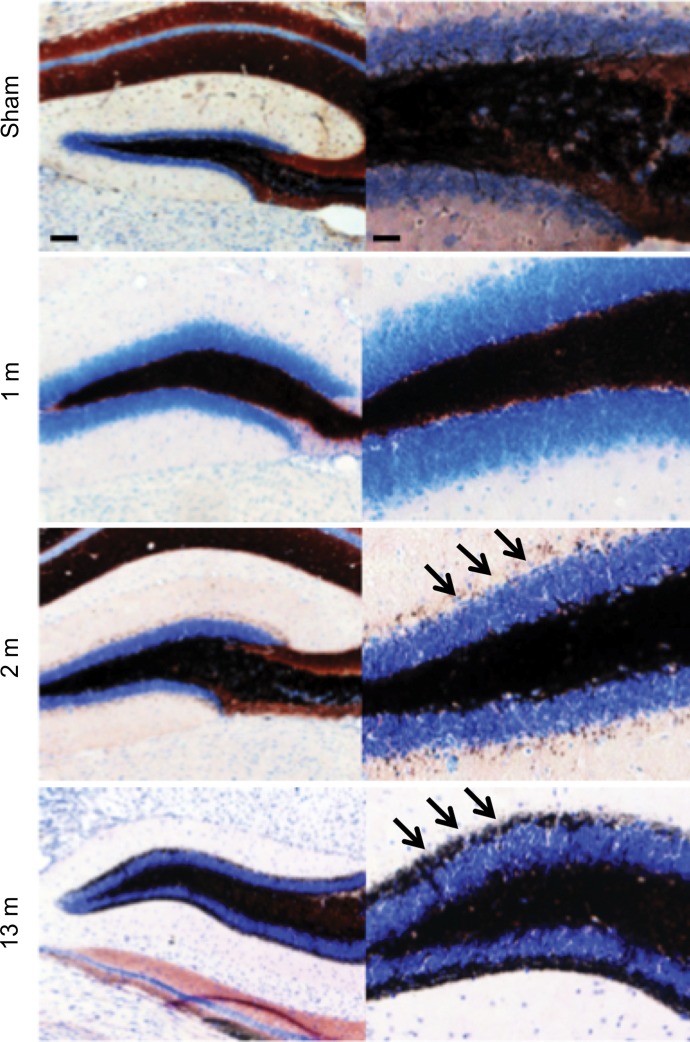
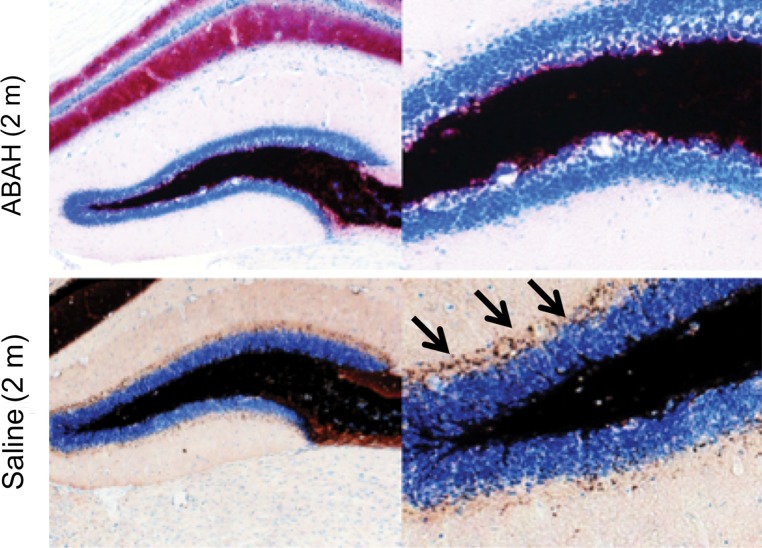
We observed mossy fiber sprouting beginning 2 months after SE, and this became more pronounced over time (Fig 5a). Compared with saline-treated mice (Timm index, 0.31 ± 0.07), ABAH-treated mice showed nearly undetectable mossy fiber sprouting (Timm index, 0.03 ± 0.01) 2 months after SE (Fig 5b, 5c; P = .003; n = 3 in each group), indicating that MPO activity promotes mossy fiber sprouting during epileptogenesis.
Figure 5a:
Mossy fiber sprouting at different time points after SE conversion and MPO in epileptic human brain. (a) Photomicrographs ( Timm stain; images on the left, scale bar = 250 μm [original magnification, ×40]; and images on the right, 25 μm [original magnification, ×400]) show that mossy fiber sprouting was detected 2 months after SE conversion in animals induced with pilocarpine (arrows); this further increased 13 months after SE (arrows). (b) Photomicrographs ( Timm stain; images on the left, original magnification of ×40; images on the right, original magnification of ×400) show that when compared with saline-treated control mice, ABAH-treated mice have nearly undetectable mossy fiber sprouting 2 months after SE. (c) Plot derived from quantitative analysis shows a marked decrease in mossy fiber sprouting 2 months after ABAH administration (n = 6 per group; P = .003, according to results of the Mann-Whitney test). Data are means ± standard errors of measurement.
Figure 5b:
Mossy fiber sprouting at different time points after SE conversion and MPO in epileptic human brain. (a) Photomicrographs ( Timm stain; images on the left, scale bar = 250 μm [original magnification, ×40]; and images on the right, 25 μm [original magnification, ×400]) show that mossy fiber sprouting was detected 2 months after SE conversion in animals induced with pilocarpine (arrows); this further increased 13 months after SE (arrows). (b) Photomicrographs ( Timm stain; images on the left, original magnification of ×40; images on the right, original magnification of ×400) show that when compared with saline-treated control mice, ABAH-treated mice have nearly undetectable mossy fiber sprouting 2 months after SE. (c) Plot derived from quantitative analysis shows a marked decrease in mossy fiber sprouting 2 months after ABAH administration (n = 6 per group; P = .003, according to results of the Mann-Whitney test). Data are means ± standard errors of measurement.
Figure 5c:
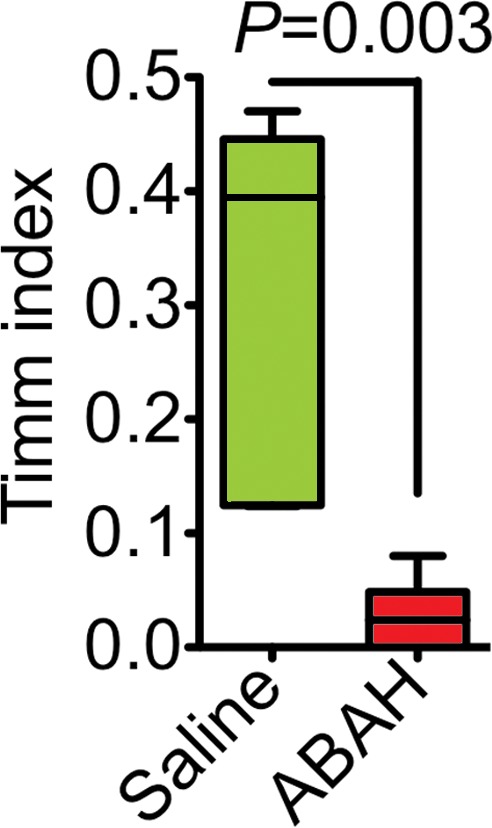
Mossy fiber sprouting at different time points after SE conversion and MPO in epileptic human brain. (a) Photomicrographs ( Timm stain; images on the left, scale bar = 250 μm [original magnification, ×40]; and images on the right, 25 μm [original magnification, ×400]) show that mossy fiber sprouting was detected 2 months after SE conversion in animals induced with pilocarpine (arrows); this further increased 13 months after SE (arrows). (b) Photomicrographs ( Timm stain; images on the left, original magnification of ×40; images on the right, original magnification of ×400) show that when compared with saline-treated control mice, ABAH-treated mice have nearly undetectable mossy fiber sprouting 2 months after SE. (c) Plot derived from quantitative analysis shows a marked decrease in mossy fiber sprouting 2 months after ABAH administration (n = 6 per group; P = .003, according to results of the Mann-Whitney test). Data are means ± standard errors of measurement.
SE Induction in MPO-deficient Mice and Presence of MPO in a Human Patient with Refractory Seizures
Similar to the difficulties seen in C57BL/6 J mice in a previous report (23), we observed an extremely low SE conversion rate and a high mortality in both MPO−/− mice (70% mortality) and C57BL/6 J control mice (40% mortality) (Fig E10 [online]). However, we observed 100% conversion to SE with absence of mortality in the C57BL/6NCrl mice (0% mortality) (Fig E10 [online]). Even though SE conversion was just as poor in MPO−/− mice as in C57BL/6 J mice, MPO−/− mice had a higher number of acute seizures (1.8 ± 0.3) when compared with C57BL/6 J mice (0.4 ± 0.2, P = .014; n = 10 per group).
In the left temporal lobe of a 25-year-old patient who had undergone partial temporal lobe resection for refractory epilepsy, there was positive MPO immunostaining throughout the resected temporal lobe (Fig E11b–E11d [online]). No MPO was detected in the temporal lobe from a nonepileptic control patient (Fig E11a [online]). Hematoxylin-eosin staining of the temporal lobe confirmed loss of neurons with glial cell proliferation in the patient with refractory seizures but not in the control patient without seizures (Fig E12 [online]).
Discussion
In this study, we showed that MPO, an abundant and potent inflammatory mediator secreted by leukocytes, was increased in the brain of a human patient with refractory epilepsy, as well as in a mouse model of epilepsy. In our murine experiments, MPO could be targeted to noninvasively image disease and treatment response. Interestingly, in these same experiments, inhibiting MPO activity reduced SRS severity, which implies that MPO is involved in the development of epileptogenesis.
In our mouse model, the number of MPO-containing leukocytes in the brain increased markedly during epileptogenesis. Most of these cells were neutrophils, but MPO was also detected in a smaller number of CD68+ cells, which suggests that MPO is released in the brain not only by infiltrating neutrophils but also by some of the activated parenchymal microglia or infiltrating monocytes and/or macrophages.
Although the peroxidase assay we used does not distinguish between MPO and other peroxidases, most of the increased activity measured during epileptogenesis was from MPO. By using the specific irreversible MPO inhibitor ABAH (24), there was a reduction in peroxidase activity and improvement in markers for sequelae of epileptogenesis. We identified the MPO-specific product 3-chlorotyrosine during epileptogenesis, and its level was attenuated with ABAH. Moreover, MPO-deficient mice induced with encephalitogenic peptides exhibited low peroxidase activity similar to that of sham-induced control wild-type mice. Finally, we confirmed the presence of MPO in brains during epileptogenesis in vivo by using a molecular agent highly selective for MPO and validated in MPO-deficient mice (19,25).
We showed that MPO activates MMP, proteases that are involved in BBB breakdown (26). BBB disruption is critical during epileptogenesis and enhances neuronal excitability in part through albumin leakage from blood vessels (4). MMP is also directly linked to epileptogenesis: MMP-9 knockout mice show diminished sensitivity to seizures, and transgenic mice that overexpress MMP-9 show enhanced sensitivity (27). MMP-9 enhances seizure development in these mice by converting pro–brain-derived neurotrophic factor to brain-derived neurotrophic factor (28). Our results add a link between MPO and the known neuroexcitatory actions of MMP during epileptogenesis.
Pilocarpine administration in MPO-deficient mice resulted in more acute seizures than those seen in wild-type mice. Similar conflicting results were found in previous studies of the involvement of MPO in atherosclerosis, in that both MPO-deficient mice (29), and transgenic mice that overexpress MPO (30) showed increased atherosclerotic disease. This discrepancy may be explained by the findings that in MPO-deficient mice there is increased inducible nitric oxide synthase expression and nitric oxide production in neutrophils (31), as well as increased T-cell–mediated inflammation (32).
A limitation of our study is the uniformity of the cause of seizure (drug induced), while in humans, seizure can result from many causes. Future testing in other models and in humans will further validate the results. Another limitation is the lack of an MPO-deficient model to more specifically validate the imaging agent. However, analogous agents (gadolinium instead of indium) based on the same chelate have been previously validated in MPO-deficient mice in other models of neurological and cardiovascular diseases (25,33).
Roughly one-third of patients with epilepsy have seizures that are refractory to antiepileptic medications (1), but such drug-resistant epilepsy is potentially curable if an epileptic focus can be detected with imaging and then surgically removed. Given our results linking MPO to epileptogenesis and the highly sensitive ability to image its increased activity, MPO may provide a complementary imaging approach in patients with refractory or cryptogenic epilepsy (34) in whom conventional imaging fails to demonstrate an abnormality.
Advances in Knowledge
■ Myeloperoxidase (MPO) and its products are increased in the hippocampal regions in a murine model of temporal lobe epilepsy as compared with sham-induced animals (P < .05), and inhibiting MPO activity resulted in decreased measures of recurrent seizure severity (P < .05).
■ Molecular nuclear imaging in which MPO activity was targeted allowed noninvasive identification of increased MPO-mediated radiotracer uptake in the hippocampal regions in epileptogenic mouse brains but not in sham mouse brains (radiotracer uptake, 0.78 vs 0.18; P = .01) and a decrease in uptake after the administration of a specific MPO inhibitor relative to saline-treated epileptogenic mouse brains (radiotracer uptake, 0.60 vs 0.78; P = .03).
■ MPO was increased in the temporal lobe of a human patient with refractory epilepsy but not in a human patient without epilepsy.
Implications for Patient Care
■ Patients with refractory epilepsy without a known underlying brain lesion have limited therapeutic options; we showed that MPO is increased in a murine model of epilepsy and in a human patient with refractory epilepsy—therefore, MPO imaging may allow detection of subtle underlying lesions in these patients in whom conventional imaging has failed to demonstrate a surgical target.
■ Given that MPO was increased in the temporal lobe of a human patient with seizures and that inhibiting its activity decreased seizure recurrence in an animal model of temporal lobe epilepsy, MPO could be a potential therapeutic target in the treatment of epilepsy and epileptogenesis.
APPENDIX
SUPPLEMENTAL FIGURES
Acknowledgments
Acknowledgments
We thank Virna Cortez-Retamozo, PhD, and Martin Etzrodt, PhD, at Massachusetts General Hospital for their help with flow cytometry experiments. Also, we thank Yawei Kong, PhD, at Massachusetts General Hospital for his assistance with histopathology experiments. We thank Reza Forghani, MD, PhD, at McGill University and Ralph Weissleder, MD, PhD, at Massachusetts General Hospital for helpful discussions.
Received August 21, 2014; revision requested October 27; revision received April 27, 2015; accepted May 21; final version accepted July 9.
Y.Z. supported in part by the Fundamental Research Funds for the Central Universities of China, by the National Natural Science Foundation of China (no. 81501116), by the Research Fund for the Doctoral Program of Higher Education (no. 20130211120026), and by a scholarship from Shanghai Jiaotong University School of Medicine, Shanghai, China. B.P. supported by a fellowship from the Ernst Schering Foundation, Berlin, Germany.
Funding: This research was supported by the National Institutes of Health (grants R01-NS070835 and R01-NS072167).
Current address: Department of Radiology, Johns Hopkins University, Baltimore, Md.
Disclosures of Conflicts of Interest: Y.Z. disclosed no relevant relationships. D.P.S. disclosed no relevant relationships. B.P. disclosed no relevant relationships. G.R.W. disclosed no relevant relationships. L.B. disclosed no relevant relationships. W.A. disclosed no relevant relationships. S.S. disclosed no relevant relationships. Y.I. disclosed no relevant relationships. M.A. disclosed no relevant relationships. W.Z. disclosed no relevant relationships. E.R. disclosed no relevant relationships. A.M. disclosed no relevant relationships. E.J.K. disclosed no relevant relationships. C.W. disclosed no relevant relationships. Y.P. disclosed no relevant relationships. F.K.S. disclosed no relevant relationships. J.W.C. Activities related to the present article: disclosed no relevant relationships. Activities not related to the present article: institution received grants from Pfizer; author received textbook royalties from Elsevier. Other relationships: disclosed no relevant relationships.
Abbreviations:
- ABAH
- 4-aminobenzoic acid hydrazide
- BBB
- blood-brain barrier
- MMP
- matrix metalloproteinases
- MPO
- myeloperoxidase
- SE
- status epilepticus
- SRS
- spontaneous recurrent seizures
References
- 1.Perucca E, French J, Bialer M. Development of new antiepileptic drugs: challenges, incentives, and recent advances. Lancet Neurol 2007;6(9):793–804. [DOI] [PubMed] [Google Scholar]
- 2.Bialer M, White HS. Key factors in the discovery and development of new antiepileptic drugs. Nat Rev Drug Discov 2010;9(1):68–82. [DOI] [PubMed] [Google Scholar]
- 3.Vezzani A, French J, Bartfai T, Baram TZ. The role of inflammation in epilepsy. Nat Rev Neurol 2011;7(1):31–40. [DOI] [PMC free article] [PubMed] [Google Scholar]
- 4.Cacheaux LP, Ivens S, David Y, et al. Transcriptome profiling reveals TGF-beta signaling involvement in epileptogenesis. J Neurosci 2009;29(28):8927–8935. [DOI] [PMC free article] [PubMed] [Google Scholar]
- 5.Fabene PF, Navarro Mora G, Martinello M, et al. A role for leukocyte-endothelial adhesion mechanisms in epilepsy. Nat Med 2008;14(12):1377–1383. [DOI] [PMC free article] [PubMed] [Google Scholar]
- 6.van der Veen BS, de Winther MP, Heeringa P. Myeloperoxidase: molecular mechanisms of action and their relevance to human health and disease. Antioxid Redox Signal 2009;11(11):2899–2937. [DOI] [PubMed] [Google Scholar]
- 7.Wang Y, Rosen H, Madtes DK, et al. Myeloperoxidase inactivates TIMP-1 by oxidizing its N-terminal cysteine residue: an oxidative mechanism for regulating proteolysis during inflammation. J Biol Chem 2007;282(44):31826–31834. [DOI] [PMC free article] [PubMed] [Google Scholar]
- 8.Fu X, Kassim SY, Parks WC, Heinecke JW. Hypochlorous acid generated by myeloperoxidase modifies adjacent tryptophan and glycine residues in the catalytic domain of matrix metalloproteinase-7 (matrilysin): an oxidative mechanism for restraining proteolytic activity during inflammation. J Biol Chem 2003;278(31):28403–28409. [DOI] [PubMed] [Google Scholar]
- 9.van Vliet EA, da Costa Araújo S, Redeker S, van Schaik R, Aronica E, Gorter JA. Blood-brain barrier leakage may lead to progression of temporal lobe epilepsy. Brain 2007;130(Pt 2):521–534. [DOI] [PubMed] [Google Scholar]
- 10.Bellissimo MI, Amado D, Abdalla DS, Ferreira EC, Cavalheiro EA, Naffah-Mazzacoratti MG. Superoxide dismutase, glutathione peroxidase activities and the hydroperoxide concentration are modified in the hippocampus of epileptic rats. Epilepsy Res 2001;46(2):121–128. [DOI] [PubMed] [Google Scholar]
- 11.Freitas RM, Vasconcelos SM, Souza FC, Viana GS, Fonteles MM. Oxidative stress in the hippocampus after pilocarpine-induced status epilepticus in Wistar rats. FEBS J 2005;272(6):1307–1312. [DOI] [PubMed] [Google Scholar]
- 12.Waldbaum S, Patel M. Mitochondria, oxidative stress, and temporal lobe epilepsy. Epilepsy Res 2010;88(1):23–45. [DOI] [PMC free article] [PubMed] [Google Scholar]
- 13.Wieser HG; ILAE Commission on Neurosurgery of Epilepsy. ILAE Commission Report. Mesial temporal lobe epilepsy with hippocampal sclerosis. Epilepsia 2004;45(6):695–714. [DOI] [PubMed] [Google Scholar]
- 14.Curia G, Longo D, Biagini G, Jones RS, Avoli M. The pilocarpine model of temporal lobe epilepsy. J Neurosci Methods 2008;172(2):143–157. [DOI] [PMC free article] [PubMed] [Google Scholar]
- 15.Racine RJ. Modification of seizure activity by electrical stimulation. II. Motor seizure. Electroencephalogr Clin Neurophysiol 1972;32(3):281–294. [DOI] [PubMed] [Google Scholar]
- 16.Lüttjohann A, Fabene PF, van Luijtelaar G. A revised Racine’s scale for PTZ-induced seizures in rats. Physiol Behav 2009;98(5):579–586. [DOI] [PubMed] [Google Scholar]
- 17.Kettle AJ, Gedye CA, Hampton MB, Winterbourn CC. Inhibition of myeloperoxidase by benzoic acid hydrazides. Biochem J 1995;308(Pt 2):559–563. [DOI] [PMC free article] [PubMed] [Google Scholar]
- 18.Chen JW, Querol Sans M, Bogdanov A, Jr, Weissleder R. Imaging of myeloperoxidase in mice by using novel amplifiable paramagnetic substrates. Radiology 2006;240(2):473–481. [DOI] [PubMed] [Google Scholar]
- 19.Rodríguez E, Nilges M, Weissleder R, Chen JW. Activatable magnetic resonance imaging agents for myeloperoxidase sensing: mechanism of activation, stability, and toxicity. J Am Chem Soc 2010;132(1):168–177. [DOI] [PMC free article] [PubMed] [Google Scholar]
- 20.McCarty DM, DiRosario J, Gulaid K, Muenzer J, Fu H. Mannitol-facilitated CNS entry of rAAV2 vector significantly delayed the neurological disease progression in MPS IIIB mice. Gene Ther 2009;16(11):1340–1352. [DOI] [PMC free article] [PubMed] [Google Scholar]
- 21.Forghani R, Wojtkiewicz GR, Zhang Y, et al. Demyelinating diseases: myeloperoxidase as an imaging biomarker and therapeutic target. Radiology 2012;263(2):451–460. [DOI] [PMC free article] [PubMed] [Google Scholar]
- 22.Baldus S, Rudolph V, Roiss M, et al. Heparins increase endothelial nitric oxide bioavailability by liberating vessel-immobilized myeloperoxidase. Circulation 2006;113(15):1871–1878. [DOI] [PubMed] [Google Scholar]
- 23.Borges K, Gearing M, McDermott DL, et al. Neuronal and glial pathological changes during epileptogenesis in the mouse pilocarpine model. Exp Neurol 2003;182(1):21–34. [DOI] [PubMed] [Google Scholar]
- 24.Kettle AJ, Gedye CA, Winterbourn CC. Mechanism of inactivation of myeloperoxidase by 4-aminobenzoic acid hydrazide. Biochem J 1997;321(Pt 2):503–508. [DOI] [PMC free article] [PubMed] [Google Scholar]
- 25.Nahrendorf M, Sosnovik D, Chen JW, et al. Activatable magnetic resonance imaging agent reports myeloperoxidase activity in healing infarcts and noninvasively detects the antiinflammatory effects of atorvastatin on ischemia-reperfusion injury. Circulation 2008;117(9):1153–1160. [DOI] [PMC free article] [PubMed] [Google Scholar]
- 26.Candelario-Jalil E, Yang Y, Rosenberg GA. Diverse roles of matrix metalloproteinases and tissue inhibitors of metalloproteinases in neuroinflammation and cerebral ischemia. Neuroscience 2009;158(3):983–994. [DOI] [PMC free article] [PubMed] [Google Scholar]
- 27.Wilczynski GM, Konopacki FA, Wilczek E, et al. Important role of matrix metalloproteinase 9 in epileptogenesis. J Cell Biol 2008;180(5):1021–1035. [DOI] [PMC free article] [PubMed] [Google Scholar]
- 28.Mizoguchi H, Nakade J, Tachibana M, et al. Matrix metalloproteinase-9 contributes to kindled seizure development in pentylenetetrazole-treated mice by converting pro-BDNF to mature BDNF in the hippocampus. J Neurosci 2011;31(36):12963–12971. [DOI] [PMC free article] [PubMed] [Google Scholar]
- 29.Brennan ML, Anderson MM, Shih DM, et al. Increased atherosclerosis in myeloperoxidase-deficient mice. J Clin Invest 2001;107(4):419–430. [DOI] [PMC free article] [PubMed] [Google Scholar]
- 30.McMillen TS, Heinecke JW, LeBoeuf RC. Expression of human myeloperoxidase by macrophages promotes atherosclerosis in mice. Circulation 2005;111(21):2798–2804. [DOI] [PubMed] [Google Scholar]
- 31.Brovkovych V, Gao XP, Ong E, et al. Augmented inducible nitric oxide synthase expression and increased NO production reduce sepsis-induced lung injury and mortality in myeloperoxidase-null mice. Am J Physiol Lung Cell Mol Physiol 2008;295(1):L96–L103. [DOI] [PMC free article] [PubMed] [Google Scholar]
- 32.Milla C, Yang S, Cornfield DN, et al. Myeloperoxidase deficiency enhances inflammation after allogeneic marrow transplantation. Am J Physiol Lung Cell Mol Physiol 2004;287(4):L706–L714. [DOI] [PubMed] [Google Scholar]
- 33.Breckwoldt MO, Chen JW, Stangenberg L, et al. Tracking the inflammatory response in stroke in vivo by sensing the enzyme myeloperoxidase. Proc Natl Acad Sci U S A 2008;105(47):18584–18589. [DOI] [PMC free article] [PubMed] [Google Scholar]
- 34.Shorvon SD. The etiologic classification of epilepsy. Epilepsia 2011;52(6):1052–1057. [DOI] [PubMed] [Google Scholar]
Associated Data
This section collects any data citations, data availability statements, or supplementary materials included in this article.


