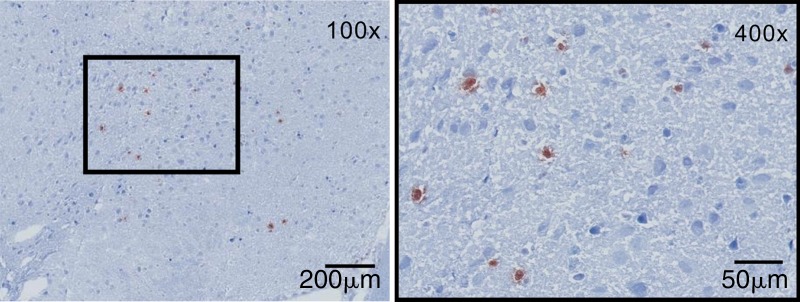
Figure 2b:
Sources of brain MPO. (a) Plots (left) and graph (right) show quantification of MPO-positive cells (n = 6 per group; the Mann-Whitney test was used). All data in the plots are means ± standard errors of measurement. (b) Photomicrographs (Timm stain; original magnification, ×100 [left] and ×400 [right]) show that MPO-positive cells were mainly found in the hippocampal and parahippocampal regions. MM = macrophages and microglia.

