The addition of functional sequences to the conventional MR imaging protocol may increase sensitivity for determination of treatment response in soft-tissue sarcomas treated preoperatively with neoadjuvant therapy, particularly when tumors form granulation tissue and fibrosis rather than necrosis as a histologic response to treatment.
Abstract
Purpose
To determine the added value of quantitative diffusion-weighted and dynamic contrast material–enhanced imaging to conventional magnetic resonance (MR) imaging for assessment of the response of soft-tissue sarcomas to neoadjuvant therapy.
Materials and Methods
MR imaging examinations in 23 patients with soft-tissue sarcomas who had undergone neoadjuvant therapy were reviewed by two readers during three sessions: conventional imaging (T1-weighted, fluid-sensitive, static postcontrast T1-weighted), conventional with diffusion-weighted imaging, and conventional with diffusion-weighted and dynamic contrast-enhanced imaging. For each session, readers recorded imaging features and determined treatment response. Interobserver agreement was assessed and receiver operating characteristic analysis was performed to evaluate the accuracy of each session for determining response by using results of the histologic analysis as the reference standard. Good response was defined as less than or equal to 5% residual viable tumor.
Results
Of the 23 sarcomas, four (17.4%) showed good histologic response (three of four with >95% granulation tissue and <5% necrosis, one of four with 95% necrosis and <5% viable tumor) and 19 (82.6%) showed poor response (viable tumor range, 10%–100%). Interobserver agreement was substantial or excellent for imaging features in all sequences (k = 0.789–1.000). Receiver operating characteristic analysis showed an increase in diagnostic performance with the addition of diffusion-weighted and dynamic contrast-enhanced MR imaging for prediction of response compared with that for conventional imaging alone (areas under the curve, 0.500, 0.676, 0.821 [reader 1] and 0.506, 0.704, 0.833 [reader 2], respectively).
Conclusion
Adding functional sequences to the conventional MR imaging protocol increases the sensitivity of MR imaging for determining treatment response in soft-tissue sarcomas.
© RSNA, 2015
Introduction
Neoadjuvant chemotherapy and radiation are used in the treatment of soft-tissue sarcomas to provide better local control (1). The treatment-induced histologic response at the time of definitive surgery best reflects treatment effectiveness and is highly associated with the patient’s prognosis (2). However, the amount of remaining viable tumor can be determined only at surgical resection and histologic analysis after completion of neoadjuvant treatment (3). Furthermore, to be considered effective and indicative of a good prognosis for the patient, a neoadjuvant treatment regimen requires 95% tumor response with only 5% viable tumor remaining (2). Treatment regimens for soft-tissue sarcomas are evolving (4), and a noninvasive imaging technique to help predict treatment response and prognosis would be desirable so that an alternate presurgical regimen may be used, as needed, before the patient undergoes definitive surgical resection.
Magnetic resonance (MR) imaging remains the modality of choice for the evaluation of soft-tissue sarcomas. However, conventional T1-weighted, T2-weighted, and static contrast material–enhanced MR imaging do not allow accurate assessment of treatment-related response (5–7). Soft-tissue sarcomas show a pathologic response to treatment in the form of granulation tissue and fibrosis (3); hence, because granulation tissue and fibrosis appear as enhancement on images after intravenous administration of contrast material, distinguishing posttreatment inflammatory changes from residual viable tumor is not possible with conventional MR imaging alone.
Compared with nonneoplastic tissue, malignant tumors have enlarged cell nuclei and are hypercellular. Because the degree of restriction to water diffusion is correlated with tissue cellularity and the integrity of cell membranes, the aforementioned histopathologic features condense the extracellular matrix, and the space in which water protons can diffuse in the extracellular areas is reduced, with a resultant decrease in the apparent diffusion coefficient (ADC) at diffusion-weighted imaging (DWI) (8). In addition, most malignant neoplasms show hypervascularity, a feature that appears as rapid, early, and strong enhancement at dynamic contrast-enhanced (DCE) imaging. Hence, the functional MR imaging techniques of DWI and DCE imaging may offer a more accurate assessment of histologic response, as suggested for other organ systems (9–13), and for osteosarcoma (5,6,14–16). However, limited reports exist regarding the use of DWI (17–19) and DCE imaging for prediction of response to treatment in soft-tissue sarcomas (20–26).
We hypothesized that differences in diffusion characteristics and enhancement patterns exist among viable tumor, nonneoplastic granulation tissue, and fibrosis in soft-tissue sarcomas, and that the addition of DWI and DCE imaging to the conventional MR imaging examination may increase the accuracy of MR imaging for assessment of treatment response. The purpose of our study was to determine the value of adding quantitative DWI and DCE to conventional MR imaging for assessment of response to neoadjuvant therapy in soft-tissue sarcomas.
Materials and Methods
This Health Insurance Portability and Accountability Act–compliant retrospective study was approved by our institutional review board, and the requirement to obtain informed consent was waived.
Study Population
Data of patients with newly diagnosed soft-tissue sarcoma who were referred to the orthopedic oncology clinic in our institution between August 2011 and February 2014 were extracted from an institutional review board–approved database. The respective medical records were reviewed, including the imaging, treatment, and pathologic diagnoses. Patients were included only if they had completed all their care at the institution; had undergone postneoadjuvant therapy, preoperative conventional MR imaging (T1-weighted, T2-weighted, or T1-weighted imaging with contrast enhancement) and DWI or DCE MR imaging; and had a histologic specimen available that could be analyzed for the percentage of postsurgical necrosis, viable tumor, and granulation tissue or fibrosis. Exclusion criteria were the lack of required MR imaging sequences or histologic specimens and neoadjuvant therapy or surgical treatment outside the study institution.
Pathologic Examination
All pathologic specimens were reviewed by a pathologist (E.M., with 24 years of experience in analysis of soft-tissue sarcomas). The histologic diagnosis was confirmed, and the percentages of viable tumor, treatment-related necrosis, and posttreatment granulation tissue and fibrosis were recorded for each patient. This was done by performing semiquantitative estimation of each component on each glass slide for each tumor and averaging the findings for all of the slides for each neoplasm.
Overview of MR Imaging Protocol
MR imaging was performed with a 3.0-T imager (Verio; Siemens Medical Solutions, Erlangen, Germany) by using a phased-array or eight-channel extremity coil (depending on the anatomic region) with the sequences that follow.
Conventional MR Imaging
The imaging protocol included axial and coronal T1-weighted (spin-echo imaging: repetition time msec/echo time msec, 600–800/9–15), fluid-sensitive (coronal short tau inversion-recovery imaging: 1500–2000/140–150 and axial T2-weighted imaging with fat suppression: 3500–4500/60–75; inversion time, 220 msec) sequences and coronal T1-weighted sequence (fat-suppressed volume-interpolated breath-hold examination: 4.6/1.4; flip angle, 9.5°; section thickness, 1 mm; isotropic resolution) before and after intravenous administration of 0.1 mmol per kilogram of gadopentetate dimeglumine (Magnevist; Bayer Schering, Berlin, Germany). Subtraction imaging, with subtraction of the precontrast from the postcontrast images, was provided. Multiplanar reconstructions (axial and sagittal planes) were obtained from the T1-weighted isotropic sequences.
Quantitative DWI and ADC Mapping
Before administration of contrast material, fat-suppressed DWI was performed in the axial plane (spin-echo, single-shot, echo-planar imaging: 760/80; inversion time, 180 msec; number of signals acquired, two; field of view, 180–250 mm2; matrix, 256 × 256 pixels; section thickness, 5 mm; intersection gap, 1 mm; section levels, 30; echo-planar imaging factor, 88; b values, 50, 400, and 800 sec/mm2). ADC maps were automatically generated from the DWI sequences.
DCE MR Imaging
DCE MR imaging was performed in the coronal or sagittal plane (time-resolved angiography with interleaved stochastic trajectories: 2.2–4.16/0.77–1.33; field of view, 230–400 mm; matrix, 108–256 pixels; section thickness, 3–8 mm, according to the anatomic body part), capturing arterial, mixed, and venous phase images. Contrast material (gadopentetate dimeglumine) was injected at a rate of 3 mL/sec, and images from 30 phases were acquired with a minimum temporal resolution of 7 seconds. A composite set of images was reconstructed with maximum intensity projection in coronal, axial, and sagittal planes. Enhancement in the volume of interest could be viewed throughout different phases, similar to techniques described in prior work (22,26).
Readers and Image Review Order
Two readers (S.A. [reader 1] and T.S. [reader 2], with 2 and 3 years of musculoskeletal MR tumor imaging experience, respectively), who had no knowledge of the histopathologic and official dictated imaging reports, independently evaluated the MR imaging studies with a picture archiving and communication system workstation (Ultravisual; Emageon, Birmingham, Ala). Interpretation disagreements were resolved by a third reader (L.M.F., with 12 years of experience) in consensus with the other readers. Images from conventional sequences were reviewed first, followed by the addition of DWI and ADC maps, and then DCE images. The readers graded each sequence on a quality scale of 1–4 (1 = nondiagnostic, artifacts affected > 50% of images; 2 = nondiagnostic, artifacts affected 25%–50% of images; 3 = diagnostic, artifacts affected < 25% of images; and 4 = diagnostic, no substantial artifacts), similar to methods described in prior work (26).
Reader Procedures: Conventional Imaging
On T1-weighted and fluid-sensitive images, readers evaluated the signal intensity (hypointense, isointense, hyperintense relative to muscle) and heterogeneity of the neoplasms on a scale of 1–4 (1, ≤ 25% heterogeneity; 2, 26%–50% heterogeneity; 3, 51%–75% heterogeneity; 4, >75% heterogeneity). On static postcontrast and subtraction images, readers recorded the presence and percentage of enhancement. Treatment response was assessed by using a semiquantitative scale of 1–5, equating necrosis with areas with a lack of enhancement (poor response, >5% of the tumor enhancing; good response, ≤5% of the tumor enhancing). One reader recorded the location and maximum dimension of each mass.
Reader Procedures: DWI with ADC Mapping
Having the conventional MR images available for viewing, each reader recorded minimum and average ADCs in the center, proximal, and distal periphery of each neoplasm by using regions of interest that encompassed the maximum possible tumor area, while ensuring that they did not include tissue outside the tumor boundaries. By using a threshold ADC value of 1.0 × 10⁻³ mm2/sec for differentiating malignant viable tumor from nonneoplastic tissue, tumor locations with lower and higher ADCs were considered to be viable and nonviable tumor, respectively, similar to methods used in prior work (16). The percentage of treatment response was determined on the basis of a qualitative visual assessment of the measured ADCs (poor response, >5% of tumor with low ADCs; good response, ≤5% of tumor with low ADCs).
Reader Procedures: DCE MR Imaging
The conventional MR and DWI images were available for viewing. Each reader reviewed the arterial phase images of the DCE MR imaging sequence (defined as the image on which arterial filling was first identified) and qualitatively recorded the presence or absence of early tumor enhancement and presence or absence of treatment response (poor response, >5% of tumor enhancing or good response, ≤5% of tumor enhancing).
Statistical Analysis
The histologically defined percentages of tumor necrosis, viable tumor, and granulation tissue or fibrosis in the soft-tissue sarcomas were used as the reference standard for treatment response. Response was defined as good when the tumor exhibited less than or equal to 5% viable tumor and as poor when the tumor demonstrated greater than 5% viable tumor. Descriptive statistics were reported, including demographic data and a summary of image quality measurements and imaging features from consensus data. The accuracy of each feature for predicting histologic response (good or poor) was determined from the consensus readings and was analyzed with the Fisher exact test for categoric variables and the Wilcoxon rank-sum test for continuous variables. Interobserver agreement for the assessment of each imaging feature was evaluated by using the Cohen k for the qualitative imaging variables and intraclass correlation coefficients for ADC measurements. After calculating the average of all ADCs of the two readers, we obtained receiver operating characteristic curves to specify the optimal threshold ADC for predicting response, which we considered to be the value that maximized the sum of specificity and sensitivity. Receiver operating characteristic analysis was performed to determine the accuracy of the reading sessions (conventional MR imaging, conventional MR with DWI, and conventional MR with DWI and DCE MR imaging) for assessment of response by each reader. All analyses were performed by using statistical software (MedCalc 8.0; MedCalc, Mariakerke, Belgium).
Results
Of the 130 referred patients with soft- tissue sarcomas, 23 patients (mean age, 48 years ± 26; range, 2–89 years) had undergone MR imaging with the required sequences and included 13 male patients (mean age, 49 years ± 28 years; range, 2–81 years) and 10 female patients (mean age, 47 years ± 25; range, 10–89 years). Of these 23 studies, 22 included DWI, 18 included DCE, and 15 included both DWI and DCE imaging. The average interval between MR imaging and surgery was 25 days (range, 0–129 days).
Table 1 is a summary of the demographic and histologic features of the study samples. There was no significant difference in age between male and female patients (P = .42). The average maximum diameter of the tumors was 7.4 cm ± 4.7 (range, 1.3–15.4 cm). Their locations were upper arm (n = 1), chest (n = 3), pelvis (n = 5), thigh (n = 11), and calf or ankle (n = 3). Of the 23 soft-tissue sarcomas, four (17.4%) had a good histologic response to treatment with a combination of necrosis (average, 23.5%; range, 0%–95%) and granulation tissue or fibrosis (average, 73.75%; range, 0%–100%), whereas the remaining 19 (82.6%) had a poor response to treatment, with a range of 10%–100% viable tumor (average, 57%) (Fig 1). In three of four patients with a good histologic response, there was less than 5% necrosis, with the majority of the tumor showing response in the form of granulation tissue or fibrosis. All four patients with good histologic response underwent both DCE imaging and DWI. Of the 19 studies with poor response, 18 included DWI, 14 included DCE, and 11 included both DWI and DCE imaging.
Table 1.
Demographic and Histologic Results for Subjects with High-Grade Soft-Tissue Sarcomas in the Study Group
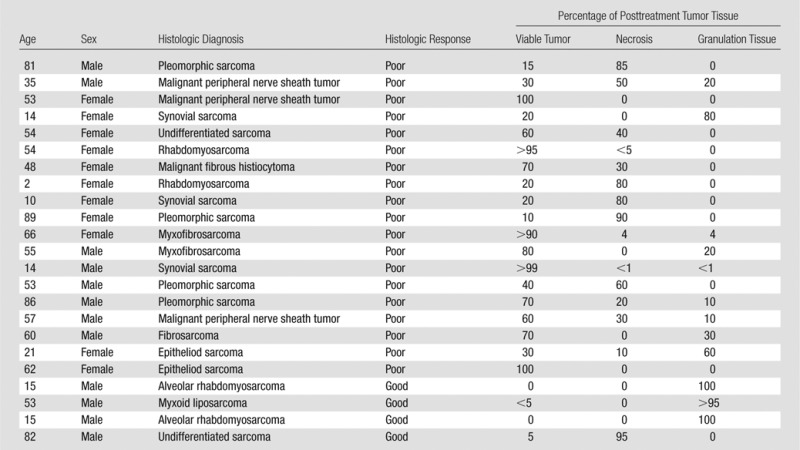
Figure 1a:
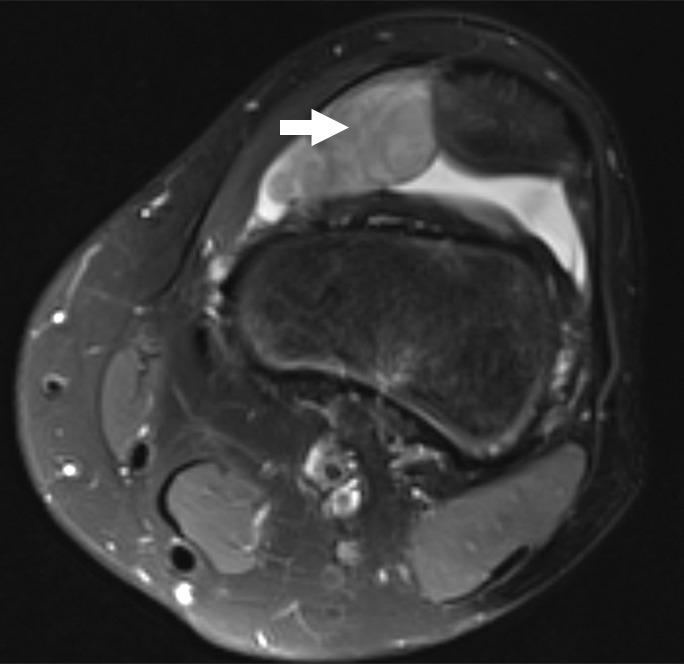
Images and photomicrograph in a 14-year-old boy with synovial sarcoma. Preoperative MR imaging was performed after neoadjuvant chemotherapy with ifosfamide and doxorubicin and radiation. (a) Axial fluid-sensitive fat-suppressed T2-weighted image (2191/59) shows heterogeneous hyperintense intra-articular mass (arrow) in suprapatellar pouch extending into medial thigh. (b) Axial T1-weighted (778/11) image shows heterogeneous mass (arrow) containing hyperintense components when compared with skeletal muscle. (c) Axial postcontrast fat-suppressed T1-weighted image (volumetric interpolated breath-hold examination, 6.35/1.64) shows enhancement throughout most of mass (arrow). (d) ADC map shows restricted diffusion throughout mass (arrow), with minimum ADC of 0.7 mm2/sec and mean ADC of 1.5 mm2/sec. (e) Coronal contrast-enhanced image obtained at DCE imaging (time-resolved angiography with interleaved stochastic trajectories sequence, 3.6/1.3) 10 seconds after administration of contrast agent shows avid diffuse, early arterial enhancement throughout mass (arrows). Patient underwent radical resection of left distal thigh and medial knee synovial sarcoma. Histopathologic analysis of surgical specimen revealed minimal treatment-associated necrosis and sclerosis. (f) Histologic slide (magnification, ×40) stained with hematoxylin and eosin shows wholly viable, monotonous fibrous synovial sarcoma. Nearly every single tumor cell nucleus is viable. A few neoplastic nuclei are indicated with arrows. Both anatomic and functional MR imaging features support histopathologic findings of residual viable tumor with poor treatment response.
Figure 1b:
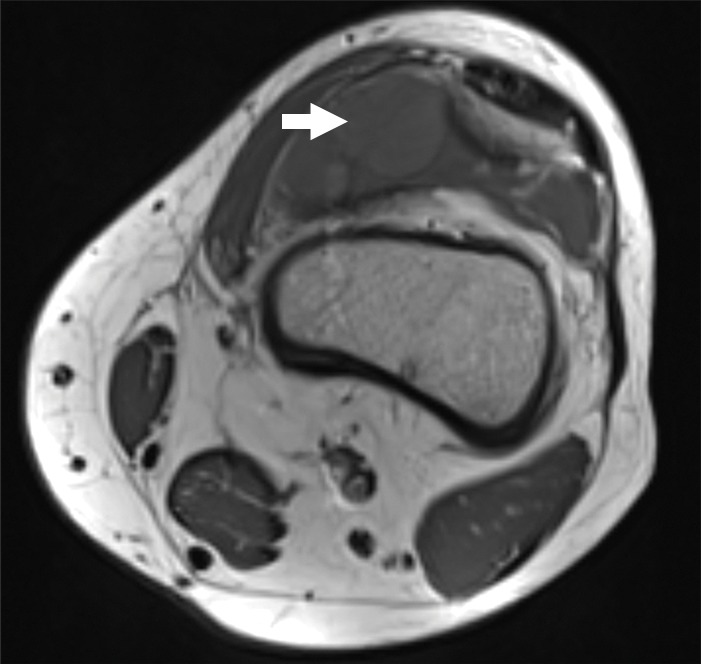
Images and photomicrograph in a 14-year-old boy with synovial sarcoma. Preoperative MR imaging was performed after neoadjuvant chemotherapy with ifosfamide and doxorubicin and radiation. (a) Axial fluid-sensitive fat-suppressed T2-weighted image (2191/59) shows heterogeneous hyperintense intra-articular mass (arrow) in suprapatellar pouch extending into medial thigh. (b) Axial T1-weighted (778/11) image shows heterogeneous mass (arrow) containing hyperintense components when compared with skeletal muscle. (c) Axial postcontrast fat-suppressed T1-weighted image (volumetric interpolated breath-hold examination, 6.35/1.64) shows enhancement throughout most of mass (arrow). (d) ADC map shows restricted diffusion throughout mass (arrow), with minimum ADC of 0.7 mm2/sec and mean ADC of 1.5 mm2/sec. (e) Coronal contrast-enhanced image obtained at DCE imaging (time-resolved angiography with interleaved stochastic trajectories sequence, 3.6/1.3) 10 seconds after administration of contrast agent shows avid diffuse, early arterial enhancement throughout mass (arrows). Patient underwent radical resection of left distal thigh and medial knee synovial sarcoma. Histopathologic analysis of surgical specimen revealed minimal treatment-associated necrosis and sclerosis. (f) Histologic slide (magnification, ×40) stained with hematoxylin and eosin shows wholly viable, monotonous fibrous synovial sarcoma. Nearly every single tumor cell nucleus is viable. A few neoplastic nuclei are indicated with arrows. Both anatomic and functional MR imaging features support histopathologic findings of residual viable tumor with poor treatment response.
Figure 1c:
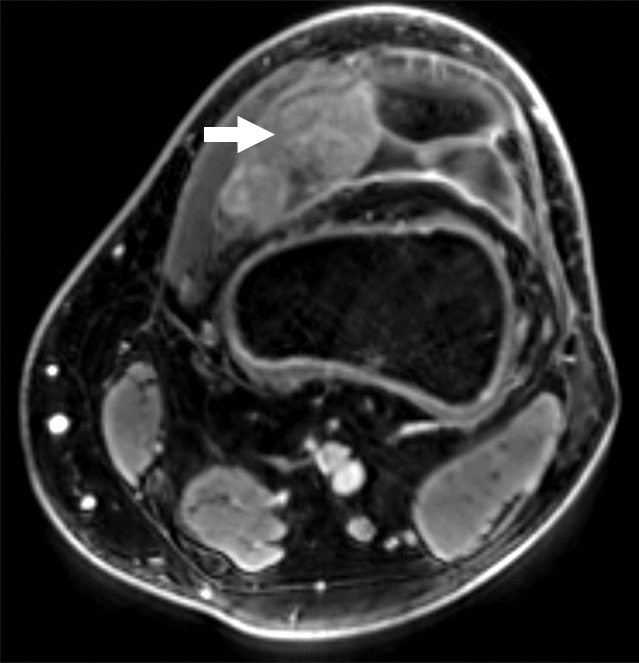
Images and photomicrograph in a 14-year-old boy with synovial sarcoma. Preoperative MR imaging was performed after neoadjuvant chemotherapy with ifosfamide and doxorubicin and radiation. (a) Axial fluid-sensitive fat-suppressed T2-weighted image (2191/59) shows heterogeneous hyperintense intra-articular mass (arrow) in suprapatellar pouch extending into medial thigh. (b) Axial T1-weighted (778/11) image shows heterogeneous mass (arrow) containing hyperintense components when compared with skeletal muscle. (c) Axial postcontrast fat-suppressed T1-weighted image (volumetric interpolated breath-hold examination, 6.35/1.64) shows enhancement throughout most of mass (arrow). (d) ADC map shows restricted diffusion throughout mass (arrow), with minimum ADC of 0.7 mm2/sec and mean ADC of 1.5 mm2/sec. (e) Coronal contrast-enhanced image obtained at DCE imaging (time-resolved angiography with interleaved stochastic trajectories sequence, 3.6/1.3) 10 seconds after administration of contrast agent shows avid diffuse, early arterial enhancement throughout mass (arrows). Patient underwent radical resection of left distal thigh and medial knee synovial sarcoma. Histopathologic analysis of surgical specimen revealed minimal treatment-associated necrosis and sclerosis. (f) Histologic slide (magnification, ×40) stained with hematoxylin and eosin shows wholly viable, monotonous fibrous synovial sarcoma. Nearly every single tumor cell nucleus is viable. A few neoplastic nuclei are indicated with arrows. Both anatomic and functional MR imaging features support histopathologic findings of residual viable tumor with poor treatment response.
Figure 1d:
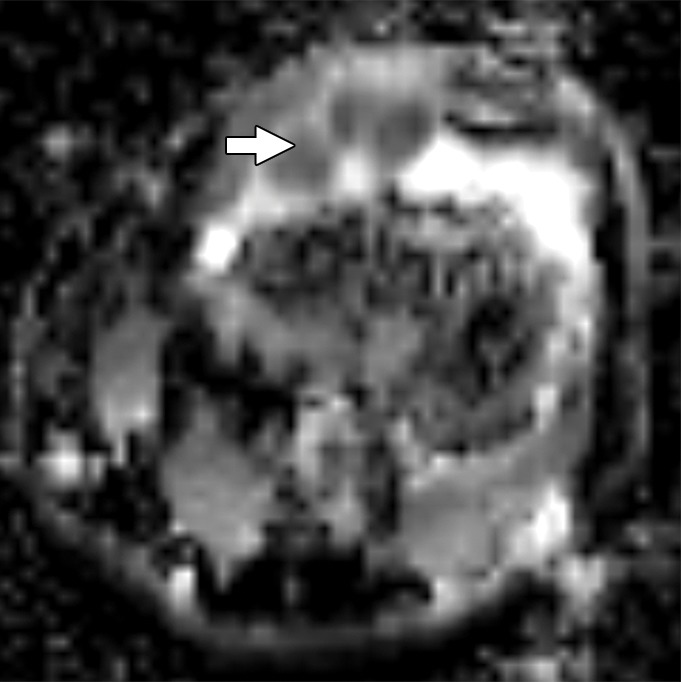
Images and photomicrograph in a 14-year-old boy with synovial sarcoma. Preoperative MR imaging was performed after neoadjuvant chemotherapy with ifosfamide and doxorubicin and radiation. (a) Axial fluid-sensitive fat-suppressed T2-weighted image (2191/59) shows heterogeneous hyperintense intra-articular mass (arrow) in suprapatellar pouch extending into medial thigh. (b) Axial T1-weighted (778/11) image shows heterogeneous mass (arrow) containing hyperintense components when compared with skeletal muscle. (c) Axial postcontrast fat-suppressed T1-weighted image (volumetric interpolated breath-hold examination, 6.35/1.64) shows enhancement throughout most of mass (arrow). (d) ADC map shows restricted diffusion throughout mass (arrow), with minimum ADC of 0.7 mm2/sec and mean ADC of 1.5 mm2/sec. (e) Coronal contrast-enhanced image obtained at DCE imaging (time-resolved angiography with interleaved stochastic trajectories sequence, 3.6/1.3) 10 seconds after administration of contrast agent shows avid diffuse, early arterial enhancement throughout mass (arrows). Patient underwent radical resection of left distal thigh and medial knee synovial sarcoma. Histopathologic analysis of surgical specimen revealed minimal treatment-associated necrosis and sclerosis. (f) Histologic slide (magnification, ×40) stained with hematoxylin and eosin shows wholly viable, monotonous fibrous synovial sarcoma. Nearly every single tumor cell nucleus is viable. A few neoplastic nuclei are indicated with arrows. Both anatomic and functional MR imaging features support histopathologic findings of residual viable tumor with poor treatment response.
Figure 1e:
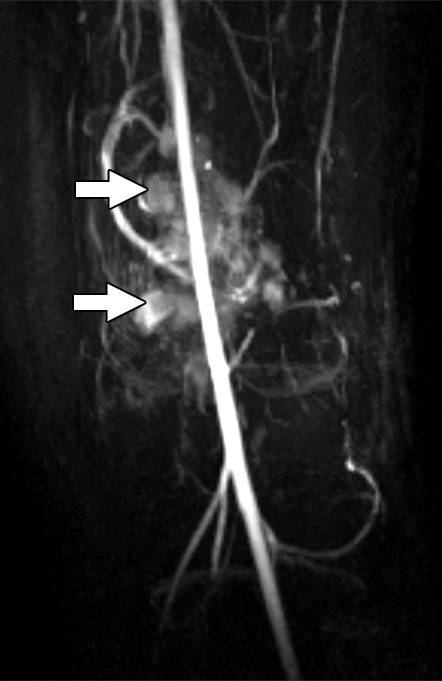
Images and photomicrograph in a 14-year-old boy with synovial sarcoma. Preoperative MR imaging was performed after neoadjuvant chemotherapy with ifosfamide and doxorubicin and radiation. (a) Axial fluid-sensitive fat-suppressed T2-weighted image (2191/59) shows heterogeneous hyperintense intra-articular mass (arrow) in suprapatellar pouch extending into medial thigh. (b) Axial T1-weighted (778/11) image shows heterogeneous mass (arrow) containing hyperintense components when compared with skeletal muscle. (c) Axial postcontrast fat-suppressed T1-weighted image (volumetric interpolated breath-hold examination, 6.35/1.64) shows enhancement throughout most of mass (arrow). (d) ADC map shows restricted diffusion throughout mass (arrow), with minimum ADC of 0.7 mm2/sec and mean ADC of 1.5 mm2/sec. (e) Coronal contrast-enhanced image obtained at DCE imaging (time-resolved angiography with interleaved stochastic trajectories sequence, 3.6/1.3) 10 seconds after administration of contrast agent shows avid diffuse, early arterial enhancement throughout mass (arrows). Patient underwent radical resection of left distal thigh and medial knee synovial sarcoma. Histopathologic analysis of surgical specimen revealed minimal treatment-associated necrosis and sclerosis. (f) Histologic slide (magnification, ×40) stained with hematoxylin and eosin shows wholly viable, monotonous fibrous synovial sarcoma. Nearly every single tumor cell nucleus is viable. A few neoplastic nuclei are indicated with arrows. Both anatomic and functional MR imaging features support histopathologic findings of residual viable tumor with poor treatment response.
Figure 1f:
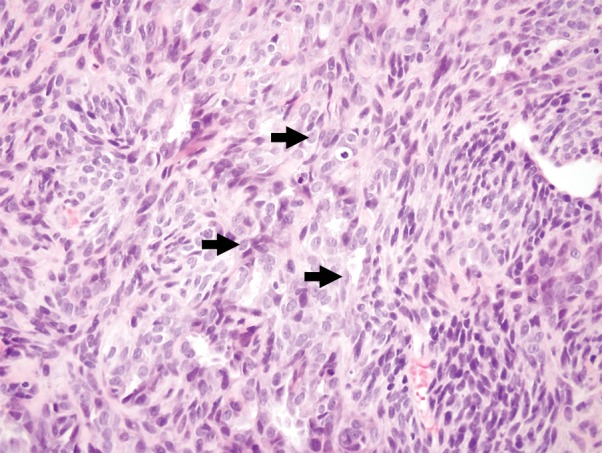
Images and photomicrograph in a 14-year-old boy with synovial sarcoma. Preoperative MR imaging was performed after neoadjuvant chemotherapy with ifosfamide and doxorubicin and radiation. (a) Axial fluid-sensitive fat-suppressed T2-weighted image (2191/59) shows heterogeneous hyperintense intra-articular mass (arrow) in suprapatellar pouch extending into medial thigh. (b) Axial T1-weighted (778/11) image shows heterogeneous mass (arrow) containing hyperintense components when compared with skeletal muscle. (c) Axial postcontrast fat-suppressed T1-weighted image (volumetric interpolated breath-hold examination, 6.35/1.64) shows enhancement throughout most of mass (arrow). (d) ADC map shows restricted diffusion throughout mass (arrow), with minimum ADC of 0.7 mm2/sec and mean ADC of 1.5 mm2/sec. (e) Coronal contrast-enhanced image obtained at DCE imaging (time-resolved angiography with interleaved stochastic trajectories sequence, 3.6/1.3) 10 seconds after administration of contrast agent shows avid diffuse, early arterial enhancement throughout mass (arrows). Patient underwent radical resection of left distal thigh and medial knee synovial sarcoma. Histopathologic analysis of surgical specimen revealed minimal treatment-associated necrosis and sclerosis. (f) Histologic slide (magnification, ×40) stained with hematoxylin and eosin shows wholly viable, monotonous fibrous synovial sarcoma. Nearly every single tumor cell nucleus is viable. A few neoplastic nuclei are indicated with arrows. Both anatomic and functional MR imaging features support histopathologic findings of residual viable tumor with poor treatment response.
Regarding image quality, all conventional and DCE MR imaging sequences were diagnostic (at conventional MR imaging 21 of 23 were grade 4 sarcomas, two of 23 were grade 3; at DCE MR imaging 14 of 18 were grade 4 and four of 18 were grade 3). Nineteen DWI sequences were diagnostic (10 of 22 were grade 4, nine of 22 were grade 3), and 3 were nondiagnostic (two of 22 were grade 2 and one of 22 was grade 1).
Table 2 is a summary of the imaging features determined in the consensus readings. Static postcontrast imaging offered high specificity (18 of 19 [94.7%]) but poor sensitivity (one of four [25%]) for determining good response to treatment, with false-negative results in three of four tumors with primarily granulation tissue or fibrosis response to treatment rather than necrosis (Fig 2). In the latter tumors, conventional MR imaging (showing 100% tumor enhancement) results were discordant with the histologic response, while DCE MR imaging (showing no arterial enhancement) and ADC maps (minimum ADC, 2.1 mm2/sec; average ADC, 2.5 mm2/sec) offered features that were concordant with a good response.
Table 2.
Accuracy of MR Imaging Features for Prediction of Treatment Response
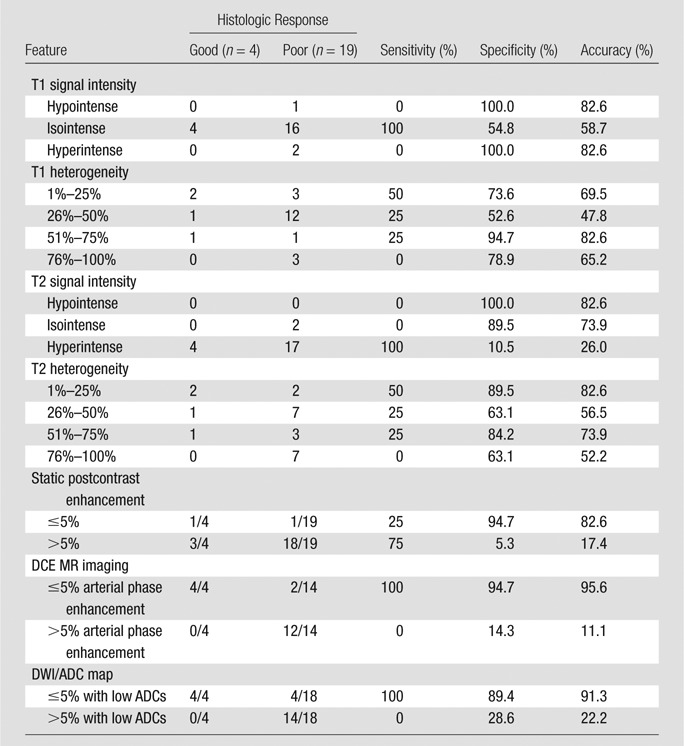
Note.—All features in this Table are reported on the basis of consensus readings. Sensitivity, specificity, and accuracy have been calculated with true-positive results defined as those with histologic response and true-negative results defined as those without response.
Figure 2a:
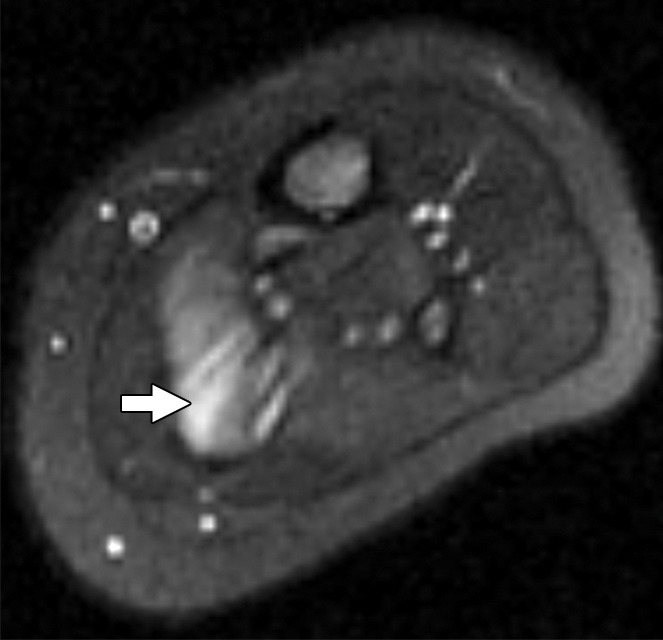
Images and photomicrograph in a 1-year-old boy with alveolar rhabdomyosarcoma. MR imaging was performed after neoadjuvant chemotherapy at an outside facility and radiation. (a) Axial fluid-sensitive fat-suppressed T2-weighted sequence (3879/69) shows hyperintense intramuscular residual mass (arrow) in left soleus. (b) Axial T1-weighted (566/8.9) image shows residual iso- to minimally hyperintense mass (arrow) adjacent to skeletal muscle. (c) Axial postcontrast T1-weighted image (volumetric interpolated breath-hold examination, 8.1/4.8) shows diffuse enhancement throughout most of mass (arrow). (d) ADC map shows lack of restricted diffusion throughout mass with minimum ADC of 1.3 × 10⁻³ mm2/sec and mean ADC of 1.3 × 10⁻³ mm2/sec. (e) Coronal contrast-enhanced image obtained with DCE MR imaging (time-resolved angiography with interleaved stochastic trajectories, 3.2/1.1) 10 seconds after administration of contrast agent shows lack of early arterial enhancement in medial calf. Patient underwent radical resection of left calf alveolar rhabdomyosarcoma. Histopathologic specimen revealed complete (100%) treatment-associated fibrosis with histiocytic response and calcification. (f) Histologic evaluation (magnification, ×20) hematoxylin and eosin–stained slide shows residual damaged skeletal myocytes (brightly eosinophilic rounded cells indicated by arrows), each encircled by fibrosis and a few nonneoplastic vessels, with no evidence of residual tumor. Although anatomic images including static postcontrast sequences suggest residual neoplasm, the lack of restricted diffusion and early enhancement supports histopathologic finding of good treatment response.
Figure 2b:
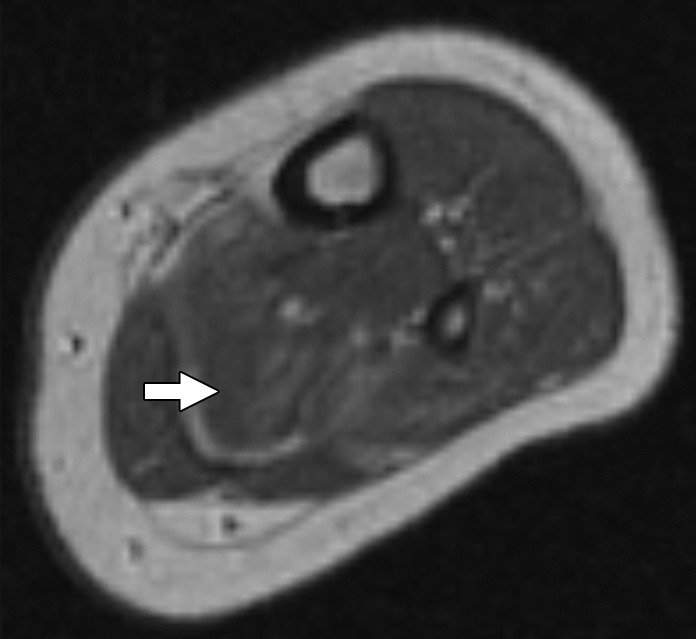
Images and photomicrograph in a 1-year-old boy with alveolar rhabdomyosarcoma. MR imaging was performed after neoadjuvant chemotherapy at an outside facility and radiation. (a) Axial fluid-sensitive fat-suppressed T2-weighted sequence (3879/69) shows hyperintense intramuscular residual mass (arrow) in left soleus. (b) Axial T1-weighted (566/8.9) image shows residual iso- to minimally hyperintense mass (arrow) adjacent to skeletal muscle. (c) Axial postcontrast T1-weighted image (volumetric interpolated breath-hold examination, 8.1/4.8) shows diffuse enhancement throughout most of mass (arrow). (d) ADC map shows lack of restricted diffusion throughout mass with minimum ADC of 1.3 × 10⁻³ mm2/sec and mean ADC of 1.3 × 10⁻³ mm2/sec. (e) Coronal contrast-enhanced image obtained with DCE MR imaging (time-resolved angiography with interleaved stochastic trajectories, 3.2/1.1) 10 seconds after administration of contrast agent shows lack of early arterial enhancement in medial calf. Patient underwent radical resection of left calf alveolar rhabdomyosarcoma. Histopathologic specimen revealed complete (100%) treatment-associated fibrosis with histiocytic response and calcification. (f) Histologic evaluation (magnification, ×20) hematoxylin and eosin–stained slide shows residual damaged skeletal myocytes (brightly eosinophilic rounded cells indicated by arrows), each encircled by fibrosis and a few nonneoplastic vessels, with no evidence of residual tumor. Although anatomic images including static postcontrast sequences suggest residual neoplasm, the lack of restricted diffusion and early enhancement supports histopathologic finding of good treatment response.
Figure 2c:
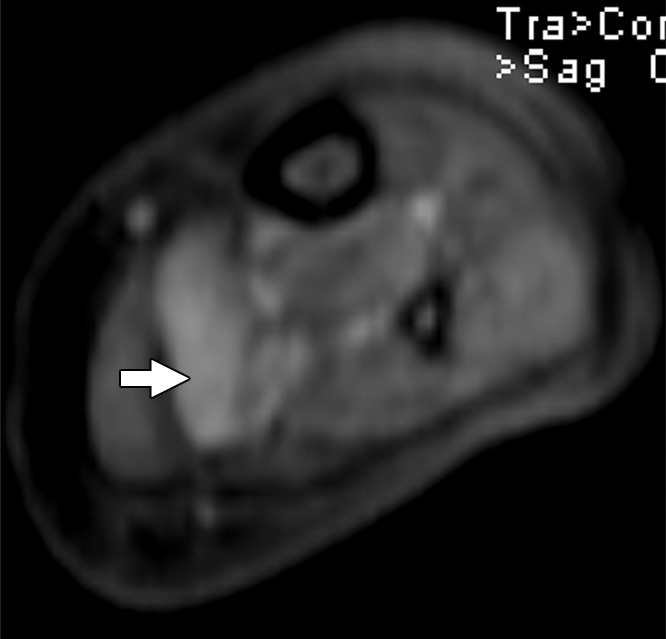
Images and photomicrograph in a 1-year-old boy with alveolar rhabdomyosarcoma. MR imaging was performed after neoadjuvant chemotherapy at an outside facility and radiation. (a) Axial fluid-sensitive fat-suppressed T2-weighted sequence (3879/69) shows hyperintense intramuscular residual mass (arrow) in left soleus. (b) Axial T1-weighted (566/8.9) image shows residual iso- to minimally hyperintense mass (arrow) adjacent to skeletal muscle. (c) Axial postcontrast T1-weighted image (volumetric interpolated breath-hold examination, 8.1/4.8) shows diffuse enhancement throughout most of mass (arrow). (d) ADC map shows lack of restricted diffusion throughout mass with minimum ADC of 1.3 × 10⁻³ mm2/sec and mean ADC of 1.3 × 10⁻³ mm2/sec. (e) Coronal contrast-enhanced image obtained with DCE MR imaging (time-resolved angiography with interleaved stochastic trajectories, 3.2/1.1) 10 seconds after administration of contrast agent shows lack of early arterial enhancement in medial calf. Patient underwent radical resection of left calf alveolar rhabdomyosarcoma. Histopathologic specimen revealed complete (100%) treatment-associated fibrosis with histiocytic response and calcification. (f) Histologic evaluation (magnification, ×20) hematoxylin and eosin–stained slide shows residual damaged skeletal myocytes (brightly eosinophilic rounded cells indicated by arrows), each encircled by fibrosis and a few nonneoplastic vessels, with no evidence of residual tumor. Although anatomic images including static postcontrast sequences suggest residual neoplasm, the lack of restricted diffusion and early enhancement supports histopathologic finding of good treatment response.
Figure 2d:
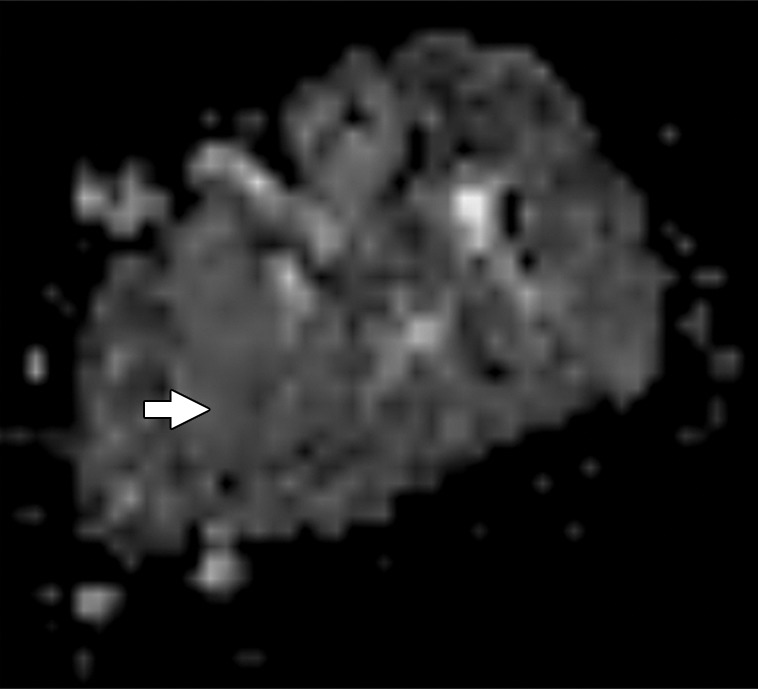
Images and photomicrograph in a 1-year-old boy with alveolar rhabdomyosarcoma. MR imaging was performed after neoadjuvant chemotherapy at an outside facility and radiation. (a) Axial fluid-sensitive fat-suppressed T2-weighted sequence (3879/69) shows hyperintense intramuscular residual mass (arrow) in left soleus. (b) Axial T1-weighted (566/8.9) image shows residual iso- to minimally hyperintense mass (arrow) adjacent to skeletal muscle. (c) Axial postcontrast T1-weighted image (volumetric interpolated breath-hold examination, 8.1/4.8) shows diffuse enhancement throughout most of mass (arrow). (d) ADC map shows lack of restricted diffusion throughout mass with minimum ADC of 1.3 × 10⁻³ mm2/sec and mean ADC of 1.3 × 10⁻³ mm2/sec. (e) Coronal contrast-enhanced image obtained with DCE MR imaging (time-resolved angiography with interleaved stochastic trajectories, 3.2/1.1) 10 seconds after administration of contrast agent shows lack of early arterial enhancement in medial calf. Patient underwent radical resection of left calf alveolar rhabdomyosarcoma. Histopathologic specimen revealed complete (100%) treatment-associated fibrosis with histiocytic response and calcification. (f) Histologic evaluation (magnification, ×20) hematoxylin and eosin–stained slide shows residual damaged skeletal myocytes (brightly eosinophilic rounded cells indicated by arrows), each encircled by fibrosis and a few nonneoplastic vessels, with no evidence of residual tumor. Although anatomic images including static postcontrast sequences suggest residual neoplasm, the lack of restricted diffusion and early enhancement supports histopathologic finding of good treatment response.
Figure 2e:
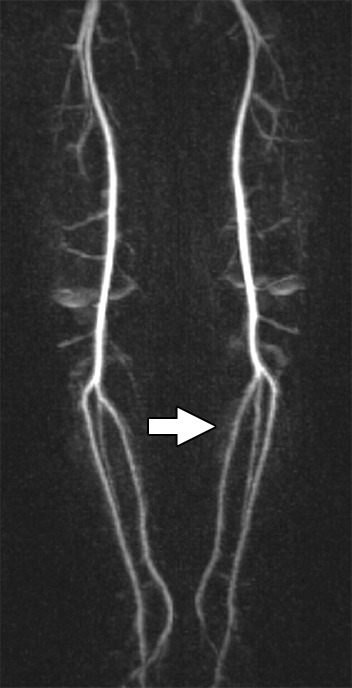
Images and photomicrograph in a 1-year-old boy with alveolar rhabdomyosarcoma. MR imaging was performed after neoadjuvant chemotherapy at an outside facility and radiation. (a) Axial fluid-sensitive fat-suppressed T2-weighted sequence (3879/69) shows hyperintense intramuscular residual mass (arrow) in left soleus. (b) Axial T1-weighted (566/8.9) image shows residual iso- to minimally hyperintense mass (arrow) adjacent to skeletal muscle. (c) Axial postcontrast T1-weighted image (volumetric interpolated breath-hold examination, 8.1/4.8) shows diffuse enhancement throughout most of mass (arrow). (d) ADC map shows lack of restricted diffusion throughout mass with minimum ADC of 1.3 × 10⁻³ mm2/sec and mean ADC of 1.3 × 10⁻³ mm2/sec. (e) Coronal contrast-enhanced image obtained with DCE MR imaging (time-resolved angiography with interleaved stochastic trajectories, 3.2/1.1) 10 seconds after administration of contrast agent shows lack of early arterial enhancement in medial calf. Patient underwent radical resection of left calf alveolar rhabdomyosarcoma. Histopathologic specimen revealed complete (100%) treatment-associated fibrosis with histiocytic response and calcification. (f) Histologic evaluation (magnification, ×20) hematoxylin and eosin–stained slide shows residual damaged skeletal myocytes (brightly eosinophilic rounded cells indicated by arrows), each encircled by fibrosis and a few nonneoplastic vessels, with no evidence of residual tumor. Although anatomic images including static postcontrast sequences suggest residual neoplasm, the lack of restricted diffusion and early enhancement supports histopathologic finding of good treatment response.
Figure 2f:
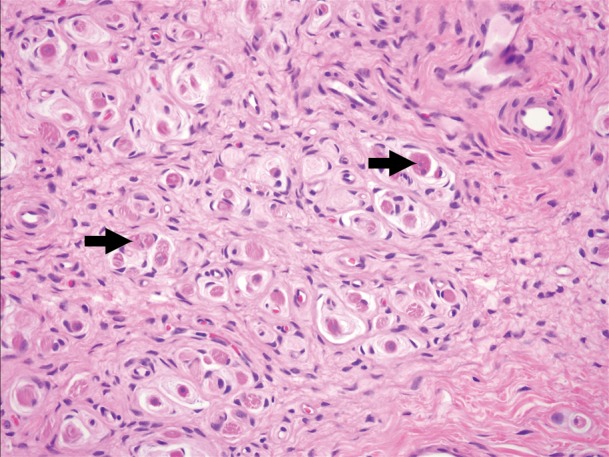
Images and photomicrograph in a 1-year-old boy with alveolar rhabdomyosarcoma. MR imaging was performed after neoadjuvant chemotherapy at an outside facility and radiation. (a) Axial fluid-sensitive fat-suppressed T2-weighted sequence (3879/69) shows hyperintense intramuscular residual mass (arrow) in left soleus. (b) Axial T1-weighted (566/8.9) image shows residual iso- to minimally hyperintense mass (arrow) adjacent to skeletal muscle. (c) Axial postcontrast T1-weighted image (volumetric interpolated breath-hold examination, 8.1/4.8) shows diffuse enhancement throughout most of mass (arrow). (d) ADC map shows lack of restricted diffusion throughout mass with minimum ADC of 1.3 × 10⁻³ mm2/sec and mean ADC of 1.3 × 10⁻³ mm2/sec. (e) Coronal contrast-enhanced image obtained with DCE MR imaging (time-resolved angiography with interleaved stochastic trajectories, 3.2/1.1) 10 seconds after administration of contrast agent shows lack of early arterial enhancement in medial calf. Patient underwent radical resection of left calf alveolar rhabdomyosarcoma. Histopathologic specimen revealed complete (100%) treatment-associated fibrosis with histiocytic response and calcification. (f) Histologic evaluation (magnification, ×20) hematoxylin and eosin–stained slide shows residual damaged skeletal myocytes (brightly eosinophilic rounded cells indicated by arrows), each encircled by fibrosis and a few nonneoplastic vessels, with no evidence of residual tumor. Although anatomic images including static postcontrast sequences suggest residual neoplasm, the lack of restricted diffusion and early enhancement supports histopathologic finding of good treatment response.
There was substantial to excellent agreement (k = 0.789–1.000) between the 2 readers regarding the assessment of qualitative tumor MR imaging characteristics. There was also substantial to excellent agreement regarding the evaluation of response at conventional MR imaging, DWI, and DCE imaging (k = 0.795, 0.840, and 0.773, respectively), and excellent agreement in the measurements of the ADCs (intraclass correlation coefficient, 0.8335; 95% confidence interval, 0.7729, 0.8791). On the basis of the receiver operating characteristic curves, a minimum ADC greater than 2.0 mm2/sec (sensitivity, 100%; specificity, 61.1%) or an average ADC greater than 2.2 mm2/sec (sensitivity, 50%; specificity, 77.8%) were identified as threshold values for determining good response.
The addition of DWI and DCE MR imaging to the conventional imaging protocol increased the accuracy with MR imaging for assessment of treatment response. This increase is reflected in the areas under the curves for (a) conventional imaging alone (b) conventional and DWI, and (c) conventional, DWI, and DCE MR imaging. The latter combination exhibited the best accuracy for both readers (Tables 3, 4; Figs 3, 4).
Table 3.
Accuracy of MR Imaging Features for Predicting Treatment Response

Note.—Data are areas under the curve, with 95% confidence intervals in parentheses.
Table 4.
Pairwise Comparison of the Receiver Operating Characteristic Curves
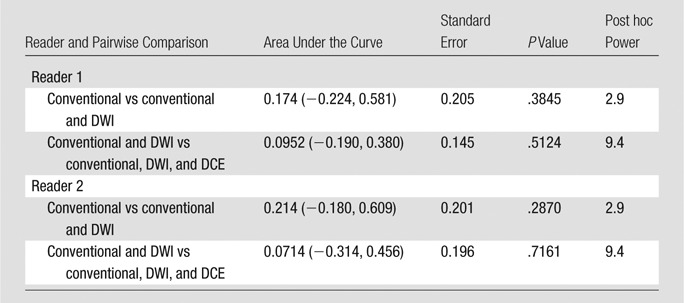
Note.—Data in parentheses are 95% confidence intervals.
Figure 3a:
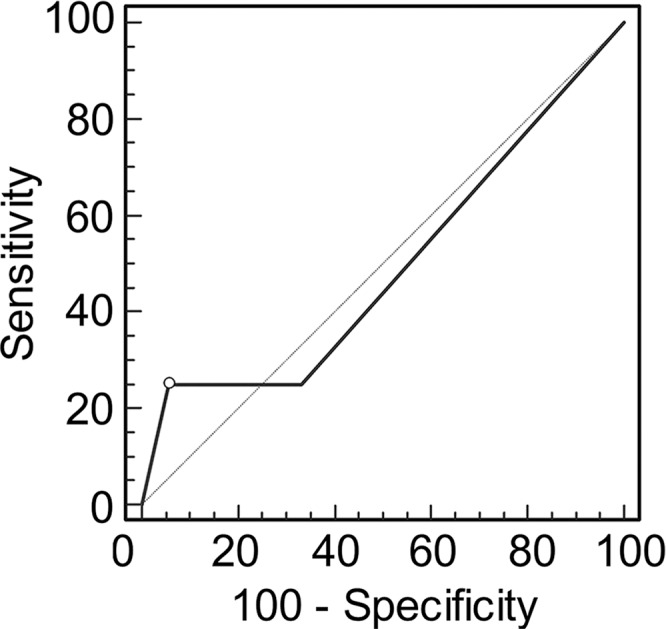
Graphs show receiver operating characteristic curve analysis of diagnostic performance of (a) conventional MR imaging, (b) conventional MR imaging combined with DWI, and (c) conventional MR imaging combined with DWI and DCE MR imaging for reader 1. Note the progressive increase in area under the curve (0.500 in a, 0.676 in b, 0.821 in c).
Figure 4a:
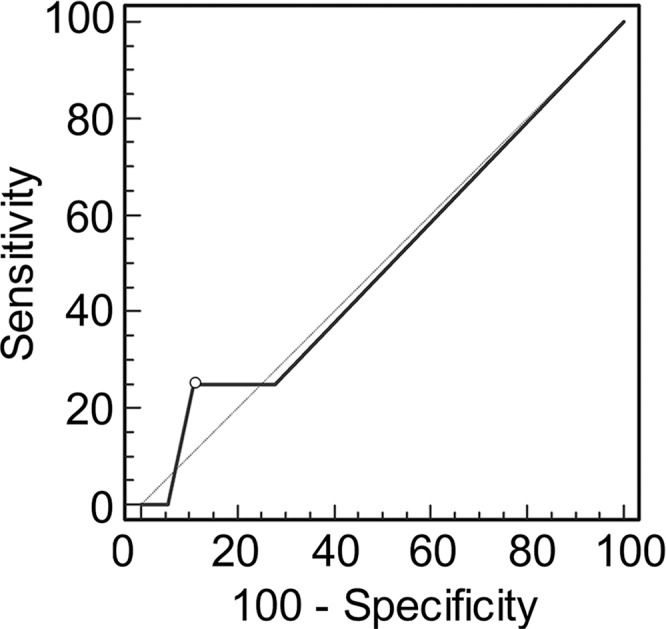
Graphs show receiver operating characteristic curve analysis of diagnostic performance of (a) conventional MR imaging, (b) conventional MR imaging combined with DWI, and (c) conventional MR imaging combined with DWI and DCE MR imaging for reader 2. Note again the progressive increase in area under the curve (0.506 in a, 0.704 in b, 0.833 in c).
Figure 3b:
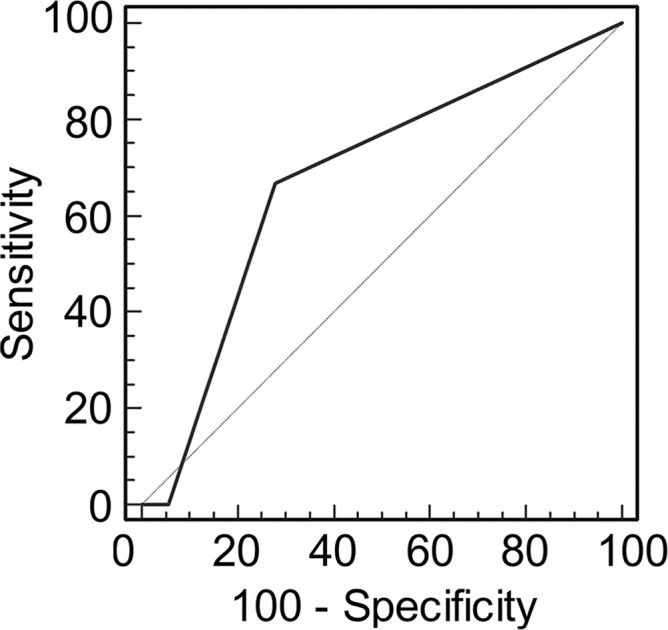
Graphs show receiver operating characteristic curve analysis of diagnostic performance of (a) conventional MR imaging, (b) conventional MR imaging combined with DWI, and (c) conventional MR imaging combined with DWI and DCE MR imaging for reader 1. Note the progressive increase in area under the curve (0.500 in a, 0.676 in b, 0.821 in c).
Figure 3c:
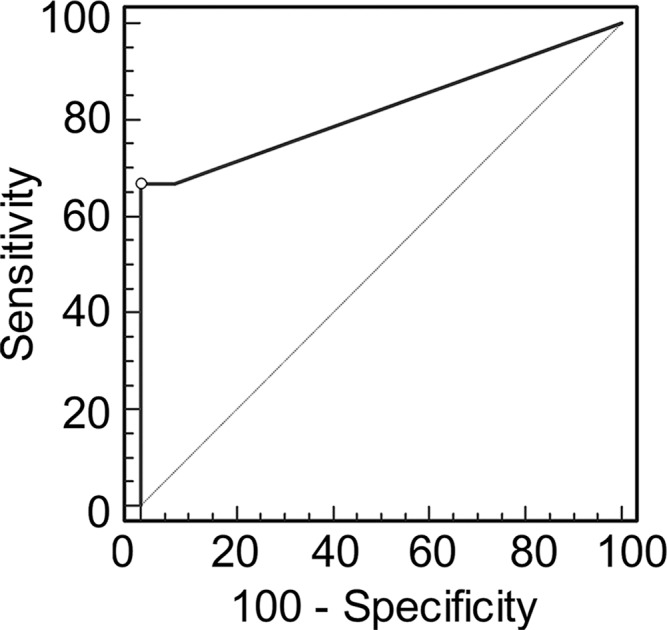
Graphs show receiver operating characteristic curve analysis of diagnostic performance of (a) conventional MR imaging, (b) conventional MR imaging combined with DWI, and (c) conventional MR imaging combined with DWI and DCE MR imaging for reader 1. Note the progressive increase in area under the curve (0.500 in a, 0.676 in b, 0.821 in c).
Figure 4b:
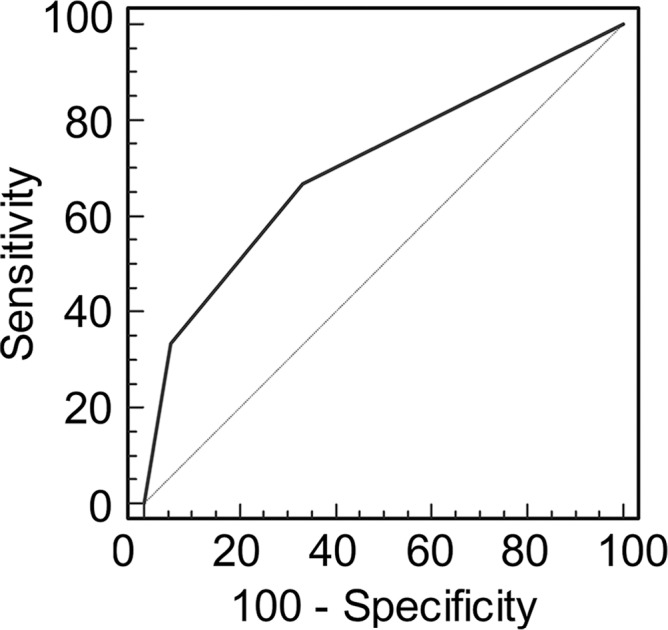
Graphs show receiver operating characteristic curve analysis of diagnostic performance of (a) conventional MR imaging, (b) conventional MR imaging combined with DWI, and (c) conventional MR imaging combined with DWI and DCE MR imaging for reader 2. Note again the progressive increase in area under the curve (0.506 in a, 0.704 in b, 0.833 in c).
Figure 4c:
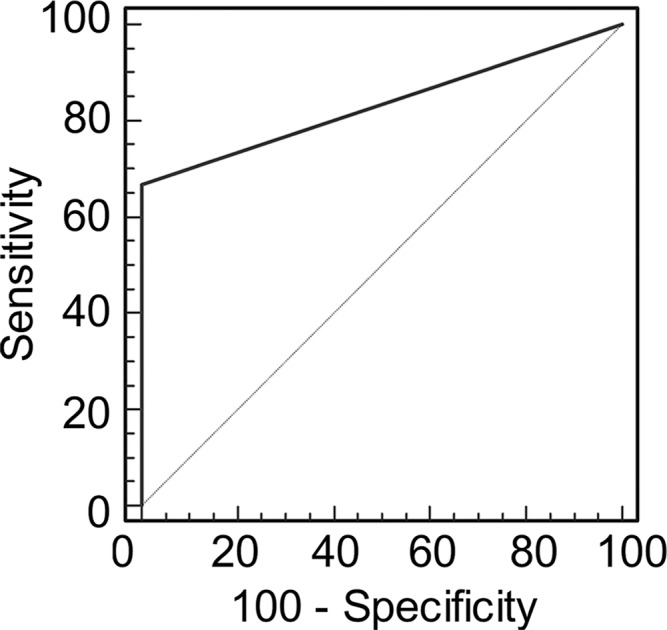
Graphs show receiver operating characteristic curve analysis of diagnostic performance of (a) conventional MR imaging, (b) conventional MR imaging combined with DWI, and (c) conventional MR imaging combined with DWI and DCE MR imaging for reader 2. Note again the progressive increase in area under the curve (0.506 in a, 0.704 in b, 0.833 in c).
Discussion
After neoadjuvant treatment in soft-tissue sarcomas, the percentage of treatment-related response is an important predictor of patient prognosis and is currently determined at histologic examination after surgical excision, rather than at preoperative imaging. Conventional MR imaging has been shown to have limited utility for definition of treatment response in soft-tissue sarcomas (20), although it can show tumor volume reduction from pretreatment imaging, as well as cystic regions presumed to be tumor necrosis (21,27,28). Our study results confirmed that conventional MR imaging with static postcontrast imaging has poor sensitivity when a tumor responds with treatment-related fibrosis and granulation tissue rather than with necrosis, while DCE MR imaging and ADC mapping both offer 100% sensitivity in this scenario. We also showed that functional MR imaging techniques enable assessment of treatment-related response with the use of the presurgical study alone and potentially offer an alternative to standard treatment-response criteria that measure changes in tumor size between the pretreatment and posttreatment images (Response Evaluation Criteria in Solid Tumors) (7).
Compared with the histopathologic examination, functional MR imaging sequences are noninvasive and are easily integrated into a routine presurgical examination. DCE MR imaging has been studied for the assessment of treatment response in patients with musculoskeletal tumors, but mainly in osteosarcomas (5,6,14), and to a lesser degree, in soft-tissue sarcoma (20–22) and experimental soft-tissue sarcoma models (17,29,30). In our study, DCE MR imaging increased the diagnostic accuracy of MR imaging compared with that at conventional imaging alone for assessment of the response of soft-tissue sarcomas to preoperative neoadjuvant therapy. Our results are in agreement with those of previous reports (20–23,29,30) in which DCE MR imaging was used to measure residual viable tumor after neoadjuvant treatment. However, authors of some of these studies included a small number of patients, as few as four (21) and 10 patients (22), and the percentage of nonviable tumor required to determine a good histologic response was not consistently reported as greater than or equal to 95%, with some studies accepting only 0% viable tumor to indicate response (22). In addition, some authors only measured necrosis rather than histologic response in the form of posttreatment fibrosis (25). In our study, DCE MR imaging proved to be an improvement to conventional static postcontrast imaging for establishing substantial treatment-related fibrosis and granulation tissue that can occur in soft-tissue sarcomas, although DCE imaging typically lacks spatial resolution and must be interpreted with the conventional MR imaging sequences, which have higher spatial resolution to display anatomic detail.
Several authors have shown the importance of DWI with ADC mapping to assess posttreatment response in osteosarcomas (14–16), but to our knowledge, few studies have reported its use in assessing response in soft-tissue sarcomas (17–19), although DWI has been used for detecting tumor recurrence and for characterizing soft-tissue tumors (19,27,31). Since changes at the cellular level are likely to occur before morphologic changes in tumor size occur, DWI is considered useful in detecting treatment response sooner than conventional imaging (18). DWI changes have been shown to correlate with alterations in tumor perfusion after neoadjuvant treatment, and ADCs are inversely related to tumor cellularity (17). Unlike DCE, DWI is a noncontrast technique and a potentially useful alternative for assessing response in patients with contraindications to the use of contrast material. Limitations of DWI include its relative decreased signal-to-noise ratio and spatial resolution compared with conventional imaging, and, as for DCE MR imaging, DWI with ADC mapping cannot be interpreted without concomitant conventional sequences. Also, in myxoid tumors, ADC map values are elevated to a range similar to that of benign tissue, resulting in potential pitfalls in determining response. Therefore, a multiparametric radiologic approach is needed, since it is unlikely that a single radiologic parameter alone can allow prediction of treatment response in tumors.
Our study had limitations. First, the sample size was relatively small, although prior studies on the use of DCE MR imaging or DWI in soft-tissue sarcomas have had small sample sizes. Also, the percentage of treatment responders was relatively small, at four of 23 (17%), but not dissimilar to those in other studies, such as in Canter et al (7) in which there were only two of 18 (11%) treatment responders. Therefore, we cannot exclude the possibility that the results would be different if the number of responders was larger, and that this study was suggestive, revealing a trend. Second, volumetric measurements and automated quantitative assessment of the tumors were not performed, because we intended to mimic a typical clinical interpretation session with semiquantitative analysis and visual inspection of the imaging. Third, not all imaging patients underwent both DWI and DCE imaging, and this limitation could have affected our results. In addition, our method of imaging interpretation was analogous to the pathologic assessment of response, in that the histologic percentage of viable tumor, necrosis, and sclerosis or granulation tissue was based on qualitative visual assessment, because quantitative histologic assessment is not currently available. A final limitation was that variables including age, sex, percentage of viable tumor, necrosis, and granulation tissue were not considered in the analysis of the diagnostic accuracy. Therefore, we cannot exclude the possibility that some of these variables may have confounded the predictive power of the modality. However, we presume that our sample size was too small to assess this potential issue.
In conclusion, the addition of functional MR sequences to the conventional MR protocol may increase the sensitivity of MR imaging for determining treatment response in soft-tissue sarcomas, particularly when the tumor forms granulation tissue and fibrosis rather than necrosis as a histologic response to treatment. Our study results also show the clinical utility of a single preoperative MR imaging examination to assess response, without comparison with imaging performed before neoadjuvant treatment. Future investigations should be focused on optimizing technical acquisition parameters for functional imaging, and investigators should consider a clinically viable volumetric analysis for complete characterization of tumoral tissue types.
Advances in Knowledge
■ The addition of functional sequences to the conventional MR imaging protocol for soft-tissue sarcomas that have been treated preoperatively with neoadjuvant therapy increases accuracy for determination of treatment response (area under the curve, 0.821–0.833 vs 0.500–0.506, respectively), particularly in tumors that form granulation tissue and fibrosis rather than necrosis as a histologic response to treatment.
■ Dynamic contrast-enhanced MR imaging and apparent diffusion coefficient (ADC) mapping are highly sensitive (100%) for assessment of the degree of nonviable tumor, and therefore, for determination of treatment response.
■ By using diffusion-weighted imaging, good treatment response can be determined if the minimum ADC is greater than 2.0 mm2/sec (100% sensitivity, 61.1% specificity) or the average ADC is greater than 2.2 mm2/sec (sensitivity, 50%; specificity, 77.8%).
Implication for Patient Care
■ Functional MR imaging may be used to improve the prediction of response to preoperative neoadjuvant therapy in patients with soft-tissue sarcoma.
Received October 23, 2014; revision requested December 16; revision received May 22, 2015; accepted May 27; final version accepted July 6.
L.M.F. supported by GERRAF, Siemens Medical Systems, SCBT/MR Young Investigator Award, Johns Hopkins Sarcoma Program Pilot Grant, and William M.G. Gatewood Fellowship.
Funding: This research was supported by the National Institutes of Health (grants 5P30CA06973 and U01CA140204).
Disclosures of Conflicts of Interest: T.S. disclosed no relevant relationships. S.A. disclosed no relevant relationships. E.M. disclosed no relevant relationships. M.C. disclosed no relevant relationships. M.A.J. disclosed no relevant relationships. L.M.F. Activities related to the present article: disclosed no relevant relationships. Activities not related to the present article: grants from Siemens Medical Systems. Other relationships: disclosed no relevant relationships.
Abbreviations:
- ADC
- apparent diffusion coefficient
- DCE
- dynamic contrast enhanced
- DWI
- diffusion-weighted imaging
References
- 1.Hohenberger P, Wysocki WM. Neoadjuvant treatment of locally advanced soft tissue sarcoma of the limbs: which treatment to choose? Oncologist 2008;13(2):175–186. [DOI] [PubMed] [Google Scholar]
- 2.Eilber FC, Rosen G, Eckardt J, et al. Treatment-induced pathologic necrosis: a predictor of local recurrence and survival in patients receiving neoadjuvant therapy for high-grade extremity soft tissue sarcomas. J Clin Oncol 2001;19(13):3203–3209. [DOI] [PubMed] [Google Scholar]
- 3.Roberge D, Skamene T, Nahal A, Turcotte RE, Powell T, Freeman C. Radiological and pathological response following pre-operative radiotherapy for soft-tissue sarcoma. Radiother Oncol 2010;97(3):404–407. [DOI] [PubMed] [Google Scholar]
- 4.Loeb DM. Targeted treatment in sarcoma patients. Clin Adv Hematol Oncol 2011;9(12):934–935. [PubMed] [Google Scholar]
- 5.Erlemann R, Sciuk J, Bosse A, et al. Response of osteosarcoma and Ewing sarcoma to preoperative chemotherapy: assessment with dynamic and static MR imaging and skeletal scintigraphy. Radiology 1990;175(3):791–796. [DOI] [PubMed] [Google Scholar]
- 6.Dyke JP, Panicek DM, Healey JH, et al. Osteogenic and Ewing sarcomas: estimation of necrotic fraction during induction chemotherapy with dynamic contrast-enhanced MR imaging. Radiology 2003;228(1):271–278. [DOI] [PubMed] [Google Scholar]
- 7.Canter RJ, Martinez SR, Tamurian RM, et al. Radiographic and histologic response to neoadjuvant radiotherapy in patients with soft tissue sarcoma. Ann Surg Oncol 2010;17(10):2578–2584. [DOI] [PMC free article] [PubMed] [Google Scholar]
- 8.Bozgeyik Z, Onur MR, Poyraz AK. The role of diffusion weighted magnetic resonance imaging in oncologic settings. Quant Imaging Med Surg 2013;3(5):269–278. [DOI] [PMC free article] [PubMed] [Google Scholar]
- 9.Gaeta M, Benedetto C, Minutoli F, et al. Use of diffusion-weighted, intravoxel incoherent motion, and dynamic contrast-enhanced MR imaging in the assessment of response to radiotherapy of lytic bone metastases from breast cancer. Acad Radiol 2014;21(10):1286–1293. [DOI] [PubMed] [Google Scholar]
- 10.Park JJ, Kim CK, Park SY, et al. Assessment of early response to concurrent chemoradiotherapy in cervical cancer: value of diffusion-weighted and dynamic contrast-enhanced MR imaging. Magn Reson Imaging 2014;32(8):993–1000. [DOI] [PubMed] [Google Scholar]
- 11.Sandrasegaran K. Functional MR imaging of the abdomen. Radiol Clin North Am 2014;52(4):883–903. [DOI] [PubMed] [Google Scholar]
- 12.Hötker AM, Garcia-Aguilar J, Gollub MJ. Multiparametric MRI of rectal cancer in the assessment of response to therapy: a systematic review. Dis Colon Rectum 2014;57(6):790–799. [DOI] [PubMed] [Google Scholar]
- 13.Chawla S, Kim S, Dougherty L, et al. Pretreatment diffusion-weighted and dynamic contrast-enhanced MRI for prediction of local treatment response in squamous cell carcinomas of the head and neck. AJR Am J Roentgenol 2013;200(1):35–43. [DOI] [PMC free article] [PubMed] [Google Scholar]
- 14.Uhl M, Saueressig U, van Buiren M, et al. Osteosarcoma: preliminary results of in vivo assessment of tumor necrosis after chemotherapy with diffusion- and perfusion-weighted magnetic resonance imaging. Invest Radiol 2006;41(8):618–623. [DOI] [PubMed] [Google Scholar]
- 15.Oka K, Yakushiji T, Sato H, Hirai T, Yamashita Y, Mizuta H. The value of diffusion-weighted imaging for monitoring the chemotherapeutic response of osteosarcoma: a comparison between average apparent diffusion coefficient and minimum apparent diffusion coefficient. Skeletal Radiol 2010;39(2):141–146. [DOI] [PubMed] [Google Scholar]
- 16.Wang CS, Du LJ, Si MJ, et al. Noninvasive assessment of response to neoadjuvant chemotherapy in osteosarcoma of long bones with diffusion-weighted imaging: an initial in vivo study. PLoS One 2013;8(8):e72679. [DOI] [PMC free article] [PubMed] [Google Scholar]
- 17.Thoeny HC, De Keyzer F, Vandecaveye V, et al. Effect of vascular targeting agent in rat tumor model: dynamic contrast-enhanced versus diffusion-weighted MR imaging. Radiology 2005;237(2):492–499. [DOI] [PubMed] [Google Scholar]
- 18.Dudeck O, Zeile M, Pink D, et al. Diffusion-weighted magnetic resonance imaging allows monitoring of anticancer treatment effects in patients with soft-tissue sarcomas. J Magn Reson Imaging 2008;27(5):1109–1113. [DOI] [PubMed] [Google Scholar]
- 19.Schnapauff D, Zeile M, Niederhagen MB, et al. Diffusion-weighted echo-planar magnetic resonance imaging for the assessment of tumor cellularity in patients with soft-tissue sarcomas. J Magn Reson Imaging 2009;29(6):1355–1359. [DOI] [PubMed] [Google Scholar]
- 20.Shapeero LG, Vanel D, Verstraete KL, Bloem JL. Fast magnetic resonance imaging with contrast for soft tissue sarcoma viability. Clin Orthop Relat Res 2002;(397):212–227. [DOI] [PubMed] [Google Scholar]
- 21.Fletcher BD, Hanna SL, Fairclough DL, Gronemeyer SA. Pediatric musculoskeletal tumors: use of dynamic, contrast-enhanced MR imaging to monitor response to chemotherapy. Radiology 1992;184(1):243–248. [DOI] [PubMed] [Google Scholar]
- 22.van Rijswijk CS, Geirnaerdt MJ, Hogendoorn PC, et al. Dynamic contrast-enhanced MR imaging in monitoring response to isolated limb perfusion in high-grade soft tissue sarcoma: initial results. Eur Radiol 2003;13(8):1849–1858. [DOI] [PubMed] [Google Scholar]
- 23.Meyer JM, Perlewitz KS, Hayden JB, et al. Phase I trial of preoperative chemoradiation plus sorafenib for high-risk extremity soft tissue sarcomas with dynamic contrast-enhanced MRI correlates. Clin Cancer Res 2013;19(24):6902–6911. [DOI] [PMC free article] [PubMed] [Google Scholar]
- 24.van Rijswijk CS, Hogendoorn PC, Taminiau AH, Bloem JL. Synovial sarcoma: dynamic contrast-enhanced MR imaging features. Skeletal Radiol 2001;30(1):25–30. [DOI] [PubMed] [Google Scholar]
- 25.Monsky WL, Jin B, Molloy C, et al. Semi-automated volumetric quantification of tumor necrosis in soft tissue sarcoma using contrast-enhanced MRI. Anticancer Res 2012;32(11):4951–4961. [PMC free article] [PubMed] [Google Scholar]
- 26.Fayad LM, Mugera C, Soldatos T, Flammang A, del Grande F. Technical innovation in dynamic contrast-enhanced magnetic resonance imaging of musculoskeletal tumors: an MR angiographic sequence using a sparse k-space sampling strategy. Skeletal Radiol 2013;42(7):993–1000. [DOI] [PubMed] [Google Scholar]
- 27.le Grange F, Cassoni AM, Seddon BM. Tumour volume changes following pre-operative radiotherapy in borderline resectable limb and trunk soft tissue sarcoma. Eur J Surg Oncol 2014;40(4):394–401. [DOI] [PubMed] [Google Scholar]
- 28.Baur A, Stäbler A, Wendtner CM, et al. MR-imaging changes of musculoskeletal soft-tissue sarcomas associated with neoadjuvant chemotherapy and hyperthermia. Int J Hyperthermia 2003;19(4):391–401. [DOI] [PubMed] [Google Scholar]
- 29.Viglianti BL, Lora-Michiels M, Poulson JM, et al. Dynamic contrast-enhanced magnetic resonance imaging as a predictor of clinical outcome in canine spontaneous soft tissue sarcomas treated with thermoradiotherapy. Clin Cancer Res 2009;15(15):4993–5001. [DOI] [PMC free article] [PubMed] [Google Scholar]
- 30.Preda A, Wielopolski PA, Ten Hagen TL, et al. Dynamic contrast-enhanced MRI using macromolecular contrast media for monitoring the response to isolated limb perfusion in experimental soft-tissue sarcomas. MAGMA 2004;17(3-6):296–302. [DOI] [PubMed] [Google Scholar]
- 31.Fayad LM, Blakeley J, Plotkin S, Widemann B, Jacobs MA. Whole body MRI at 3T with quantitative diffusion weighted imaging and contrast-enhanced sequences for the characterization of peripheral lesions in patients with neurofibromatosis type 2 and schwannomatosis. ISRN Radiol 2013;2013:627932. [DOI] [PMC free article] [PubMed] [Google Scholar]


