Abstract
Cationic gene delivery agents (vectors) are important for delivering nucleotides, but are also responsible for cytotoxicity. Cationic polymers (L-PEI, jetPEI, and G5 PAMAM) at 1x to 100x the concentrations required for translational activity (protein expression) induced the same increase in plasma membrane current of HEK 293A cells (30-50 nA) as measured by whole cell patch-clamp. This indicates saturation of the cell membrane by the cationic polymers. The increased currents induced by the polymers are not reversible for over 15 minutes. Irreversibility on this time scale is consistent with a polymer-supported pore or carpet model and indicates that the cell is unable to clear the polymer from the membrane. For polyplexes, although the charge concentration was the same (at N: P ration of 10:1), G5 PAMAM and jetPEI polyplexes induced a much larger current increase (40- 50 nA) than L-PEI polyplexes (< 20 nA). Both free cationic lipid and lipid polyplexes induced a lower increase in current than cationic polymers (< 20 nA). To quantify the membrane bound material, partition constants were measured for both free vectors and polyplexes into the HEK 293A cell membrane using a dye influx assay. The partition constants of free vectors increased with charge density of the vectors. Polyplex partition constants did not show such a trend. The long lasting cell plasma permeability induced by exposure to the polymer vectors or the polyplexes provides a plausible mechanism for the toxicity and inflammatory response induced by exposure to these materials.
Keywords: Gene delivery, gene therapy, whole cell patch clamp, polymer-cell membrane interactions, polymer-membrane partition, polyplex-membrane partition, stable pore model
Introduction
Nanoscale polymer/oligonucleotide complexes have been employed for the delivery of plasmid DNA (pDNA) into cells in order to alter protein expression.1–3 Cytotoxicity caused by cationic surface charge is a major concern regarding these polymer delivery vectors.4–7 In particular, the cationic nanomaterials interact with the cell membranes and nuclear membranes changing the membrane porosity and membrane potential, increasing intracellular calcium concentrations, and inducing inflammatory responses.6,8–12 These toxicity mechanisms present a challenge in gene delivery since the positive charge of gene delivery vectors is necessary to complex DNA effectively and thus protect against degradation by cellular enzymes. Moreover, the cationic charge of DNA-vector complexes (polyplexes) has been proposed to facilitate adsorptive endocytosis. Thus, understanding the mechanism of interaction of cationic vectors and nanoscale polyplexes with the cell membrane, and the influence of this interaction on gene expression, can enable the design of vectors that are both less cytotoxic and more effective gene delivery agents.
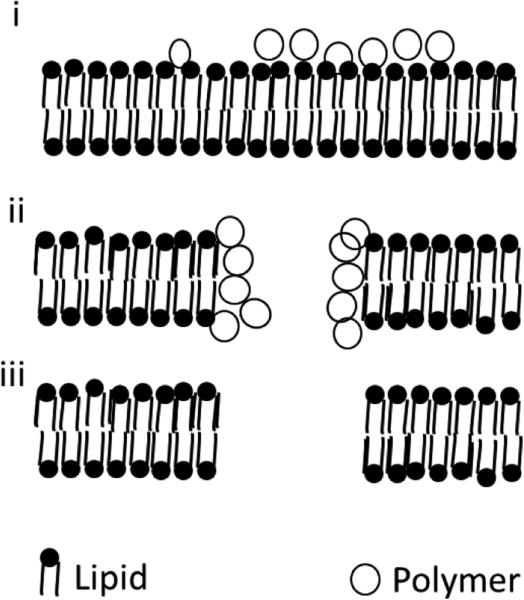
Several previous studies have characterized the nature of defects formed by the cationic nanomaterials in both model systems and in living cell membranes. 4,8,13–17 Computational methods have proposed several models for cationic polymer-induced cell membrane permeability, including the formation of free pores, polymer supported pores, and a carpet mechanism for cationic polymer induced cell membrane permeability (Figure 1).5,18–24 Atomic force microscopy (AFM) experiments on supported lipid bilayers have provided evidence for both free and polymer-supported pores formed by cationic nanoparticles.4,8,13,14,16,17 Although these studies provide a framework for understanding the cell membrane-cationic polymer interactions, the supported lipid bilayers have a much simpler lipid composition than living cell membranes. They are devoid of membrane proteins, cholesterol, and glycolipids. Building on these previous studies, manual whole cell patch clamp experiments in HEK 293A cells have shown that cationic polymers induce transient increases in current (0.1 to 10 sec) along with an overall increase in membrane conductivity that is consistent with 1-21 nm diameter pores or even larger carpeted regions.15 Recently, Heja et al. examined neurons present in brain slices and observed that the membrane permeability induced by generation five poly(amidoamine) (G5 PAMAM) dendrimers is not reversible over a time period of several minutes.25 This observation is consistent with either a supported pore or a carpet model for the cationic polymer-cell membrane interactions, but it is not consistent with an unsupported pore model since these are known to close on the order of 5 seconds.26 Although significant progress has been made in understanding the characteristics of the supported pores, it is unclear if the mechanism of pore formation changes based on nanoparticle concentration. In addition, most studies to date have used cationic polymer vectors and not the cation polymer/oligonucleotide vectors that are used in gene delivery applications. In a previous paper, we demonstrated that ~50-200 nm polyplexes consisting of both cationic vector and oligonucleotide induced changes in cell membrane conductivity.27 However, the polyplex-cell membrane interaction has not been studied in detail (e.g concentration dependence, partition constant etc). Both the shielding of charges by DNA in the polyplex and the relative dynamics of the cationic species and pDNA28 likely change as function of polycation vector structure. The impacts of concentration and complexation with nucleotides on membrane uptake and disruption are unknown. Moreover, despite the importance of the initial interaction with the cell membrane, quantitative studies to measure the uptake of cationic vectors and polyplexes into the cell membrane have not been performed and the equilibrium partition constants have not been obtained. Partition constants have been of great value for developing quantitative models of cell-detergent interactions and will aid in the development of quantitative models of other nanomaterial-cell membrane interactions.29–44
Figure 1.
Polymer intercalation can produce increased permeability by (i) the formation of a carpet mechanism where the polymer is intercalated randomly across the lipid membrane or (ii) through the formation of polymer supported pores or (iii) through the formation of free pores.
We previously used the Ionflux-16 (IF-16), an automated whole cell patch clamp instrument, and a trypan blue assay to characterize the partitioning of detergents in the cell membrane of HEK 293A cells42 and to measure increased membrane conductivity induced by polyplexes in HeLa cells.27 To investigate the mechanism of interaction of polymers and polyplexes with the cell membrane and to understand the role of these membrane interactions in gene transfection, we used the IF-16 and trypan blue assays to test hypotheses 1 and 2 generated from our previous work,13,15 as well as new hypothesis (3) regarding the relationship of vector charge density to partition constant.
H1: the magnitude of membrane current induced by cationic vectors increases with solution charge concentration
H2: the increased membrane current induced by the cationic vectors is reversible, thus supporting a free pore mechanism
H3: the partition constant is linearly related to the charge density of the vectors and polyplexes.
Our experiments show that
Contrary to H1, after a threshold concentration is reached, cationic polymers and polyplexes induce a saturated level of cell membrane conductivity over a wide concentration range. The magnitude of membrane conductivity changes and the time scales of polyplex interactions are similar to the conductivity changes induced by free polymers. This similarity suggests that the observed plasma membrane activity is based on the intercalation of the cationic vector alone. The combination of the polyplex and cationic polymer data indicates that in both cases, after an external threshold concentration is reached, the amount of cationic vector partitioned into the cell plasma membrane remains constant over the range of therapeutically relevant concentrations.
The vector-cell membrane interaction is stable for at least 15 minutes, which is consistent with two models: a carpet mechanism or the formation of polymer-supported pores (H2).
Extension of the trypan blue assay to the cationic vectors alone yielded quantitative partition constants for the vectors that increase as a function of charge density. Polyplexes made from the cationic vectors did not follow this trend (H3). In particular, polyplexes made using linear poly(ethyleneimine) (L-PEI), which had the highest charge density, showed a decrease in the membrane partition constant as compared to the free polymer.
The induction of long lasting membrane porosity provides a mechanism for the toxicity and may also be partially responsible for the inflammatory response previously reported after cells were exposed to cationic polymer vectors and polyplexes.8,12,13
Results and Discussion
Particle Size and Zeta Potential
Table 1 shows the measured zeta potentials of the free vectors (G5 PAMAM, L-PEI, jetPEI, and N-[1-(2,3-dioleoyloxy)propyl]-N,N,N-trimethylammonium methyl-sulfate (DOTAP)) and of the N:P 10:1 polyplexes, as well as the Z-averaged diameters of the polyplexes as measured by dynamic light scattering (DLS). Polyplexes made using L-PEI and jetPEI showed a decrease in zeta potential as compared to the free polymer whereas G5 PAMAM and DOTAP polyplexes had zeta potentials similar to that of free vectors. The polymer vectors gave polyplexes with diameters of 200-300 nm and the lipid DOTAP gave polyplexes with a diameter of 500-600 nm.
Table 1.
Z-averaged diameters of polyplexes (N:P=10) measured using dynamic light scattering; zeta-potentials of free vectors and polyplexes
| Material | Diameter (nm) | Zeta Potential (mV) |
|---|---|---|
| jetPEI | - | 40 ± 6 |
| jetPEI Polyplex | 212 ± 41* | 26 ± 3 |
| L-PEI | - | 39 ± 3 |
| L-PEI Polyplex | 210 ± 19* | 24 ± 1 |
| G5 PAMAM45 | 6.2 ± 0.2# | 32 ± 7 |
| G5 PAMAM Polyplex | 280 ± 42* | 36 ± 1 |
| DOTAP | - | 56 ± 2 |
| DOTAP Polyplex | 564 ± 54* | 53 ± 1 |
Z-average from light scattering
hydrodynamic diameter from diffusion NMR measurements
Concentration dependence of cell plasma membrane currents induced by free vectors and polyplexes
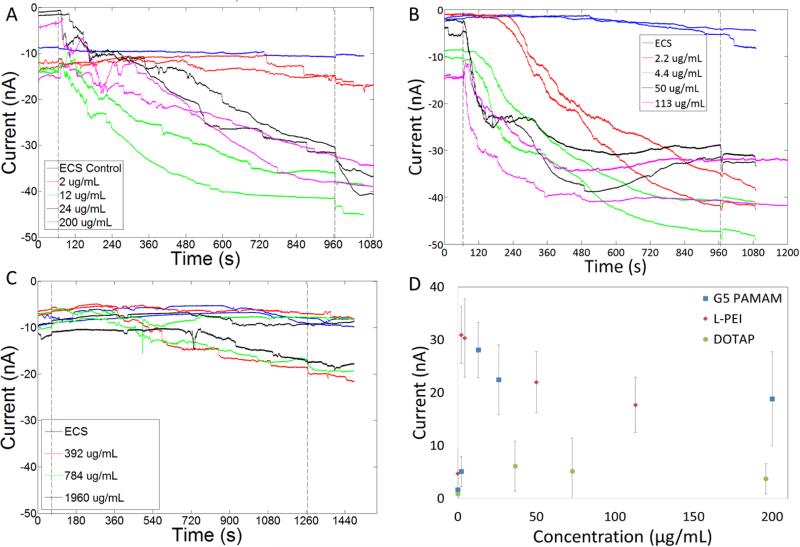
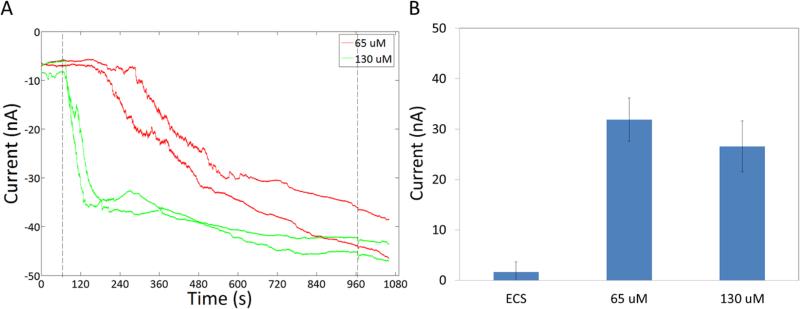
Currents induced by free polymers and N:P 10:1 polyplexes at a variety of concentrations are presented in Figures 2-7 and summarized in Table 2. Representative traces of induced currents for the vectors G5 PAMAM, L-PEI, and DOTAP are presented in Figure 2. The commercial transfection agent jetPEI can only be analyzed in terms of molar amine concentration since molar mass is not provided by the vendor, so this data is plotted separately in Figure 3. All three cationic polymers initiated changes in plasma membrane conductivity. As the concentration of cationic polymer to which the cells were exposed increased, an increase in membrane current was observed, which plateaued at ~ 30 – 40 nA. This plateau was independent of the cationic vector employed and was the maximum current observed over a wide range of concentrations. Exposure of the cells to two orders of magnitude greater concentrations of polymer did not induce a further increase in current. However, the time required to induce membrane currents did decrease as the concentration of polymer was increased. The 30 – 40 nA magnitude of the current plateau was significantly less than the open channel currents of 60-70 nA observed for the microfluidic device when cells were not present at the patch site.
Figure 2.
Membrane currents of cells exposed to G5-PAMAM (A), L-PEI (B) and DOTAP (C). As the concentration of cationic polymers increased the current induced did not change. Some cells exposed to DOTAP showed a small increase in current. Average increase in current induced by the different vectors are shown in D. In figures A-C, the first dotted line at 65 s indicates the release of the free cationic vectors resulting in exposure of these compounds to the cells. The second dotted line denotes the end of compound exposure.
Table 2.
Changes in membrane currents induced by polymers and polyplexes.
| Material | Δ Current (nA) ± St.Dev | Time for Current Increase (s) |
|---|---|---|
| ECS (Control) | 1.6 ± 2 | NA |
| Polymers | ||
| G5 PAMAM (~ 2.2 μg/mL) | 5 ± 3 | N/A |
| G5 PAMAM (~ 12 μg/mL)* | 33 ± 7 | 65 ± 60 |
| G5 PAMAM (~ 24 μg/mL) | 25 ± 7 | 20 ± 11 |
| G5 PAMAM (~ 48 μg/mL) | 18 ± 7 | 14 ± 2 |
| L-PEI (2.2 μg/mL)* | 31 ± 5 | 178 ± 50 |
| L-PEI (4.4 μg/mL) | 31 ± 2 | 40 ± 20 |
| L-PEI (50 μg/mL) | 22 ± 6 | 7 ± 2 |
| L-PEI (113 μg/mL) | 17 ± 5 | 6 ± 3 |
| jetPEI (65 μM)* | 32 ± 4 | 120 ± 56 |
| jetPEI (130 μM) | 27 ± 8 | 11 ± 3 |
| DOTAP (36.4 μg/mL)* | 6 ± 4 | N/A |
| DOTAP (73 μg/mL) | 5 ± 6 | N/A |
| DOTAP (196 μg/mL) | 4 ± 3 | N/A |
| Polyplexes | ||
| G5 PAMAM (N:P = 10) | 34 ± 14 | 245 ± 85 |
| G5 PAMAM (N:P = 20) | 38 ± 2 | 25 ± 18 |
| L-PEI Polyplexes (N:P = 10) | 9 ± 4 | 452 ± 89 |
| L-PEI Polyplexes (N:P = 18) | 38 ±5 | 82 ± 40 |
| L-PEI Polyplexes (N:P = 20) | 30 ± 7 | 20 ± 5 |
| jetPEI polyplexes(N:P = 5) | 5 ± 3 | N/A |
| jetPEI polyplexes(N:P = 10) | 36 ± 6 | 93 ± 55 |
| jetPEI polyplexes(N:P = 20) | 31± 4 | 10 ± 2 |
| DOTAP Polyplexes (N:P = 10) | 4 ± 5 | N/A |
Indicates that the cationic vector concentration is same as total cationic vector concentration present for N:P = 10 polyplexes with 0.8 μg DNA per well
Figure 3.
As the concentration of jetPEI dendrimers is increased the current induced does not change. A) Representative traces for cells treated with jetPEI. The first dotted line at 65 s indicates the release of the free jetPEI resulting in exposure of cells to jetPEI. The second dotted line denotes the end of jetPEI exposure. B) Average increase in current induced by the jetPEI at different concentrations.
By way of contrast to the cationic polymers, only ~50% of traces from cells exposed to the cationic lipid DOTAP resulted in an increase in membrane current. The current change in the sub-group with increased current was 10 ± 3 nA and had a rate of change of 0.016 ± 0.004 nA/ms. The magnitude of change in current is 1/3-1/2 of the current change induced by cationic polymers. The remaining traces, which showed an increase in current, had a current change of 1 ± 1 nA and exhibited an average rate of change of 0.004 ± 0.003 nA/ms, similar to that of the controls. A similar bifurcation of results was obtained when cells were exposed to a range of 39.2 μg/mL to 196 μg/mL DOTAP (corresponding to N:P=10:1 to N:P = 50:1) (Figure 2C). By comparing multiple experiments across multiple plates, we are able to rule out possible plate-based effects such as a systematic difference as a result of pattern location. Possible biological origins, such as capturing different representative populations of cells, also seems unlikely based on modeling of likely changes in current based on random trapping of different cell phenotypes (full details in supplementary materials). Therefore, the origin of this reproducible bifurcation in behavior remains unknown. The general conclusion can still be drawn, however, that the smaller increase in current for DOTAP as compared to the polymer vectors is consistent with the lipid structure, which has two fatty acid chains capable of stably integrating into the cell membrane and laterally diffusing instead of remaining localized to stabilize a membrane pore.
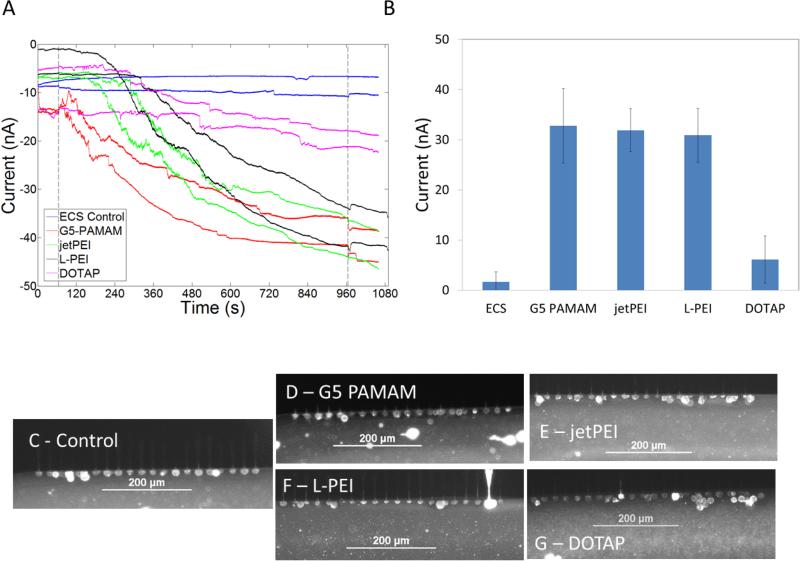
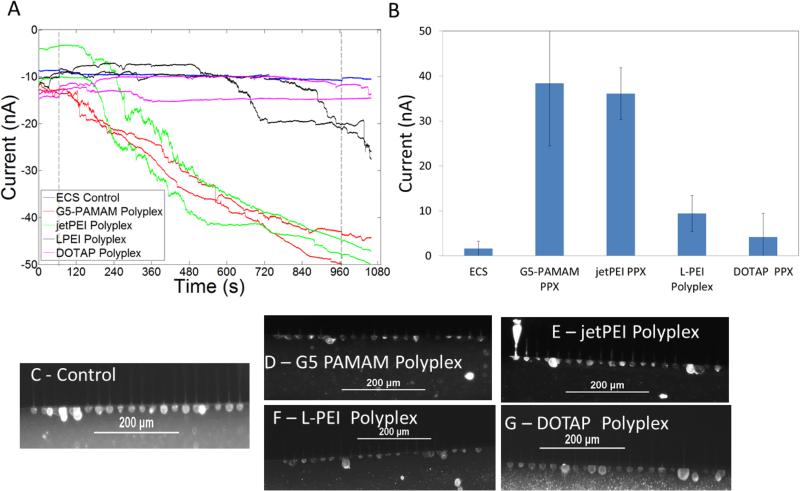
Representative traces of membrane currents of cells exposed to cationic gene delivery agents G5 PAMAM, L-PEI, jetPEI, and DOTAP at the total polymer concentrations used in for transfection12,15,27 are presented in Figure 4. The membrane current traces correspond to the polymer concentrations present when 0.8 μg of DNA in 500 μL of media is used to make polyplexes with N:P=10:1. Figure 5 illustrates traces of membrane currents of cells exposed to polyplexes with concentrations of polymers identical to those used in transfection studies and in Figure 4. G5 PAMAM polyplexes and jetPEI polyplexes induced an increase in current at N:P = 10:1 while L-PEI polyplexes required an N:P > 10:1 to induce an increase in current. The rate of current change seen in cells exposed to L-PEI polyplexes of N:P = 10 (0.02 nA/ms) was higher than the cell-only controls (0.004 ± 0.003 nA/ms). DOTAP polyplexes did not induce an increase in membrane current. The rate of current change after exposure to DOTAP was also not different from cell-only controls.
Figure 4.
Gene delivery agents G5 PAMAM, jetPEI , L-PEI, and DOTAP induce increased membrane currents. A) Representative traces for cells treated with the three polymers. Increased membrane current induced by G5 PAMAM (red) plateaus between 600 s – 740 s. Currents induced by jetPEI and L-PEI plateau at ~ 40 – 50 nA at higher concentrations. The first dotted line at 65 s indicates the release of the free cationic vectors resulting in exposure of these compounds to the cells. The second dotted line denotes the end of compound exposure. B) Average increase in current induced by the polymers. Cationic polymers jetPEI, LPEI and G5 PAMAM increase membrane permeability greater than DOTAP. C-E) Fluorescence images illustrating that cells exposed to the different gene delivery agents are intact after 900 s of exposure.
Figure 5.
Polyplexes made using G5 PAMAM and jetPEI (N:P = 10) in ECS induce increased membrane currents. A) Representative traces for cells treated with the polyplexes. The first dotted line at 65 s indicates the release of the polyplexes resulting in exposure of cells to polyplexes. The second dotted line denotes the end of polyplex exposure. B) Average increase in current induced by the polyplexes. C-E) Fluorescence images illustrating that cells exposed to polyplexes made using the different gene delivery agents are intact after 900 seconds of exposure.
The statistical significance of the changes in membrane conductivity was determined using one-way ANOVA followed by Tukey's multi-comparison test. The ANOVA indicated that the mean change in current was not equal between all the groups. Tukey's multi-comparison test indicated that the currents induced by jetPEI, jetPEI polyplexes, G5 PAMAM, G5 PAMAM polyplexes, and L-PEI were significantly different from the mean current change seen in the controls. Current changes induced by DOTAP polyplexes and L-PEI polyplexes were not significantly different from the controls. Approximately 50% of traces from cells treated using DOTAP showed an increase in membrane current (10 ± 3 nA), but this increase was much smaller than the increase in current observed from cells treated using the other cationic polymers.
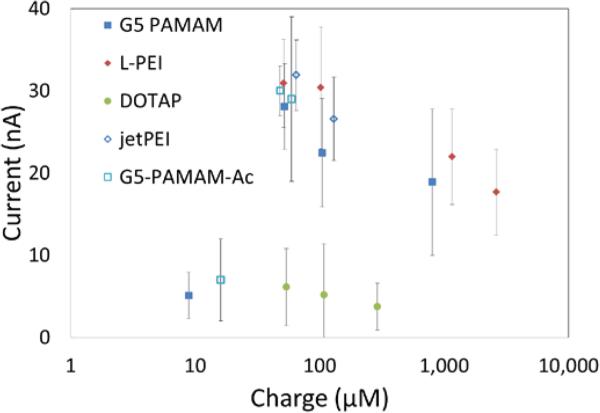
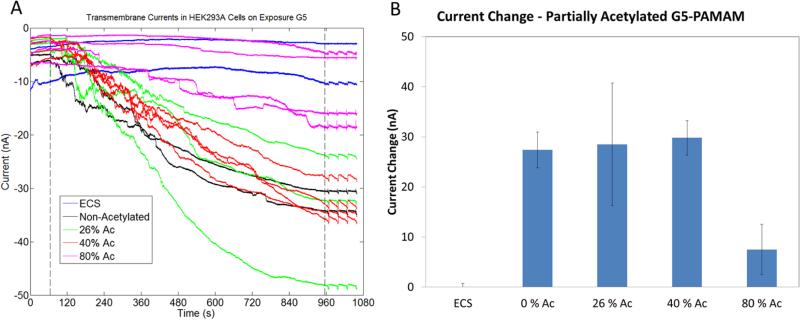
Although all cationic polymers induced increased membrane conductivity, they did so at different absolute concentrations. However, based upon the estimated charge concentrations for each polymer, the magnitude of current induced by the polymers was related to the total charge concentration in solution (Figure 6). In order to further confirm that if the increased conductivity induced by cationic polymers was dependent on charge, cells were treated with G5 PAMAM with different numbers of surface amine groups neutralized by acetylation (26%-80%). Changes in the membrane conductivity of cells were measured using the IF-16. Cells treated by G5 PAMAM with 80% acetylation showed a significantly smaller increase in membrane conductivity. Amine-terminated G5 PAMAM dendrimers acetylated to 26%, 40%, and 80% induced an increase in membrane currents of 29 ± 10, 30 ± 3 and 7 ± 5 nA, respectively (Figure 7). Thus, increasing levels of acetylation on G5 PAMAM reduced the membrane current induced by G5 PAMAM. Our observations indicate that the increase in porosity in the cell plasma membrane is related to the total cationic charge concentration, as previously reported.4–6,8 However, our measurements also demonstrate that membrane permeability approaches a plateau as concentration increases.
Figure 6.
Current induced by polymer at different charge concentrations is similar for the three cationic polymers. DOTAP induces much less current compared to the polymers.
Figure 7.
Cells exposed to G5 PAMAM acetylated to different levels. G5 PAMAM with 80% of the primary amines acetylated did not induce membrane permeability. A) The first dotted line at 65 s indicates the release of the G5 PAMAM resulting in exposure of cells to G5 PAMAM. The second dotted line denotes the end of G5 PAMAM exposure.
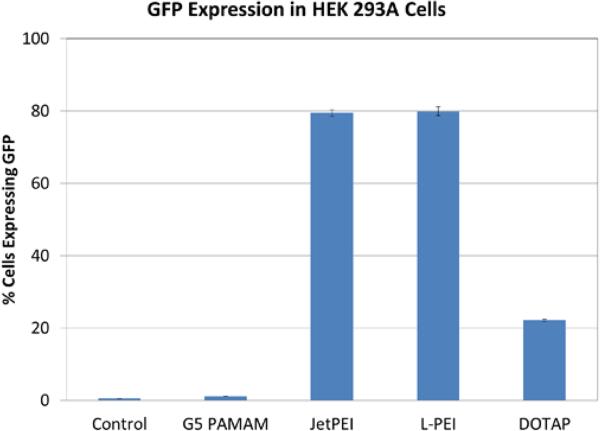
The ability of the different vectors to induce the expression of green fluorescent protein (GFP) in HEK 293A cells was also assessed. G5 PAMAM, jetPEI, L-PEI, and DOTAP induced GFP expression in <1%, 80%, 80%, and 21% of the cells, respectively (Figure 8). Figure S1 presents the membrane currents induced by the jetPEI, L-PEI, and G5 PAMAM polyplexes at N:P ratios other than 10:1. The jetPEI polyplexes with N:P ranging from 5:1 to 20:1 and L-PEI polyplexes with N:P ranging from 10-20:1 all induce GFP expression in greater than 80% of cells. However, increased currents are only induced by some polyplex formulations. For example, jetPEI polyplexes induce gene expression at N:P = 5:1, 10:1, and 20:1, but increased currents are observed only for N:P = 10:1 and 20:1. Similarly, G5 PAMAM polyplexes induce increased membrane currents but induce transfection in only ~ 1 % of cells. These results suggest that differences in transfection efficiency as a function of cationic vector are due to differences in transport subsequent to adsorptive endocytosis. We previously reached a similar conclusion in a study examining transfection efficiency and membrane conductivity in HeLa cells. The uptake of propidium iodide was measured after exposure of cells to polymer for 3 hours and whole cell patch clamp was employed to measure membrane permeability.27 With regard to these Ionflux™ patch-clamp studies, it should be noted that the cells in the patch clamp experiment were exposed to gene delivery agents and polyplexes/lipoplexes for only 15 minutes. For transfections, cells were exposed to polyplexes for 3 hours.
Figure 8.
Expression of GFP in HEK 293 A cells transfected using G5 PAMAM, jetPEI, L-PEI and DOTAP 24 h after transfection
Overall, the cationic polymers and their polyplexes induced increased membrane conductivity in HEK 293A cells. This is broadly consistent with the results of previous studies using manual patch clamp and fluorescence techniques, which indicated that cationic polymers and nanoparticles (metal and silica) induce increased membrane permeability to dyes, proteins and ions.4,6–8,13,15 Our experiments further show that beyond a threshold concentration, the exposure of cells to increasing concentrations of jetPEI, L-PEI, and G5 PAMAM results in a saturated membrane current of 30-50 nA over a broad concentration range. Thus, these results provide an important new perspective to the relationship between membrane conductivity and vector and/or polyplex charge concentration (H1). Specifically, the materials exhibit a saturation threshold over a broad concentration range prior to reaching concentrations capable of lysing the cell.
We have previously shown that the exposure of HEK 293A cells to the cationic detergents cetyl trimethylammonium bromide (CTAB) and octadecyl rhodamine B (ORB) result in a similar saturating current level.42 The microfluidic patch-clamp technique is capable of detecting solubilization of cells, such as by the anionic detergent sodium dodecyl sulfate (SDS). By way of contrast to the saturating currents, solubilization of cells by SDS resulted in open channel currents > 70 nA.42 Thus, the results indicate that the gene delivery polymers saturate the cell membrane over a broad concentration range but do not cause cell lysis.
Intactness of Cells Treated using Polymers and Vectors
Two experiments were employed to determine if the increase in membrane currents is caused by the dissolution of patched cells. In one experiment, patched cells treated with cationic vectors and polyplexes were exposed to a fluorescent detergent, ORB, for 10 s. As indicated in fluorescence micrographs of the patching regions (Figure 4 (C-G) and Figure 5 (C-G)), cells remained on all patching sites after 15 minutes of exposure independent of treatment condition. As an alternate approach, cells were treated using fluorescently labeled G5 PAMAM. Experiments using amine-terminated G5 PAMAM labeled with TAMRA dye resulted in increased current and showed that the cells were labeled by material after 10 minutes of exposure (Figure S2A). By way of contrast, TAMRA dye-labeled acetylated G5 PAMAM did not increase membrane currents and also did not stain cells (Figure S2B). These results are consistent with the smaller increase in currents observed in cells treated with partially acetylated G5 PAMAM dendrimers. The concentrations of cationic polymers contained in polyplexes with N:P = 10:1 and 20:1 have been optimized for transfection via LDH, XTT assays and do not induce cell lysis.8 Higher concentrations of cationic polymers show reduced cell viability when measured using LDH and XTT assays.
Currents Induced by Vectors are Not Reversible for Over 15 minutes
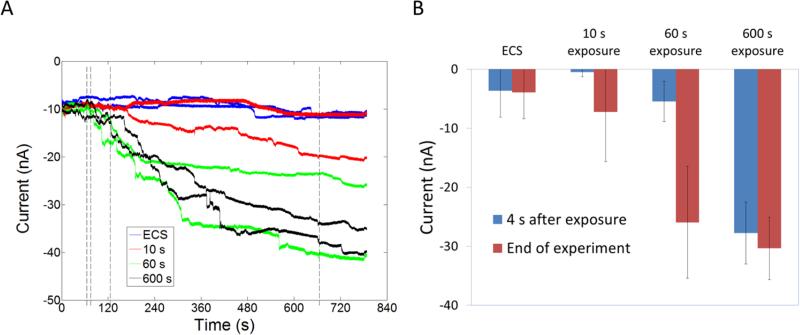
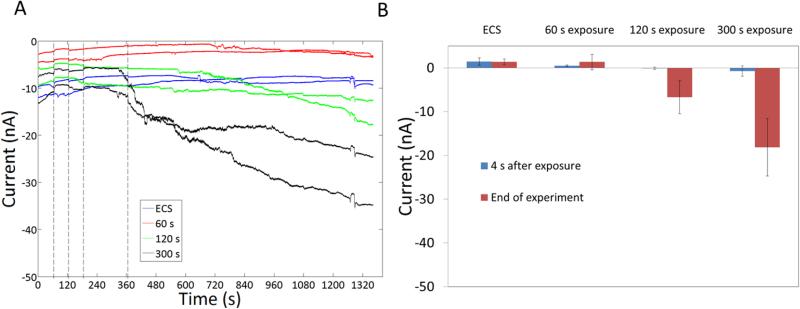
The experiments described so far, have shown that polymers and polyplexes saturate the cell membrane and induce an increase in membrane conductivity. Understanding if the interaction is reversible can enable us to understand if the intercalation results in transient pores or more stable structures such as a supported pore or carpet. Cells were exposed to free G5 PAMAM and L-PEI for short periods (10-600 s) and then allowed to recover in the presence of ECS alone. Unlike traditional patch-clamp methods where a substantial time-lag exists in changing solution concentration15 the microfluidic Ionflux™ flow system allows rapid exchange of solution with full exchange in <1 s. Exposure of cells to 20 μg/mL G5 PAMAM for 60 seconds increased membrane current by ~30 nA at the end of the experiment (600 seconds later) (Figure 9). Exposure of cells to L-PEI (2.2 μg/mL) required 300 seconds to induce membrane permeability. However, the permeability induced after 300 seconds is not reversible for up to 1100 seconds (Figure 10).
Figure 9.
Exposure of HEK 293 A cells to G5 PAMAM for 60 seconds induced increased membrane permeability that is not reversible for over 900 seconds. A) Representative current traces. The first dotted line indicates the release of G5 PAMAM at 65 s. Subsequent dotted lines indicate 10 s, 60 s and 600s from release of G5 PAMAM respectively when G5 PAMAM exposure was stopped and cells were exposed to ECS alone. B) The difference between currents at 65 s and subsequent time points.
Figure 10.
Exposure of HEK 293 A cells to L-PEI for 300 s causes increased membrane permeability that is then not reversible for over 900 s. A) Representative current traces. The first dotted line at 65 s indicates the release of L-PEI at 65 s. Subsequent dotted lines indicate 60 s, 120 s and 300s from release of L-PEI respectively when L-PEI exposure was stopped and cells were exposed to ECS alone. B) The difference between currents at 65 s and at different time points.
The increased membrane conductivities induced by both G5 PAMAM and L-PEI are not reversible for over 15 minutes. These results suggest that H2 is incorrect at least for G5 PAMAM and L-PEI in HEK 293A cells. A possible alternate explanation for the increased conductivity would be the lysing of a few of the 20 cells present at a given patch site. Such lysing would also result in an increased current that is not reversible. The increased membrane currents could be caused by either the lysing of a small fraction of the cells present in a trapping zone or by an increase in membrane conductivity of intact cells present in the trap zone. Figure 4C-G and Figure 5C-G show cells stained with a fluorescent detergent ORB for 10 s at the end of experiments where cells had been exposed to polymers for 900 seconds. It is seen that the cells are intact in all of these cases. Thus, increase membrane current is due to the increased membrane conductivity induced by polymers and not due to the lysing of a subset of the 20 trapped cells.
Heja et al. showed that the membrane conductivity of neurons in brain slices of rats increased irreversibly after exposure to G5 PAMAM, consistent with supported pore or carpet models.25 By way of contrast, increases in membrane currents caused by unsupported pores induced by sonoporation have been shown to be reversible on the timescale of only 5 seconds.26 Our experiments extend their results to other polymers and also cultured mammalian cells. Our results reported here are also consistent with the formation of supported pores or a carpet mechanism, as opposed to an unsupported pore. One factor that could possibly confound the IonFlux-16 reversibility experiment is the adsorption of polymers in the walls of the microfluidic channel during the 10-300 second exposure and subsequent release when cells are exposed to ECS alone (Figure 9 and Figure 10). To address this concern, we modeled the exponential release of polymer from a monolayer adsorbed on the channel wall between the compound release site and the trap site where cells are located. Results presented in Figure S3 show that the cells are exposed to G5 PAMAM and L-PEI at concentrations that are 50 and 12 times lower, respectively, than the concentrations necessary to induce membrane permeability.
Several studies have shown that calcium ions, dyes such as propidium iodide and large proteins such as LDH leak from cells in the presence of cationic vectors.6,8,13,47,48 The prolonged presence of cationic polymers on the cell membrane may explain the influx of such molecules, dyes and proteins. Cationic polymers and nanoparticles have been shown to induce changes in the mitochondrial outer membrane potential and induce the release of mitochondrial proteins such as cytochrome c.9 In the case of linear and branched PEI, it has been suggested that the mitochondrial membrane damage is due to the formation of channels in the mitochondria.9 The transfer by lipid cycling of stable pores from the plasma membrane may provide a mechanism for the mitochondrial membrane damage induced by these materials.
Measurement of Partition Constants for G5 PAMAM, L-PEI, DOTAP and their Polyplexes
The experiments using IF-16 showed that cationic polymers and polyplexes saturate the cell plasma membrane and remain in the membrane for greater than 15 minutes. However, they did not provide any information on the relative amounts of the polymers and polyplexes partitioned in the membrane. To probe this question we employed a trypan blue assay and previously reported partition models to quantify the partition constants of the cationic material (free L-PEI, G5 PAMAM, DOTAP and their respective polyplexes) bound to the cell membrane.29–32,42 Briefly, the total polymer concentration (PT) at a given level of cell membrane perturbation is linearly related to the total lipid concentration (L) as described in equation 1. In equation 1, Rb is the ratio of polymer to lipid in the cell membrane and Pw is the polymer partitioned into the water phase. The partition constant K can be calculated using equation 2. The detailed mathematical model29–32 describing equations 1 and 2 is provided in the supplementary material. Table 3 presents the partition constants and related parameters for the L-PEI, G5 PAMAM, DOTAP and their polyplexes.
| (1) |
| (2) |
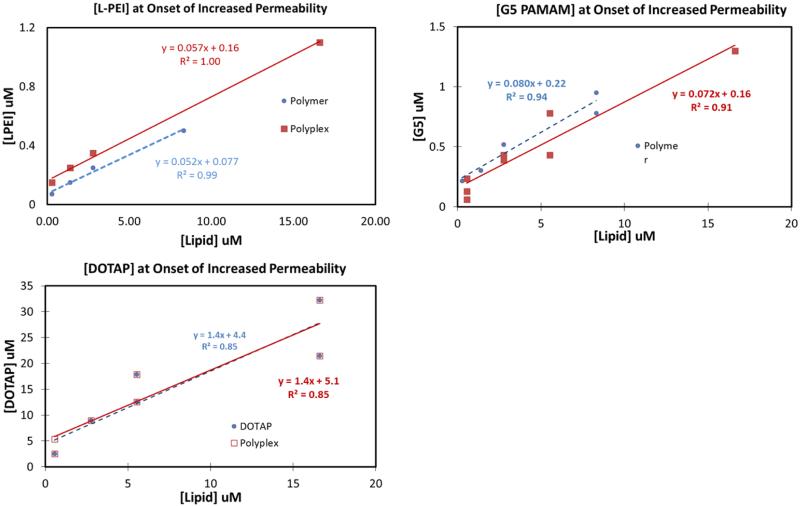
Figure 11 shows the linear models used to calculate the partition constants for the polymers and polyplexes. The percentages of cells that were trypan blue positive when treated with varying concentrations of cationic vectors and polyplexes are shown in Figures S4-S6. The vector/polyplex concentration necessary to induce trypan blue permeability increases as the cell count increases in all cases as shown in Figure 11. Figure S4 also shows the L-PEI concentration necessary to induce trypan blue permeability is greater for polyplexes than for free polymer. The lower partition constant for polyplexes as compared to the free polymer indicates that polyplexes do not intercalate into the membrane to the same degree as free polymer at the same polymer concentration. The partition constants of G5 PAMAM polyplexes and DOTAP polyplexes were not significantly different from the partition constant of the free G5 PAMAM and free DOTAP respectively.
Table 3.
Estimates for Rb and K for L-PEI, L-PEI Polyplexes, G5 PAMAM, and G5 PAMAM Polyplexes
| Material | Line eqn. | R2 | Rb | Pw | K (M−1) |
|---|---|---|---|---|---|
| LPEI | y = 0.057x + 0.077 | 0.99 | 0.057 ± 0.002 | 0.077 ± 0.011 | 600,000 [510000,720000] |
| LPEI PPX | y = 0.052x + 0.16 | 0.92 | 0.052 ± 0.001 | 0.16 ± 0.01 | 330,000 [310000, 360000] |
| G5 | y = 0.080x + 0.22 | 0.97 | 0.080 ± 0.008 | 0.22 ± 0.04 | 370,000 [290000, 510000] |
| G5 PPX | y = 0.072x + 0.16 | 0.96 | 0.072 ± 0.009 | 0.16 ± 0.06 | 410,000 [270000, 810000] |
| DOTAP | y = 1.4x + 4.6 | 0.85 | 1.4 ± 0.2 | 4.6 ± 2.2 | 140,000 [86000,310000] |
| DOTAP PPX | y = 1.4x + 5.1 | 0.85 | 1.4 ± 0.2 | 5.1 ± 2.2 | 120,000 [78000,230000] |
Figure 11.
Onset of increased trypan blue permeability induced by L-PEI, G5 PAMAM, and DOTAP and their polyplexes as a function of lipid concentrations. It is seen that L-PEI polyplexes induce increased permeability at higher concentrations than the free polymer. Such an observation was true for G5 PAMAM polyplexes only in some trials.
The calculated partition constant for L-PEI is higher than the partition constant for G5 PAMAM, which is in turn higher than the partition constant of DOTAP. This observation is consistent with the higher charge density on L-PEI as compared to G5 PAMAM and DOTAP. Thus, the results are consistent with H3 for free cationic polymers. The partition constants of polyplexes do not exhibit this trend. The partition constant for L-PEI polyplexes is lower than the partition constants of free L-PEI. However, the partition constants for DOTAP polyplexes and G5 PAMAM polyplexes were similar to the partition constant for their respective free polymers. Interestingly, the observation that L-PEI polymer and polyplexes behave differently than DOTAP and G5 PAMAM is also consistent with the observations from the patch clamp experiments. L-PEI polyplexes did not induce current at N:P=10:1 but an equivalent concentration of free L-PEI induced increased current. In contrast, G5 PAMAM polyplexes at N:P=10:1 and an equivalent concentration of free G5 PAMAM both induced increased currents. This means the L-PEI polyplexes at N:P=10:1 had a lower surface charge than G5 PAMAM polyplexes at N:P=10:1 even though the bulk positive to negative charge ratios were the same. Both the trypan blue assay and the IonFlux experiments suggest that charge shielding by DNA was stronger for L-PEI polyplexes than G5 PAMAM polyplexes. Indeed, jetPEI polyplexes and L-PEI polyplexes both exhibited a decrease of about 15 mV in zeta potential compared to the free polymers, but the G5 PAMAM polyplexes and DOTAP polyplexes did not show such a decrease (Table 1). Therefore, the observed differences in partition constants between polyplexes made using L-PEI and G5 PAMAM are consistent with the zeta potentials. Our group previously investigated the G5 PAMAM-DNA interaction using NMR and showed it to be highly dynamic, consisting of rigid DNA and mobile dendrimer.28 This may be the reason why the G5 PAMAM polyplexes have a similar zeta potential as the free G5 PAMAM. Similar NMR studies using L-PEI polyplexes may help determine if the DNA-polymer interactions are different in those polyplexes. Further biological studies are necessary to determine if the differences in DNA-polymer interactions seen in L-PEI and jetPEI induce better gene expression as a result of protecting DNA from degradation, by aiding its transport to the nucleus through some other mechanism, or perhaps combination of both mechanisms.
The results of this study are most directly relevant to cell transfections carried out in serum-free media. These conditions are typically employed because they optimize pDNA transfection and protein expression when employing polycationic vectors. Additional studies are needed to better understand the polyplex/membrane interactions under in vivo conditions such as the vitreous humor of the eye and intramuscular and subcutaneous tissue.
Conclusions
We studied the mechanism of interaction of cationic vectors and polyplexes with the cell membrane with the aim of developing less toxic and more effective gene delivery agents. We determined that cationic polymers and polyplexes exhibit a threshold behavior with respect to both uptake into the cell plasma membrane and induction of cell membrane conductivity over a wide concentration range (H1). Moreover, the persistence of the induced membrane current upon the removal of the cationic vectors and polyplexes indicates that the cell is unable to clear the polymer from the plasma membrane. These observations suggest that the polymers and polyplexes intercalate into the membrane and form a stabilized pore or carpet structure (H2). To quantify the amount of material bound to cells, we extended the methods used to quantify membrane partitioning of detergents to cationic polymers and polyplexes. Our results showed that free cationic vectors with a relatively higher charge density also exhibit a larger partition constant (H3), but this trend was not observed in the case of polyplexes. The induction of long lasting cell membrane porosity characterized in this paper provides a mechanism for the toxicity and the induction of inflammatory pathways observed in cells upon exposure to cationic gene delivery vectors.6,9,12
Experimental Methods
Materials: G5 PAMAM dendrimers were obtained from Dendritech, Inc. jetPEI and L-PEI were obtained from Polysciences, Inc. DMEM High Glucose with Sodium Pyruvate and Glutamine (Life technologies) was the base media. Complete media was made by adding 50 mL of fetal bovine serum, 5 mL of Non-essential Amino Acids (Thermo Scientific) and 5 mL of penicillin-streptomycin to 500 mL DMEM. Serum Free Media (SFM-II) for suspension culture of HEK 293A cells, PBS (1X) without Ca2+ and Mg2+, and Octadecyl Rhodamine B (ORB) were purchased from (Life technologies). Detachin was purchased from Genlantis, Inc. Other reagents were obtained from Fisher Scientific unless otherwise specified. Amine-terminated and acetylated G5 PAMAM dendrimer containing one TAMRA dye per dendrimer (G5-NH2-TAMRA1 and G5-Ac-TAMRA1) were prepared according to literature methods.49,50
Solutions: Extracellular solution (ECS) consisted of 138 mM NaCl, 4 mM KCl, 1.8 mM CaCl2, 1 mM MgCl2, 10 mM HEPES and 5.6 mM glucose adjusted to pH 7.45 using NaOH. Intracellular solution (ICS) consisted of 100 mM potassium aspartate, 30 mM KCl, 5 mM MgCl2, 5 mM EGTA, 4mM Tris ATP, and 10 mM HEPES adjusted to pH 7.2 using KOH.
Estimation of charge concentrations: The charge concentrations for G5 PAMAM were obtained using potentiometric titration with NaOH as described by Mullen et al.46 We assumed a concentration of 7.5 mM charged amines for jetPEI as instructed by the manufacturer. For L-PEI, we used the average number of amines in a 25 kDa polymer to estimate the charge concentration. We assumed that all of the DOTAP tertiary amine groups were charged.
Polyplexes for Gene Expression Study and Patch Clamp: Polyplexes containing 0.8 μg DNA with N:P ratio of 10 were made by adding equal volumes of polymer to DNA in water. Here, N and P represent the cationic amine groups in the vector and the anionic phosphate groups in the DNA, respectively. At N:P = 10:1, polyplexes are positively charged. The mixture of polymer and DNA was allowed to incubate for 20 minutes. For studying GFP expression, 50 μL of polyplex solution was added to 80,000 cells plated in 450 μL of serum free DMEM. For patch clamp experiments, 50 μL of polyplex solution was added to 450 μL of ECS.
Whole-Cell Patch Clamp using IonFlux 16: The IonFlux 16 (IF-16) patch clamp instrument is capable of simultaneously trapping 20 cells in 16 trapping zones.51 Electrical properties of each group of 20 cells are measured with dedicated amplifiers. The ensemble of cells is located in eight independently controllable microfluidic environments. Thus, the cells in two different trapping zones experience the same microfluidic environment. This allowed for simultaneous measurement of the changes in cell membrane conductivity in response to interactions with different polymer and polyplex materials.
The methods for the whole cell patch operation and cell preparation have been previously described in detail.20 Briefly, HEK 293A cells were cultured in 175 cm2 flasks in complete medium at 37 °C and 5% CO2. Cells were cultured to ~95% confluency (~20-25 million cells). The cells were suspended by treatment with 5 mL of Detachin at 37 °C for 5 minutes, after which 5 mL of complete media was added. The cell suspension was centrifuged for 2 minutes at 1,000 rpm and resuspended in 9.6 mL SFM-II and 0.4 mL 1 M HEPES for suspension culture. The suspension was placed in a 25 cm2 suspension flask and shaken at 75 rpm at 35 °C for 5 minutes. In the meantime, cells were counted with a cytometer. The cell suspension from the flask was centrifuged once again at 1,000 rpm for 2 minutes, resuspended in ECS to a concentration of 8-12 million cells/mL, and thoroughly triturated. The cells were loaded into the IF-16 96-well microfluidic plate at 250 μL per well.
The current vs. time trace files were exported and processed using Microsoft Excel and MATLAB. Initial current magnitudes less than −15 nA indicated a sufficient quality of patching for each ensemble of cells. Traces with starting currents above −15 nA were not included in the analysis. The time averaged current from 4 seconds preceding the exposure of the cells to polymer/polyplex (60-64 seconds from the start of the experiment) were compared with the time averaged current following exposure of the cells to polymer/polyplex at 965-969 seconds from start. One-way analysis of variance (ANOVA) coupled with Tukey's multi-comparison tests were performed to evaluate the statistical significance of the difference in the current changes across different the different compounds. Current time traces were also evaluated by measuring their rate of current change. The i/t traces were fit using a linear model in MATLAB, and the slope magnitude was employed to determine if the traces differed significantly.
Polyplexes for Partition Assay: Polyplexes were generated in ECS by adding polymer to plasmid DNA at N:P=10. The polymer concentration in the polyplex solution that was added to the cells was intentionally varied, but N:P was always maintained at 10. The polyplexes were allowed to incubate for 20 minutes prior to being added to the cells.
Trypan Blue Partition Constant Assay:30,34,35,42 A fixed number of cells (e.g. 1 million cells) was suspended in ECS and incubated for 30 minutes with a range of concentrations of polymers/polyplexes. The solutions of cells and polymer/polyplexes were mixed every 10 minutes. The suspensions were then centrifuged at 1,000 rpm, and the cells were resuspended in ECS. Finally, the cells were treated with trypan blue, and the number of trypan blue positive cells was counted using a hemocytometer. This process was completed for four different cell counts (100,000, 500,000, 1 million, and 3 million cells). The polymer concentrations at the onset of trypan blue uptake above baseline were then plotted with respect to the lipid concentration and the results fit with a linear model. The lipid concentration in cells was estimated from literature to be 109 lipid molecules per cell membrane.52 The slope and intercept of this line were Rb and Pw respectively (equation1). K was then estimated using Equation 2. The mathematical model describing the relationship between Rb, Pw and K is described in supplementary material. The error associated with estimates of Rb and Pw obtained using the linear regression can be employed to estimate the error in K (full details provided in supplementary information).
GFP Expression in HEK 293A Cells: HEK 293A cells were plated in 12 well polystyrene plates at 80,000 cells/well in 1 mL of complete DMEM and allowed to grow overnight. Polyplexes containing endotoxin free plasmid encoding GFP were made at N:P=10:1. Before transfection, cells were placed in 450 μL of serum free DMEM and 50 μL of polyplex solution containing 0.8 μg of GFP plasmid were added to the cells. After 3 hours, the media was aspirated and replaced with 1 mL of complete DMEM. GFP expression in cells was measured using flow cytometry 24 hours after the polyplexes were added to cells.
Flow Cytometry: Complete media was aspirated and the cells were washed three times with 1 mL of Ca2+- and Mg2+-free PBS. The cells were suspended with 200 μL of trypsin and incubated at 37°C for 2 minutes. The trypsinization process was stopped by adding 1 mL of cold PBS with Ca2+ and Mg2+. The cell suspension was centrifuged and the cells resuspended in 400 μL of Ca2+- and Mg2+-free PBS. Flow cytometry was performed using an Accuri C6 flow cytometer. The cells were excited by a 488 nm laser, and the fluorescence emission was measured at 525 ± 25 nm. A total of 10,000 events were counted for each sample.
Size and Zeta Potential Measurements: The polyplexes of N:P=10:1 were prepared as described above, but suspended in 450 μL of water instead of ECS. A Malvern Zetasizer Nano ZS (Worchestershire, U.K) instrument with a 4 mW He-Ne laser operating at 633 nm with a 173° scattering angle was used to measure particle size by dynamic light scattering. The refractive index used for the measurements was 1.59. Data from five measurements each consisting of 5 repeats was used to calculate the hydrodynamic diameter. Zetapotentials were measured using the same instrument. About 600 μL of polyplex solutions were loaded into DTS1060 cells, which were then placed in the instrument.
Supplementary Material
ACKNOWLEDGMENT
This project has been funded in part with Federal funds from the National Institutes of Health, National Institute of Biomedical Imaging and Bioengineering, under Award EB005028. R. T. Kennedy and M. Mayer are thanked for helpful suggestions.
References
- 1.Nguyen J, Szoka FC. Nucleic Acid Delivery: The Missing Pieces of the Puzzle? Acc. Chem. Res. 2012;45:1153–1162. doi: 10.1021/ar3000162. [DOI] [PMC free article] [PubMed] [Google Scholar]
- 2.Mintzer MA, Simanek EE. Nonviral Vectors for Gene Delivery. Chem. Rev. 2009;109:259–302. doi: 10.1021/cr800409e. [DOI] [PubMed] [Google Scholar]
- 3.Wang AZ, Langer R, Farokhzad OC. Nanoparticle Delivery of Cancer Drugs. Annu. Rev. Med. 2012;63:185–198. doi: 10.1146/annurev-med-040210-162544. [DOI] [PubMed] [Google Scholar]
- 4.Leroueil PR, Berry SA, Duthie K, Han G, Rotello VM, McNerny DQ, Baker Jr JR, Orr BG, Holl MM. Wide Varieties of Cationic Nanoparticles Induce Defects in Supported Lipid Bilayers. Nano Lett. 2008;8:420–424. doi: 10.1021/nl0722929. [DOI] [PubMed] [Google Scholar]
- 5.Lin J, Zhang H, Chen Z, Zheng Y. Penetration of Lipid Membranes by Gold Nanoparticles: Insights into Cellular Uptake, Cytotoxicity, and Their Relationship. ACS Nano. 2010;4:5421–5429. doi: 10.1021/nn1010792. [DOI] [PubMed] [Google Scholar]
- 6.Arvizo RR, Miranda OR, Thompson MA, Pabelick CM, Bhattacharya R, Robertson JD, Rotello VM, Prakash YS, Mukherjee P. Effect of Nanoparticle Surface Charge at the Plasma Membrane and Beyond. Nano Lett. 2010;10:2543–2548. doi: 10.1021/nl101140t. [DOI] [PMC free article] [PubMed] [Google Scholar]
- 7.Huhn D, Kantner XK, Geidel XC, Brandholt S, Cock I, De; Soenen SJH, Gil PR, Montenegro J, Braeckmans K, Nienhaus GU, et al. Polymer-Coated Nanoparticles Interacting with Proteins and Cells: Focusing on the Sign of the Net Charge. ACS Nano. 2013;7:3253–3263. doi: 10.1021/nn3059295. [DOI] [PubMed] [Google Scholar]
- 8.Hong S, Leroueil PR, Janus EK, Peters JL, Kober MM, Islam MT, Orr BG, Baker JR, Jr, Banaszak Holl MM. Interaction of Polycationic Polymers with Supported Lipid Bilayers and Cells: Nanoscale Hole Formation and Enhanced Membrane Permeability. Bioconjugate Chem. 2006;17:728–734. doi: 10.1021/bc060077y. [DOI] [PubMed] [Google Scholar]
- 9.Moghimi SM, Symonds P, Murray JC, Hunter a C., Debska G, Szewczyk A. A Two-Stage Poly(ethylenimine)-Mediated Cytotoxicity: Implications for Gene Transfer/therapy. Mol. Ther. 2005;11:990–995. doi: 10.1016/j.ymthe.2005.02.010. [DOI] [PubMed] [Google Scholar]
- 10.Grandinetti G, Smith AE, Reineke TM. Membrane and Nuclear Permeabilization by Polymeric pDNA Vehicles: Efficient Method for Gene Delivery or Mechanism of Cytotoxicity? Mol. Pharmaceutics. 2012;9:523–538. doi: 10.1021/mp200368p. [DOI] [PMC free article] [PubMed] [Google Scholar]
- 11.Grandinetti G, Ingle NP, Reineke TM. Interaction of Poly(ethylenimine)-DNA Polyplexes with Mitochondria: Implications for a Mechanism of Cytotoxicity. Mol. Pharmaceutics. 2011;8:1709–1719. doi: 10.1021/mp200078n. [DOI] [PMC free article] [PubMed] [Google Scholar]
- 12.Matz RL, Erickson B, Vaidyanathan S, Kukowska-Latallo JF, Baker JR, Orr BG, Banaszak Holl MM. Polyplex Exposure Inhibits Cell Cycle, Increases Inflammatory Response, and Can Cause Protein Expression without Cell Division. Mol. Pharmaceutics. 2013;10:1306–1317. doi: 10.1021/mp300470d. [DOI] [PMC free article] [PubMed] [Google Scholar]
- 13.Hong S, Bielinska AU, Mecke A, Keszler B, Beals JL, Shi X, Balogh L, Orr BG, Baker JR, Banaszak Holl MM. Interaction of Poly (amidoamine) Dendrimers with Supported Lipid Bilayers and Cells: Hole Formation and the Relation to Transport. Bioconjugate Chem. 2004;15:774–782. doi: 10.1021/bc049962b. [DOI] [PubMed] [Google Scholar]
- 14.Erickson B, DiMaggio SC, Mullen DG, Kelly CV, Leroueil PR, Berry S. a., Baker JR, Orr BG, Holl MMB. Interactions of Poly(amidoamine) Dendrimers with Survanta Lung Surfactant: The Importance of Lipid Domains. Langmuir. 2008;24:11003–11008. doi: 10.1021/la801497d. [DOI] [PMC free article] [PubMed] [Google Scholar]
- 15.Chen J, Hessler JA, Putchakayala K, Panama BK, Khan DP, Hong S, Mullen DG, Dimaggio SC, Som A, Tew GN, et al. Cationic Nanoparticles Induce Nanoscale Disruption in Living Cell Plasma Membranes. J. Phys. Chem. B. 2009;113:11179–11185. doi: 10.1021/jp9033936. [DOI] [PMC free article] [PubMed] [Google Scholar]
- 16.Mecke A, Lee D-K, Ramamoorthy A, Orr BG, Banaszak Holl MM. Membrane Thinning due to Antimicrobial Peptide Binding: An Atomic Force Microscopy Study of MSI-78 in Lipid Bilayers. Biophys. J. 2005;89:4043–4050. doi: 10.1529/biophysj.105.062596. [DOI] [PMC free article] [PubMed] [Google Scholar]
- 17.Mecke A, Majoros IJ, Patri AK, Baker JR, Banaszak Holl MM, Orr BG. Lipid Bilayer Disruption by Polycationic Polymers: The Roles of Size and Chemical Functional Group. Langmuir. 2005;21:10348–10354. doi: 10.1021/la050629l. [DOI] [PubMed] [Google Scholar]
- 18.Lee H, Larson RG. Lipid Bilayer Curvature and Pore Formation Induced by Charged Linear Polymers and Dendrimers: The Effect of Molecular Shape. J. Phys. Chem. B. 2008;112:12279–12285. doi: 10.1021/jp805026m. [DOI] [PMC free article] [PubMed] [Google Scholar]
- 19.Lee H, Larson RG. Multiscale Modeling of Dendrimers and Their Interactions with Bilayers and Polyelectrolytes. Molecules. 2009;14:423–438. doi: 10.3390/molecules14010423. [DOI] [PMC free article] [PubMed] [Google Scholar]
- 20.Lee H, Larson RG. Coarse-Grained Molecular Dynamics Studies of the Concentration and Size Dependence of Fifth- and Seventh-Generation PAMAM Dendrimers on Pore Formation in DMPC Bilayer. J. Phys. Chem. B. 2008;112:7778–7784. doi: 10.1021/jp802606y. [DOI] [PMC free article] [PubMed] [Google Scholar]
- 21.Lee H, Larson RG. Molecular Dynamics Simulations of PAMAM Dendrimer-Induced Pore Formation in DPPC Bilayers with a Coarse-Grained Model. J. Phys. Chem. B. 2006;110:18204–18211. doi: 10.1021/jp0630830. [DOI] [PubMed] [Google Scholar]
- 22.Kelly CV, Leroueil PR, Nett EK, Wereszczynski JM, Baker JR, Orr BG, Banaszak Holl MM, Andricioaei I. Poly(amidoamine) Dendrimers on Lipid Bilayers I: Free Energy and Conformation of Binding. J. Phys. Chem. B. 2008;112:9337–9345. doi: 10.1021/jp801377a. [DOI] [PMC free article] [PubMed] [Google Scholar]
- 23.Kelly CV, Leroueil PR, Orr BG, Banaszak Holl MM, Andricioaei I. Poly(amidoamine) Dendrimers on Lipid Bilayers II: Effects of Bilayer Phase and Dendrimer Termination. J. Phys. Chem. B. 2008;112:9346–9353. doi: 10.1021/jp8013783. [DOI] [PMC free article] [PubMed] [Google Scholar]
- 24.Yan L-T, Yu X. Enhanced Permeability of Charged Dendrimers across Tense Lipid Bilayer Membranes. ACS Nano. 2009;3:2171–2176. doi: 10.1021/nn9004236. [DOI] [PubMed] [Google Scholar]
- 25.Nyitrai G, Keszthelyi T, Bota A, Simon A, Toke O, Horvath G, Pal I, Kardos J, Heja L. Sodium Selective Ion Channel Formation in Living Cell Membranes by Polyamidoamine Dendrimer. Biochim. Biophys. Acta. 2013;1828:1873–1880. doi: 10.1016/j.bbamem.2013.04.004. [DOI] [PubMed] [Google Scholar]
- 26.Zhou Y, Kumon RE, Cui J, Deng CX. The Size of Sonoporation Pores on the Cell Membrane. Ultrasound Med. Biol. 2009;35:1756–1760. doi: 10.1016/j.ultrasmedbio.2009.05.012. [DOI] [PMC free article] [PubMed] [Google Scholar]
- 27.Rattan R, Vaidyanathan S, Wu GS-H, Shakya A, Orr BG, Banaszak Holl MM. Polyplex- Induced Cytosolic Nuclease Activation Leads to Differential Transgene Expression. Mol. Pharmaceutics. 2013;10:3013–3022. doi: 10.1021/mp400103f. [DOI] [PMC free article] [PubMed] [Google Scholar]
- 28.Prevette LE, Nikolova EN, Al-Hashimi HM, Banaszak Holl MM. Intrinsic Dynamics of DNA- Polymer Complexes: A Mechanism for DNA Release. Mol. Pharmaceutics. 2012;9:2743–2749. doi: 10.1021/mp3002864. [DOI] [PMC free article] [PubMed] [Google Scholar]
- 29.Heerklotz H, Seelig J. Correlation of Membrane/Water Partition Coefficients of Detergents with the Critical Micelle Concentration. Biophys. J. 2000;78:2435–2440. doi: 10.1016/S0006-3495(00)76787-7. [DOI] [PMC free article] [PubMed] [Google Scholar]
- 30.Lichtenberg D, Ahyayauch H, Alonso A, Goni FM. Detergent Solubilization of Lipid Bilayers: A Balance of Driving Forces. Trends Biochem. Sci. 2013;38:85–93. doi: 10.1016/j.tibs.2012.11.005. [DOI] [PubMed] [Google Scholar]
- 31.Lasch J. Interaction of Detergents with Lipid Vesicles. BBA - Rev. Biomembranes. 1995;1241:269–292. doi: 10.1016/0304-4157(95)00010-o. [DOI] [PubMed] [Google Scholar]
- 32.Heerklotz H. Interactions of Surfactants with Lipid Membranes. Q. Rev. Biophys. 2008;41:205–264. doi: 10.1017/S0033583508004721. [DOI] [PubMed] [Google Scholar]
- 33.Preté PSC, Malheiros SVP, Meirelles NC, de Paula E. Quantitative Assessment of Human Erythrocyte Membrane Solubilization by Triton X-100. Biophys. Chem. 2002;97:1–5. doi: 10.1016/s0301-4622(02)00043-1. [DOI] [PubMed] [Google Scholar]
- 34.Preté PSC, Gomes K, Malheiros SVP, Meirelles NC, de Paula E. Solubilization of Human Erythrocyte Membranes by Non-Ionic Surfactants of the Polyoxyethylene Alkyl Ethers Series. Biophys. Chem. 2002;97:45–54. doi: 10.1016/s0301-4622(02)00042-x. [DOI] [PubMed] [Google Scholar]
- 35.Preté PSC, Domingues CC, Meirelles NC, Malheiros SVP, Goñi FM, de Paula E, Schreier S. Multiple Stages of Detergent-Erythrocyte Membrane interaction—A Spin Label Study. BBA - Biomembranes. 2011;1808:164–170. doi: 10.1016/j.bbamem.2010.10.016. [DOI] [PubMed] [Google Scholar]
- 36.Heerklotz H, Seelig J. Leakage and Lysis of Lipid Membranes Induced by the Lipopeptide Surfactin. Eur. Biophys. J. 2007;36:305–314. doi: 10.1007/s00249-006-0091-5. [DOI] [PubMed] [Google Scholar]
- 37.Heerklotz H, Seelig J. Titration Calorimetry of Surfactant-Membrane Partitioning and Membrane Solubilization. Biochim. Biophys. Acta. 2000;1508:69–85. doi: 10.1016/s0304-4157(00)00009-5. [DOI] [PubMed] [Google Scholar]
- 38.De la Maza A, Parra JL. Vesicle-Micelle Structural Transition of Phosphatidylcholine Bilayers and Triton X-100. Biochem. J. 1994;303:907–914. doi: 10.1042/bj3030907. [DOI] [PMC free article] [PubMed] [Google Scholar]
- 39.De la Maza A, Coderch L, Gonzalez P, Parra JL. Subsolubilizing Alterations Caused by Alkyl Glucosides in Phosphatidylcholine Liposomes. J. Control. Release. 1998;52:159–168. doi: 10.1016/s0168-3659(97)00205-8. [DOI] [PubMed] [Google Scholar]
- 40.Tan A, Ziegler A, Steinbauer B, Seelig J. Thermodynamics of Sodium Dodecyl Sulfate Partitioning into Lipid Membranes. Biophys. J. 2002;83:1547–1556. doi: 10.1016/S0006-3495(02)73924-6. [DOI] [PMC free article] [PubMed] [Google Scholar]
- 41.Beck A, Li-Blatter X, Seelig A, Seelig J. On the Interaction of Ionic Detergents with Lipid Membranes Thermodynamic Comparison of N-Alkyl-+N(CH3)3 and N-Alkyl-SO4−. J. Phys. Chem. B. 2010;114:15862–15871. doi: 10.1021/jp107088d. [DOI] [PubMed] [Google Scholar]
- 42.Vaidyanathan S, Orr BG, Banaszak Holl MM. Detergent Induction of HEK 293A Cell Membrane Permeability Measured under Quiescent and Superfusion Conditions Using Whole Cell Patch Clamp. J. Phys. Chem. B. 2014;118:2112–2123. doi: 10.1021/jp4124315. [DOI] [PMC free article] [PubMed] [Google Scholar]
- 43.Lichtenberg D, Opatowski E, Kozlov MM. Phase Boundaries in Mixtures of Membrane-Forming Amphiphiles and Micelle-Forming Amphiphiles. BBA - Biomembranes. 2000;1508:1–19. doi: 10.1016/s0304-4157(00)00004-6. [DOI] [PubMed] [Google Scholar]
- 44.Cócera M, López O, Pons R, Amenitsch H, de la Maza A. Effect of the Electrostatic Charge on the Mechanism Inducing Liposome Solubilization: A Kinetic Study by Synchrotron Radiation SAXS. Langmuir. 2004;20:3074–3079. doi: 10.1021/la035972+. [DOI] [PubMed] [Google Scholar]
- 45.Van Dongen MA, Orr BG, Banaszak Holl MM, Dongen M. A. Van, Orr BG, Holl MMB. Diffusion NMR Study of Generation-Five PAMAM Dendrimer Materials. J. Phys. Chem. B. 2014;118:7195–7202. doi: 10.1021/jp504059p. [DOI] [PMC free article] [PubMed] [Google Scholar]
- 46.Mullen DG, Desai A, Van Dongen M. a., Barash M, Baker JR, Banaszak Holl MM. Best Practices for Purification and Characterization of PAMAM Dendrimer. Macromolecules. 2012;45:5316–5320. doi: 10.1021/ma300485p. [DOI] [PMC free article] [PubMed] [Google Scholar]
- 47.Prevette LE, Mullen DG, Banaszak Holl MM. Polycation-Induced Cell Membrane Permeability Does Not Enhance Cellular Uptake or Expression Efficiency of Delivered DNA. Mol. Pharmaceutics. 2010;7:870–883. doi: 10.1021/mp100027g. [DOI] [PMC free article] [PubMed] [Google Scholar]
- 48.Kim ST, Saha K, Kim C, Rotello VM. The Role of Surface Functionality in Determining Nanoparticle Cytotoxicity. Acc. Chem. Res. 2013;46:681–691. doi: 10.1021/ar3000647. [DOI] [PMC free article] [PubMed] [Google Scholar]
- 49.Dougherty CA, Furgal JC, van Dongen MA, Goodson T, Banaszak Holl MM, Manono J, DiMaggio S. Isolation and Characterization of Precise Dye/Dendrimer Ratios. Chem. –A Eur. J. 2014;20:4638–4645. doi: 10.1002/chem.201304854. [DOI] [PMC free article] [PubMed] [Google Scholar]
- 50.Dougherty CA, Vaidyanathan S, Orr BG, Banaszak Holl MM. Fluorophore:Dendrimer Ratio Impacts Cellular Uptake and Intracellular Fluorescence Lifetime. Bioconjugate Chem. 2015 doi: 10.1021/bc5005735. [DOI] [PMC free article] [PubMed] [Google Scholar]
- 51.Spencer CI, Li N, Chen Q, Johnson J, Nevill T, Kammonen J, Ionescu-Zanetti C. Ion Channel Pharmacology Under Flow: Automation Via Well-Plate Microfluidics. Assay Drug Dev. Technol. 2012;10:313–324. doi: 10.1089/adt.2011.414. [DOI] [PubMed] [Google Scholar]
- 52.Alberts B, Johnson A, Lewis J, Raff M, Roberts K, Walter P. Molecular biology of the cell. Garland Science; New York: 2002. The Lipid Bilayer. [Google Scholar]
Associated Data
This section collects any data citations, data availability statements, or supplementary materials included in this article.


