

Abstract
In patients with bilateral cochlear implants (CIs), pairing matched interaural electrodes and stimulating them with the same frequency band is expected to facilitate binaural functions such as binaural fusion, localization, and spatial release from masking. Because clinical procedures typically do not include patient-specific interaural electrode pairing, it remains the case that each electrode is allocated to a generic frequency range, based simply on the electrode number. Two psychoacoustic techniques for determining interaurally paired electrodes have been demonstrated in several studies: interaural pitch comparison and interaural time difference (ITD) sensitivity. However, these two methods are rarely, if ever, compared directly. A third, more objective method is to assess the amplitude of the binaural interaction component (BIC) derived from electrically evoked auditory brainstem responses for different electrode pairings; a method has been demonstrated to be a potential candidate for bilateral CI users. Here, we tested all three measures in the same eight CI users. We found good correspondence between the electrode pair producing the largest BIC and the electrode pair producing the maximum ITD sensitivity. The correspondence between the pairs producing the largest BIC and the pitch-matched electrode pairs was considerably weaker, supporting the previously proposed hypothesis that whilst place pitch might adapt over time to accommodate mismatched inputs, sensitivity to ITDs does not adapt to the same degree.
Keywords: binaural interaction component, electrically evoked auditory brainstem response, bilateral cochlear implant, pitch comparison, interaural time difference, interaural electrode pairing
Introduction
Bilateral cochlear implants (CIs) have been shown to be successful in exploiting some of the advantages of having two sound receivers (Chadha, Papsin, Jiwani, & Gordon, 2011; Gifford, Dorman, Sheffield, Teece, & Olund, 2014; Van Deun, van Wieringen, & Wouters, 2010; van Hoesel & Tyler, 2003; Wanna, Gifford, McRackan, Rivas, & Haynes, 2012), in particular by allowing for better ear listening and binaural summation. Some bilaterally implanted subjects also enjoy better sound localization abilities, primarily through the exploitation of interaural level differences (ILDs) (Gordon, Deighton, Abbasalipour, & Papsin, 2014; Kerber & Seeber, 2012; Litovsky, Parkinson, & Arcaroli, 2009; Seeber & Fastl, 2008). However, there is little evidence that bilateral CIs employing commercially available speech processing strategies are successful in restoring the advantages of interaural time difference (ITD) sensitivity, such as “binaural squelch” (Gifford et al., 2014). This is despite evidence indicating that bilateral CI users experience binaural fusion (Kan, Litovsky, & Goupell, 2015; Kan, Stoelb, Litovsky, & Goupell, 2013; Steel, Papsin, & Gordon, 2015) and despite the existence of a binaural interaction component (BIC) in the electrically evoked auditory brainstem response (eABR) (Gordon, Salloum, Toor, van Hoesel, & Papsin, 2012; He, Brown, & Abbas, 2010, 2012; Pelizzone, Kasper, & Montandon, 1990; Smith & Delgutte, 2007). One factor suggested to account for the large variability across bilateral CI subjects in spatial hearing performance is an interaural mismatch in electrode stimulation between the left and right CIs (Goupell, Stoelb, Kan, & Litovsky, 2013; He et al., 2010; Kan et al., 2013, 2015; Litovsky et al., 2012; Long, Eddington, Colburn, & Rabinowitz, 2003; Majdak, Goupell, & Laback, 2011; van Hoesel, 2004, 2007; van Hoesel & Clark, 1997; van Hoesel & Tyler, 2003; Vecchiato et al., 2011). Such mismatches might be result of different insertion depths, different implant lengths, or locally different electrode-nerve interfaces. In normal-hearing (NH) listeners, inputs from the two ears to binaural brainstem neurons can be assumed to be well matched, as confirmed by measures of binaural perception (Dietz, Ewert, Hohmann, & Kollmeier, 2008; Nuetzel & Hafter, 1976). It is therefore expected to be very important to determine interaural electrode pairs that generate an interaction binaurally. In so doing, matched pairs should process the same acoustic frequency band, effectively compensating for any differences between the two implanted cochleae. Interaural electrode pairing (IEP) is likely to be increasingly important in future technological developments, such as in developing truly binaural CI coding strategies, which will preserve, enhance, and optimize interaural cues.
Several methods have been proposed to define interaural electrode pairs to optimize binaural function in bilateral CI users. One clinically employed method—computed tomography (CT)—provides a direct measure of IEP based on relative insertion depths (Marsh et al., 1993; Skinner et al., 2002; Xu, Xu, Cohen, & Clark, 2000). Theoretically, electrodes can be located by CT scans, but these are not routinely available to audiologists nor can they be used to determine the population of nerve fibers stimulated by the implant. Thus, although CT scans provide a means of determining the relative placement of electrode arrays within the cochleae, they are not informative as to which electrode pairs are most well matched.
A second means of determining IEP is through an interaural comparison of pitch perception. This behavioral pairing method shows some predictive value (He et al., 2010; Kan et al., 2013, 2015; Litovsky et al., 2012; Long et al., 2003; van Hoesel, 2004, 2007; van Hoesel & Clark, 1997; van Hoesel & Tyler, 2003) in selecting interaural electrode pairs with good ITD sensitivity, but it cannot reliably identify those electrode pairs with the best, or even with significant, ITD sensitivity (Long et al., 2003; Poon, Eddington, Noel, & Colburn, 2009; van Hoesel & Clark, 1997). A priori, it is also not clear that a pitch-matched interaural electrode pair faithfully indicates the stimulation of auditory-nerve fibers generating maximal binaural interaction (Poon et al., 2009). In addition, Carlyon et al. (2010) suggested that the behavioral pitch-matching experiments are strongly influenced by nonsensory biases and that the method is tedious and time consuming. Moreover, Reiss, Turner, Erenberg, and Gantz (2007) showed that pitch perception changes over time in some CI subjects, raising the question as to whether the pitch percept shortly after initial activation of the speech processor or that following some adaptive change in pitch perception is a better measure for IEP.
A third, and arguably more direct, method of IEP is to pair electrodes showing maximum binaural sensitivity, for example, by determining the minimal ITD just-noticeable difference (Poon et al., 2009; van Hoesel & Clark, 1997) or by means of a lateralization task (Kan et al., 2013, 2015). However, these tasks are also very time consuming, and the results are often not so precise (van Hoesel & Clark, 1997). Moreover, Poon et al. (2009) suggested that a direct measurement of ITD sensitivity can be used to guide the pairing of interaural electrodes for CI users who exhibit ITD sensitivity at the time of fitting, but more indirect techniques are necessary for individuals showing no evidence of sensitivity to ITDs immediately following initial activation of the CI.
A final possible method for pairing electrodes interaurally is to determine the pair that evokes the largest BIC. The BIC is defined as the difference between the evoked potential obtained with binaural stimulation and the sum of the potentials obtained with monaural stimulation (Furst, Bresloff, Levine, Merlob, & Attias, 2004; Gardi & Berlin, 1981; Levine, 1981; Riedel & Kollmeier, 2002). Pelizzone et al. (1990) suggested that if two implants are positioned so that corresponding electrodes stimulate auditory-nerve fibers from comparable regions in the two cochleae, stimulation of comparable region-pairs of electrodes might show greater binaural interaction than stimulating noncomparable region-pairs of electrodes. Pelizzone et al. (1990) also suggested that physiological measures of binaural interactions (e.g., evoked potentials) will likely be required to accomplish best matched interaural electrode pairs. More recently, the BIC of eABRs was successfully obtained in animals (Smith & Delgutte, 2007) and humans (Gordon et al., 2012; Gordon, Valero, & Papsin, 2007; He et al., 2010). Smith & Delgutte (2007) indicated that the interaural electrode pairs producing the maximally overlapping patterns of neural activity in the midbrain (inferior colliculus) were also those that yielded the maximum BIC amplitude. Their activation patterns are indicative for the characteristic frequency. This is evidence in favor of the hypothesis that the BIC amplitude is a measure for the left–right overlap of stimulated auditory-nerve fibers with matching characteristic frequencies. These authors reported a clear effect of interaural electrode spacing on the amplitude of the BIC. They suggest that eABR measurements may provide a method for assigning frequency channel mappings in bilateral implant recipients.
In humans, He et al. (2010) observed some evidence for the tuning of the BIC amplitude as a function of interaural electrode offset at low current levels and suggested that the effect of electrode pairing on the amplitude of the BIC is more pronounced at lower stimulation levels. Subsequently, these authors demonstrated there to be no significant correlation between the magnitude of the BIC and interaural pitch comparisons at either the individual or group levels (He et al., 2012). Gordon et al. (2012) demonstrated that a BIC occurs in the brainstem of bilaterally implanted children and that the BIC is disrupted by large but not by small mismatches in place of stimulation. This suggests that the BIC is especially valuable for pediatric fitting or for those adults who cannot perform the psychophysical measures, such as pitch comparison, ITD sensitivity, or binaural fusion.
Although all of the previously mentioned studies suggest that the BIC could be a potential approach for electrode pairing, to date, no evidence exists to indicate any correlation between the BIC and perception-based methods for determining IEP. For example, He et al. (2012) found no correlation between the electrode pair with the maximum BIC amplitude and the pitch-matched pair.
In the current study, we assess and compare three IEP methods obtained from the same subjects: (a) BIC amplitudes (an objective measure), (b) ITD sensitivity (psychoacoustic), and (c) interaural pitch comparison (psychoacoustic). In contrast to place pitch, neural generators of the first two IEP methods are thought to originate in the same brainstem structures. We assume that, at least for NH and postlingually deafened subjects, the stimulation of place-matched auditory-nerve fibers generates the maximal binaural interaction at the level of the brainstem (see, e.g., Smith & Delgutte, 2007) and, thus, maximum ITD sensitivity (Nuetzel & Hafter, 1976). It is further assumed that this early part of the neural auditory pathway, once matured with acoustic NH input, is not subject to a significant amount of plasticity after CI implantation.
Testing the hypothesis that the electrode pair with the best ITD sensitivity is identical, or similar, to the pair with the largest BIC amplitude, we demonstrate that the IEP selected by maximum ITD sensitivity is usually identical to the IEP selected by the largest BIC amplitude. Further, the IEP determined by pitch comparison can deviate from the two other IEPs and appears to be comparable with the processor-paired electrodes (electrodes providing the same frequency band). The data suggest that the processor-matched and pitch-matched pairs may be suboptimal measures of effective binaural electrode matches and that matching according to objective binaural criteria provides a possible means of more accurate fitting in bilateral CIs.
Materials and Methods
Subjects
Eight postlingually deafened bilateral cochlear implantees (four men and four women; mean age of 52 years), all using MED-EL implant systems, participated in this study. Subjects were evaluated by a structured interview and questionnaires before the experiment and provided voluntary written informed consent, obtained with the approval of the Ethics Committee of the University of Oldenburg, following a full explanation of the experimental protocol. Subjects had two or three separate appointments; one or two for the psychophysical tests and one for the electroencephalography (EEG)/BIC test. Demographic information and the pulse polarity used in the EEG test for the eight bilateral CI participants are shown in Table 1. In the MED-EL CI system, the 12 intracochlear electrodes are numbered from 1 to 12 in the apical to basal direction. Here, we indicate a specific electrode in the left or right cochlea by the letters “L” or “R.” For example, Lx refers to the x-th electrode on the left implant. Notice that with the exception of S1, the processor-paired electrodes are the numerically matching channels, for example, L1 to R1 and L12 to R12. Because S1 has an electroacoustic (EAS) hybrid device on the left side, her processor-paired electrode to the L4 reference is R7.
Table 1.
Demographic Information of the Bilateral CI Participants, Including Gender, Age at Testing, Etiology, Years of Experience for Hearing Aids (yrsexp HA), Years of Electric Experience for the Left and Right Implant (yrsexp CIs), Left and Right Implants Type, Implant Electrode Array, Reference Electrode and Corresponding Processor-Paired Electrode (Processor Paired el.), the Probe Electrodes, and the Polarity Used in the EEG Stimulation.
| ID | Sex | Age | Etiology | yrs exp HA L/R | yrs exp CIs L/R | Implant type L/R | Implant electrode array L/R | Reference electrode/ processor- paired el. | Probe electrodes | Polarity in EEG |
|---|---|---|---|---|---|---|---|---|---|---|
| S1 | F | 27 | Progressive hearing loss | 12/13 | 3/2 | Sonata (EAS)/ Concerto | Flex 24/ Flex 31.5 | L4/R7 | R1–R7, R12 | Anodic first |
| S2 | M | 78 | Unknown | 3/8 | 9/4 | Sonata/Sonata | Std 31.5/ Std 31.5 | L5/R5 | R1–R6, R9, R12 | Anodic first |
| S3 | M | 48 | Unknown | Unknown | 7/2 | Sonata/Concerto | N/A | L4/R4 | R1–R7, R12 | Anodic first |
| S4 | M | 55 | Noise | 17/20 | 10/7 | Pulsar/Sonata | Std 31.5/ Std 31.5 | L4/R4 | R1–R7, R12 | Alternating |
| S5 | F | 59 | Sudden hearing loss | Na/2 | 5/4 | Sonata/Sonata | Std 31.5/ Std 31.5 | L4/R4 | R1–R7, R12 | Anodic first |
| S6 | F | 47 | Sudden hearing loss | 15/22 | 7/0.8 | Sonata/Sonata | Std 31.5/ Flex 28 | L4/R4 | R1–R12 | Alternating |
| S7 | F | 57 | Measles | 16/12 | 9/13 | Pulsar/Pulsar | Std 31.5/ Std 31.5 | L4/R4 | R1–R12 | Alternating |
| S8 | M | 48 | Meningitis | 40/0 | 2/0.5 | Concerto/ Synchrony | N/A | L4/R4 | R1–R7 | Alternating |
Note. The processor-paired electrode is not always known exactly. Some subjects may have had an FSP program starting at 100 Hz and at the same time an FS4 program starting at 70 Hz in the same or in the other ear. They may also have switched from FSP (e.g., 100–8500 Hz) to FS4 (e.g., 70–8500 Hz) recently. This renders an exact determination difficult. As long as the difference is not more than 30 Hz for the lowest frequency and the highest frequency is identical (8500 Hz) in both ears and no electrodes are deactivated, we approximate this as no mismatch in the frequency mapping. The implant electrode names are abbreviated followed by the length in mm: Std: standard electrode; Flex: Flex electrode.
CI = cochlear implant; EEG = electroencephalography; EAS = electroacoustic; FSP = fine structure processing.
Equipment
The electrical stimuli were controlled from a stimulation PC running MATLAB via a research interface (RIB II, University of Innsbruck, Austria) that communicated directly with both implants via a National Instruments I/O card, optical isolation interface box, and two telemetry coils, bypassing any speech processor. Prior to the experiment, the stimuli were verified using two detector boxes (the MED-EL CI simulators) and an oscilloscope.
A graphical user interface was used to input subject’s information (e.g., implant type and implant ID) and experiment parameters (e.g., test electrode, pulse parameters), to execute the basic hearing tests (e.g., loudness estimation and loudness balancing), and to control the electrical stimulation via the stimulation computer. The freely available Oldenburg AFC software (Ewert, 2013) was embedded in the IEP research platform to operate the RIB II interface. A touch screen was connected to the stimulation computer for the psychophysical tests (Hu, Ewert, Campbell, Kollmeier, & Dietz, 2014).
A self-developed EEG cap for CI subjects (manufactured by Easycap, Herrsching, Germany) with holes at the coil locations was used (see Hu, Kollmeier, & Dietz, 2015; Figure 1). With this cap, the participant is able to switch between the research coils and his or her standard coils during the preparation or break, making communication more convenient and more comfortable for the subjects. The EEG data were recorded via CURRY7 (Neuroscan) connected to a recording computer.
Figure 1.

CI stimulus and trigger for EEG recording. Because the trigger was generated from the RIB II placed within the booth, the trigger was sent out 25 ms before the CI stimulation to avoid any trigger-off-artifact to coincide with the eABR response.
CI = cochlear implant; EEG = electroencephalography; eABR = electrically evoked auditory brainstem response.
Stimuli
All stimuli were constant-amplitude pulse trains presented at a rate of 19.9 pulses per second (pps). The rate of the pulsatile stimulation was lower than typical stimulation rates used in clinical CI processors considering the assessment of eABR (He et al., 2010). Moreover, this low pulse rate is expected to facilitate good interaural pulse time difference (IPTD) perception (van Hoesel, Jones, & Litovsky, 2009) and allows for a good place pitch estimates due to the absence of a strong rate pitch (Carlyon et al., 2010; Zeng, 2002). The stimulus was a train of charge-balanced biphasic pulses, with typically 50-µs phase duration, and 2.1-µs interphase gap presented repeatedly via monopolar stimulation mode. For all psychophysical tests, trains of 10 pulses, that is, of about 500-ms duration were used. In the two-interval procedures, a 300-ms pause was included between two intervals. For EEG, a continuous electrical pulse train was presented with a 5-ms long trigger sent 25 ms before onset of the CI stimulation (−25 ms), see Figure 1.
For the purpose of comparison, nonalternating and alternating polarity stimulation strategies are assessed in different subjects (as shown in Table 1) in a parallel study (Hu et al., 2015). The nonalternating biphasic pulse stimulation includes an anodic pulse first followed by a cathodic pulse. The alternating polarity reported previously (Bahmer, Peter, & Baumann, 2008; Brown, Abbas, Fryauf-Bertschy, Kelsay, & Gantz, 1994; Brown et al., 2000; Hay-McCutcheon, Brown, Clay, & Seyle, 2002; Undurraga, Carlyon, Wouters, & Wieringen, 2013) was introduced to facilitate the suppression of stimulus artifacts.
Psychophysical Test Procedures
Four pretests were performed to find the optimal stimulation parameters, that is, the maximum comfortable level (MCL), the hearing threshold level, the interaural loudness-balanced (LB) level, and the centralized level between the probe electrodes and the reference electrode. In addition to these pretests, two psychoacoustic IEP procedures were typically tested within the same session. Each participant received detailed written and spoken instructions before each specific pretest or main test procedure. The participant responded to the stimulation by pressing different buttons on the touch screen as instructed for the specific procedures.
Pretests
Psychophysical pretests were performed in the following order: First, the 60% dynamic range (DR) of the reference electrode was obtained by testing its MCL and hearing threshold level. In case MCL could not be reached with 50-µs phase duration, it was increased to 60 µs, and the experiment was restarted. All subjects did reach MCL at either 50 or 60 µs phase duration. Subsequently, the loudness balancing procedure with a fixed 60% DR level at the reference electrode and an adaptive level at each probe electrode was performed. Afterward, the sound image centering procedure was applied similarly to all the electrode pairs between the reference electrode at 60% DR and each probe electrode. The final pretest was a rough IPTD sensitivity testing to determine a meaningful fixed test IPTD and to familiarize the subject with the IPTD procedure. A meaningful IPTD is defined as any point on the psychometric curve, where the subject performs significantly above chance (>64% correct) but also well below ceiling performance (<90%). The detailed pretest procedures are described in Hu et al. (2014).
Interaural Pairwise Pitch Comparison
For a selected reference electrode (e.g., L4), each probe electrode was directly compared for perceived pitch, using a procedure of constant stimuli. Each of these electrode pair members was stimulated in a random order, 50 repetitions for each pair. The participants were asked to indicate in which interval the higher pitch was perceived. The participants were instructed to focus on pitch rather than timbre or loudness. The measure “probe electrode has a higher pitch than the reference electrode” was then analyzed as a function of probe electrode number. The linearly interpolated 50% intercept was defined as the pitch-matched pair. This typically gives a noninteger number, a virtual electrode; however, the decimal number is expected to be only vaguely indicative of any exact pitch-matched position. Rather, due to the linearity, simply rounding this virtual electrode number will be identical to selecting the physical electrode that yielded a value closest to 50%. The 95% confidence boundaries for “pitch is perceived significantly different” for 50 repetitions, derived with the binomial distribution, are 50% ± 14%. Again, the linearly interpolated intercepts with the resulting 36% and 64% values were used to define the 95% confidence interval for this method.
IPTD Sensitivity Testing
The goal of this procedure is to systematically investigate the effects of interaural electrode selection on IPTD discrimination. Each electrode pair that yielded a centralized fused sound image in the sound image centering pretest was stimulated simultaneously with the presentation level on the reference electrode (e.g., L4) fixed at 60% DR and the presentation level of the electrodes on the other ear resulting from the sound image centering. As we were not sure whether all subjects can successfully and reliably finish an adaptive procedure, especially at nonoptimal electrodes, we chose a constant IPTD procedure and measure percent correct values. A second reason for avoiding adaptive IPTDs is that the psychometric function is not necessarily monotonic for IPTDs. Therefore, a critical prerequisite for adaptive procedures is not given.
A two-interval two-alternative forced-choice procedure was employed. One randomly chosen interval consisted of a left-leading signal (), the other by a right-leading signal (). The participant was required to indicate whether the stimulus in the second interval was perceived to the left or the right of the first interval. The IPTD sensitivity experiment with the estimated individual IPTD value was performed for all the selected electrode pairs, 50 repetitions for each pair in random order. The electrode pair with the highest percent correct responses was determined. Then, all electrodes that fell within the 95% confidence interval (based on a 50-trial binomial distribution) of this electrode were marked, to form a group of potentially paired electrodes.
EABR Recording Procedures
Recordings
EABRs were differentially recorded from Ag/AgCl electrodes of a customized equidistant 63-channel braincap (Easycap), with an electrode at FPz serving as the ground, and the midline cephalic location (Cz) as the physical reference. The electrodes above the CI coils, typically these were 22 and 26, were left unconnected (see Hu et al., 2015; Figure 1). Two EEG recording electrodes, channel 49 (Inion) and channel 59 (∼3.5 cm below the Inion), on the central anterior–posterior line, which are far away from the reference were of primary interest for obtaining better BIC signal (He et al., 2010; Hu et al., 2015). Electrode impedances were kept below 10 KΩ. The 63 scalp electrodes were connected to the 63 monopolar input connectors of a 70-channel SynAmps RT amplifier system (Neuroscan). The voltage resolution was approximately 29.8 nV/least significant bit. The recordings were filtered by an analog antialiasing lowpass filter with a corner frequency of 8 kHz, digitized with 20 kHz sampling rate via a 24 bit A/D convertor, and stored to hard disk.
During the experiment, participants were seated in a recliner and watched silent, subtitled movies within an electrically shielded sound-attenuating booth. He et al. (2010) showed that the effect of BIC amplitude variation is more pronounced at lower stimulation levels. From their results, it can be inferred that an optimal level is clearly above 30% DR and below 90% DR. Therefore, the eABRs were recorded at the individual subject’s 60% DR LB values obtained in the pretests. With one reference electrode on the left and M probe electrodes on the right implant, a series of stimuli with 2M + 1 electrode conditions were presented from apex to base. The 2M + 1 electrode conditions started with stimulating the reference electrode alone. Then, the most apical probe electrode was stimulated alone followed by the binaural stimulation of the same probe electrode and the reference electrode. Afterward, the second most apical electrode was stimulated first monaurally, then with the probe electrode and so on. The impedances were checked after each run and adjusted if necessary. In total, 7 to 10 runs (2,100–3,000 single pulses in each condition) were carried out for each subject depending on the time limit. The duration of the recording session was about 1 to 1.5 hr, not including preparation and pauses. During the recording any artifact rejection was turned off because filtering, artifact analysis, and averaging was done offline.
Offline postprocessing
One problem of eABR recordings is the inherent contamination with artifacts from the stimulation itself, which cannot be removed by ensemble averaging. These artifacts are an important source of distortion in eABR recordings (Eisen & Franck, 2004). They vary between subjects and depend on the position and impedance of the recording electrodes. The CI stimulation artifacts could cause the erroneous detection of neural responses and could distort response properties. The removal of this unintentionally recorded stimulus artifact from the mixture has been proven to be a difficult task (Bahmer et al., 2008; Brown et al., 1994, 2000; Hay-McCutcheon et al., 2002; Miller & Zhang, 2014; Undurraga et al., 2013).
The eABR postprocessing procedure mainly aimed at removing the CI stimulus artifact, as well as at improving the eABR signal-to-noise-ratio. A two-stage signal processing procedure was applied to the recordings to obtain clearer eABRs (Hu et al., 2015). The first step consisted of canceling the electrical artifacts that contaminated the response, the trigger on/off artifact, and the CI stimulus artifact. (a) The trigger was sent 25 ms before the CI stimulation pulse (−25 ms). The trigger on and off artifacts were removed by limiting the epochs to the time range between −10 to 25 ms in the offline data analysis, where 0 means the start time of sending CI stimulation, −10 ms means 15 ms after trigger onset or 10 ms before sending the CI stimulation. (b) Note that the key point of this research is to obtain an accurate wave eIII to eV for obtaining BIC. Because the CI stimulus artifact caused by the stimulus pulses are synchronous with the expected response and mainly happen in the range from CI stimulation onset to the range of wave eI to wave eII, a simple linear interpolation was adopted to remove the large electrical stimulus artifact during its short duration. This is in line with monaural CI EEG after averaging over polarity (Hofmann & Wouters, 2010). The second step was to obtain an offline average: The processed single epochs were first baseline corrected relative to the 5-ms prestimulus recordings; then, they were filtered by a sixth-order Butterworth digital bandpass filter, with cutoff frequencies set to 100 and 3000 Hz; finally, an iterated weighted average of the filtered sweeps was computed for all stimulus conditions (Riedel & Kollmeier, 2002).
Results
This section is divided into three parts. First, the eABR and BIC data from S6 are presented to show how the time courses of the evoked responses look and how they can be interpreted. Then, the individual IEP results from the three methods and of all eight subjects are presented. To give credit to the uniqueness of each individual data set, the IEP results of each subject are plotted in a separate figure. Finally, a population analysis is presented.
Interpretation of the eABR and BIC Data
The BIC is defined as the difference between the eABR with binaural stimulation (B) and the sum of the eABRs obtained with monaural stimulation (L + R): BIC = B − (L + R) (Riedel & Kollmeier, 2002). For both eABR and BIC, the latency was defined as the time of the respective peaks after electric pulse onset. The amplitude was defined as the difference between the positive peak voltage and the following trough voltage.
As an example, Figure 2(a) shows S6’s results for the monaural eABR at 12 probe electrodes (R1 to R12). In general, wave eI was not observed, due to the stimulation artifact from the implant. The amplitude of wave eV was larger than that typically recorded acoustically, and the latency is shorter because the electrical stimulus directly activates the neural pathway (Gordon et al., 2007; Pelizzone, Kasper, & Montandon, 1989; Starr & Brackmann, 1979). Figure 2(b) shows the morphology of the eABR and the BIC of S6 stimulating with reference electrode L4 and probe electrode R3. The BIC response consists of a small positive peak near 3.6 ms followed by a negative peak near 4.2 ms consistent with previous studies (He et al., 2010).
Figure 2.

EABRs and the BICs of Subject S6: (a) results of the eABR at 12 probe electrodes and (b) EABRs of left CI stimulated only, right CI stimulated only, both CI stimulated simultaneously, L + R, and the BIC. Reference electrode is L4, and probe electrode is R3. The ordinate is their amplitude values in µV. The CI stimulation electric artifact was removed by linear interpolation as described in Hu et al. (2015). The wave eV and BIC are visible at approximately 3.6 and 4.1 ms, respectively.
BIC = binaural interaction component; eABR = electrically evoked auditory brainstem response; CI = cochlear implant.
Electrode Pairing for Individual CI Subjects
Figures 3 to 10 show the IEP results from obtained individual CI subjects for all three tested methods. In each figure, panel (a) shows the BIC for all probe electrode pairs. The different probe electrodes were offset along the ordinate, and the abscissa plots time (post stimulus onset) in ms. The peak and the trough of each BIC are marked with diamonds and squares, respectively. The vertical black line is the scale of 0.5 µV. The error bar shows the standard deviation of the BIC, estimated as the square root of the summed variance of the three measurements, for example, (Riedel & Kollmeier, 2002). This very unfavorable increase in the relative error has made it difficult in the past to reach high significance thresholds. Although arguably a very conservative estimate of the error, we do not feel comfortable deviating from this standard. Nevertheless, we will identify the electrode pairs with the largest BIC amplitude, irrespective of their level of significance. Figures 3(b) to 10(b) plot the amplitudes of wave eV and the BIC, where the number refers to the number of the probe electrode in the right ear. In some plots (e.g., Figure 3), numbers followed by an asterisk indicate that the eABR peak-to-peak amplitude is smaller than the eABR root mean square amplitude in the analysis time window 3.0 to 4.5 ms (mean-to-variance ratio <1). The ordinate and the abscissa indicate the amplitudes of the eV and the BIC, respectively, and r2 represents the coefficient of determination between the amplitudes of the two measures. Generally, subjects’ monaural eABR amplitudes were highly variable across probe electrodes, despite a similar perceived loudness. Less surprisingly, in these cases, the eABR amplitudes were often found to correlate with the corresponding BIC amplitudes. Consequently, variations in BIC amplitude do not necessarily reflect differences in binaural interaction. We, therefore, normalized the BIC amplitude for each electrode to the corresponding monaural wave eV amplitude for those subjects with a coefficient of determination . Panels (c) to (e) of Figures 3 to 10 are the results of three measured IEP methods. The eV BIC amplitudes in each panel (e) were calculated from the marked peaks and troughs in the corresponding panel (a). Panel (f) in Figures 3, 4, and 7 shows the normalized BIC amplitude where . The normalized BIC amplitude is set to 0 for the electrodes with an asterisk indicate in panel (b) where either the eABR wave eV or the BIC peak-to-peak amplitude could not be clearly identified in the analysis time window 3.0 to 4.5 ms.
Figure 3.

Results of S1 with reference electrode L4: (a) wave eV BIC across the probe electrode pairs. The different probe electrodes were offset along the ordinate, and the abscissa is the time in ms. The peak and the trough of each BIC are marked with diamonds and squares, respectively. The error bar shows the standard deviation of the BIC, which was estimated as the square root of the summed variance of the three measurements; (b) scatter plot of the wave eV and BIC amplitudes with the number referring to the probe electrode number. The ordinate and the abscissa are the amplitudes of eV and BIC in µV. The numbers followed by asterisks indicate electrodes where the eABR peak-to-peak amplitude is smaller than the eABR root mean square (RMS) amplitude within the analysis time window of 3 ms to 4.5 ms. The r2 is the coefficient of determination between the eV amplitude and the BIC amplitude; (c) shows the results of interaural pairwise pitch comparison in percentage (%). The blue circles on the dash-dotted line indicate the percentage of how often the probe electrode resulted in a higher pitch percept than the reference electrode in the pitch matching experiment; the black squares in panel (d) are the correct rates in percentage (%) of lateralization judgment in the IPTD experiment. The line 50% indicates chance level for both the pitch and the IPTD task. Lines at 36% and 64% mark the respective 95% confidence intervals. Panel (e) plots the BIC amplitude values in µV and the red pentagrams in panel (f) are the normalized BIC amplitude values. The abscissain panel (c) to (f) indicates the probe electrode number.
BIC = binaural interaction component; IPTD = interaural pulse time difference; eABR = electrically evoked auditory brainstem response.
Figure 4.

Results of S2 with reference electrode L5 (same format as Figure 3). (d) The squares on the dashed line are the correct rates of lateralization judgment in the IPTD experiment with IPTD = 700 µs. The diamonds on the dashed line are the correct rates of lateralization judgment in the IPTD experiment with IPTD = 400 µs.
BIC = binaural interaction component; IPTD = interaural pulse time difference.
Figure 5.

Results of S3 with reference electrode L4 (same format as Figure 3): no normalization for S3.
BIC = binaural interaction component; IPTD = interaural pulse time difference.
Figure 6.

Results of S4 with reference electrode L4 (same format as Figure 3): no normalization for S4.
BIC = binaural interaction component; IPTD = interaural pulse time difference.
Figure 7.

Results of S5 with reference electrode L4 (same format as Figure 3).
BIC = binaural interaction component; IPTD = interaural pulse time difference.
Figure 8.

Results of S6 with reference electrode L4 (same format as Figure 3): no normalization for S6.
BIC = binaural interaction component; IPTD = interaural pulse time difference.
Figure 9.

The results of S7 with reference electrode L4 (same format as Figure 3): no normalization for S7.
BIC = binaural interaction component; IPTD = interaural pulse time difference.
Figure 10.

The results of S8 with reference electrode L4 (same format as Figure 3): no normalization for S8.
BIC = binaural interaction component; IPTD = interaural pulse time difference.
Subject 1
Figure 3 shows the results of Subject S1, the youngest subject tested. She has an EAS on the left side, and thus the low-frequency acoustic hearing was preserved. An IPTD = 80 µs was used in her IPTD experiment, the lowest of all subjects. The red pentagrams in panel (f) indicate the normalized BIC amplitudes, where the BIC data were normalized to the amplitude of wave eV because . Clear BIC responses were evident for probe CI electrodes R1 to R7, but not on electrode R12 (with reference electrode L4). The blue circles indicate the probability that the probe electrode resulted in a higher pitch percept than the reference electrode in the pitch comparison experiment. The 50% value of the linearly interpolated function indicates the IEP result for pairwise pitch comparison. However, given that the 95% confidence interval is ±14% for 50 trials, the accuracy of the method is typically in the order of 1 electrode and any decimal place is only vaguely indicative of a pitch match. The black squares are the correct rates of lateralization judgment in the IPTD experiment. The abscissa indicates the probe electrode number. The left ordinate is the percentage (%), and the right ordinate is the BIC amplitude. The main result here and for most of the upcoming subjects is that for all three methods, meaningful and well-tuned functions over electrode number were obtained.
Reference electrode L4 on the EAS device (1744 Hz) corresponds to the frequency band of R7 (1624 Hz). The average paired electrodes generating best performance are R5.8 (best pitch), R6 (best IPTD performance), and R6 (largest BIC amplitude). For the latter two IEP methods, the neighbor electrodes (R5 and R7) produced significantly different results from R6. Thus, for this subject, the three methods of determining IEP generate almost identical outcomes.
Subject 2
The results of S2, the oldest subject assessed in the current study are shown in Figure 4. Because this subject showed ceiling performance for the 700 -µs test IPTD, he was retested with a smaller IPTD of 400 µs on electrodes 3, 4, 5, and 6. Because , the BIC data were once more normalized to the magnitude of wave eV. For reference electrode L5, the pitch-matching task suggested the paired electrode to be R4.7, with R4 the best for IPTD (IPTD = 400 µs), and R3 generating the largest BIC amplitude. As for S1 in Figure 3, the IPTD- and BIC-based methods showed significantly different results when comparing the electrode with the highest value with its respective neighbors. It is also true for the pitch comparison.
Subject 3
The BIC data of Subject S3, electrode 12 (Figure 5(a)), are apparently contaminated with facial-nerve stimulation (Hu et al., 2015). The other BIC traces appear to be free of artifacts. For Subject S3, reference electrode L4 and IPTD = 200 µs were selected. The paired electrodes are R3.5 (pitch comparison), R1 to R3 (best IPTD performance), and R1 (largest BIC amplitude). Because the three most apical electrodes did not produce significantly different IPTD sensitivities, we only state an interval.
Subject 4
For Subject S4, again, L4 was chosen as the reference electrode and the test IPTD was 400 µs. The eABR recoding was limited to probe electrodes R2 to R7 due to time constraints of this subject. In comparison with S1 to S3, the contrast between electrodes R1 to R5 was very weak for all three methods tested (Figure 6): There is no significant difference among R3 to R5 for the IPTD results. S4’s pairwise pitch comparison function was not very well tuned, and the pitch perception is not significantly different among R1 to R5. There are two almost identical BIC peaks at electrode R3 and R5. That said, however, for all three methods, electrodes R6 and R7 did produce very different results compared with the five most apical electrodes. The consistency across methods hints at a strong spread of excitation in the apical turn and argues against imprecise methods. This will be further elaborated in the discussion.
Subject 5
The IPTD sensitivity test of Subject S5 reveals the largest deviation from the processor pair of all tested subjects. With reference electrode L4, the paired electrodes are R6 to R8 (best IPTD performance), R4.4 (pitch comparison), and R6 (largest BIC amplitude). The pairs with best IPTD sensitivity are 1.6 to 3.6 electrodes away from the (interpolated) electrode with identical pitch perception.
Because , the BIC data were normalized. The BIC-based method indicates electrode R6 to be matched with L4, which is closer to the IPTD-based matching for this subject. For S5, there are three electrodes that have a high IPTD sensitivity (R6 to R8). As for S3 and S4, the second and third best performing probe electrodes are not significantly different from the best performing, rendering the assignment of a unique matched pair difficult. Note that the pitch-matched electrode pair L4R4 does not yield a significantly above chance IPTD sensitivity.
Subject 6
Figure 8 shows the results of Subject S6. The implant on the right (probe electrode) side was implanted only 9 months before the experiment. For S6 with reference electrode L4, the paired electrodes are R5.4 (pitch comparison), R3 (best IPTD performance), and R5 (largest BIC amplitude).
Subject 7
For S7, it was possible to identify a single electrode pair with a significantly higher IPTD sensitivity than all other electrode pairs (Figure 9(c)). With reference electrode L4, the paired electrodes are R4.1 (pitch comparison) and R5 (best IPTD performance). However, here, the BIC tuning curve has two clear peaks; one at R1 and the other at R5. The approximately 9-mm spacing between these electrodes is a little too small for an across turn stimulation effect, which, if any, one would expect between, for example, R1 and R6. This issue will be revisited in the discussion.
Subject 8
With just more than 40 years, S8 had the longest duration of unaided deafness in his worse ear, and he was the most recent subject who received his second implant. His implant was switched on approximately six months before the measurements. He is the only subject that does not reveal a significant IPTD sensitivity (see Figure 10) even at the largest IPTD tested. However, his BIC amplitudes show a clear and pronounced peak, and his pitch ranking function is among the steepest of all subjects. With reference electrode L4, the paired electrodes are R3.9 (pitch comparison) and R4 (largest BIC amplitude). Electrode R4 appears to also stimulate an undesired nerve, as is apparent from the large potential at 4.5 to 7 ms post stimulus. Fortunately, the latency here is slightly larger than a typical facial-nerve artifact latency allowing for a determination of the BIC amplitude. In the centralization pretest, this subject reported inconsistently across repeats if the sound image was fused. We, therefore, conducted the IPTD experiment with the LB rather than the centralized stimulus levels.
Population Analysis
Table 2 lists the three IEP results for each subject. In general, it was possible to determine interaural electrode pairs via pitch matching, IPTD sensitivity, and BIC amplitudes. However, the pairing results were not consistent across methods. Differences in determined interaural electrode pairs for each method and each subject are summarized in Table 2. The “same pitch” interval is specified by the linearly interpolated 36% and 64% intercepts of the pitch comparison over electrode number functions. As mentioned earlier, these percent values indicate the 95% confidence interval for “significantly different pitch”. The first seven subjects can all reliably fuse the stimulation into a single image and have an above chance IPTD performance. Only S8 has no consistent fusing and also no significant IPTD sensitivity. However, all subjects including S8 have significant BIC amplitudes at least for some electrode pairs. Because we omitted confidence interval specification for the BIC-based pairing, Table 2 lists only the largest single value. Only in two cases with two very similar maxima, two pairs are stated.
Table 2.
The Three IEP Results for Each Subject.
| Subject ID/ref electrode | S1/L4 | S2/L5 | S3/L4 | S4/L4 | S5/L4 | S6/L4 | S7/L4 | S8/L4 |
|---|---|---|---|---|---|---|---|---|
| Processor pair | R7 | R5 | R4 | R4 | R4 | R4 | R4 | R4 |
| Same pitch | 4.7–6.6 | 4.2–5.2 | 2.7–4.1 | 1–5 | 3.9–4.8 | 5.1–5.7 | 3.5–5.2 | 3.7–4.4 |
| Best IPTD sensitivity | 6 | 4 | 1–3 | 3–5 | 6–8 | 3 | 5 | N/A |
| Largest BIC amplitude | 6 | 3 | 1 | 3, 5 | 6 | 5 | 1, 5 | 4 |
Note. IEP = interaural electrode pairing; IPTD = interaural pulse time difference; BIC = binaural interaction component.
The data are further simplified to a single value for each electrode pair for a visual pairwise method comparison (Figure 11), which plots the electrode offset , that is, the difference between processor pair, as a function of the method-specific pair: offset for best IPTD performance (), pitch comparison (), and largest BIC amplitude (). The root mean square error in each panel was calculated from the same six subjects except S4 and S8. The pitch-based electrode pair is defined as the linearly interpolated 50% intercept. If more than one electrode resulted in not significantly different IPTD sensitivity, the middle of the interval of electrodes was chosen. For the BIC, there were two cases where two very similar, and nonneighboring, peaks were identified: In one case, S4, very large confidence intervals were obtained for the other two methods, making a reasonable pair definition very difficult. As a result, the data from S4 are not included in Figure 11. It is worth noting, however, that all three methods produced very similar results for S4 indicating a large range of electrodes, R1 to R5, generating similar performance. Similarly, S7 also has two peaks in the BIC tuning curve. Here, the pair L4-R1 produced a slightly larger peak than L4-R5. We reason that in case of very similar amplitudes, it makes sense to choose the pair closer to the processor pairing, in the absence of any other information to the contrary. With reference to the very low statistical power of the results from this method, this (arbitrary) decision appears more reasonable than the alternative pairing of L4 with R1, for which the BIC amplitude is larger, but a much lower a priori probability, meaning that an interaural mismatch of 7 mm (corresponding to L4-R1) is less likely.
Figure 11.
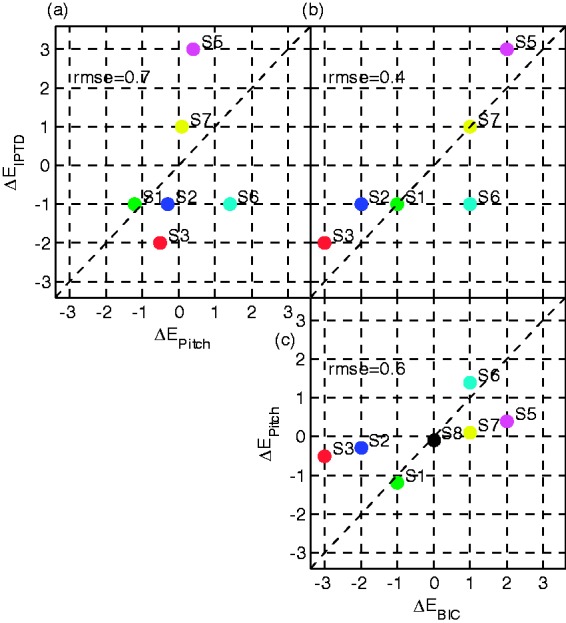
Visualization of the three possible pairwise method comparisons: (a) pitch versus IPTD, (b) BIC versus IPTD, and (c) BIC versus pitch. The abscissa and ordinate are the electrode offsets ΔE, that is, the difference between processor pair and method-specific pair: offset for best IPTD performance (), pitch comparison (), and largest BIC amplitude (). The root mean square error (RMSE) is indicated in each panel as a measure of pairwise similarity, derived from subjects S1 to S3 and S5 to S7.
BIC = binaural interaction component; IPTD = interaural pulse time difference.
Figure 11 shows that (a) only for Subject S1, all three methods identify the same electrode pair. (b) In five of the seven subjects where a pitch-matched (virtual) electrode could be determined, it was almost identical to the processor-paired electrode (). The two exceptions were S1 who has an EAS device on the left side and S6 who has only 9-month bilateral CI experience. (c) The IPTD- and BIC-based IEP show offsets of up to (∼2–3 electrodes) for some subjects. (d) The IPTD- and BIC-based IEP are very similar to each other except for S6. (e) As a direct consequence from (a) to (d), and as can be seen in the top left panel (a) and the bottom right panel (c) of Figure 11, there is not much correspondence between the pitch-matched pair and the other two methods.
Discussion
In the present study, we hypothesized that the electrode pair eliciting the largest BIC amplitude has high correspondence with the pair that generates maximum sensitivity to ITDs assessed perceptually. We also hypothesized that the correspondence of these two pairs with the pitch-matched pair is considerably weaker.
Most subjects had a pitch-matched electrode that was almost identical to the electrode that is programmed to the same frequency band as the reference electrode ( for five of seven subjects). This supports the hypothesis that pitch percepts adapt to the pairing imposed by the clinical processor mapping (Reiss et al., 2007). Moreover, in line with the previous studies (Long et al., 2003; Poon et al., 2009; van Hoesel & Clark, 1997), a systematic discrepancy between the pitch-matched pair and that with the best IPTD sensitivity was observed. Encouragingly, we found evidence that IPTD-based and BIC-based pairings indicated a higher degree of similarity, the first time such a similarity has been reported.
Interaural Place Pitch Comparison
As the term suggests, place pitch is an indication of where along the length of the cochlea, auditory-nerve fibers are stimulated (Oxenham, Micheyl, Keebler, Loper, & Santurette, 2011; Plack & Oxenham, 2005). It always provides for a sequential comparison, such that two percepts, one generated by stimulation of each ear, are compared by, presumably higher, brain centers.
Here, a constant stimulus procedure was chosen to determine the interaurally pitch-matched electrode pair. This method is often quite time-inefficient because extreme values of the comparison stimuli are all classified through a complete analysis of the entire parameter space (Jesteadt, 1980), that is, it potentially measures some very clear pairs with close to 100% discriminability, for some 50 repetitions. It did, however, produce very stable results, monotonic pitch tuning curves, and avoided any potential bias due to sequential effects in adaptive pitch-matching procedures (Harris, 1952; Jesteadt, 1980; König, 1957). The 95% confidence interval typically spanned the range of only 1 electrode.
All subjects showed a . The largest deviation was measured for S6, which notably is one of the two subjects with less than 9 months experience using bilateral CIs. This further supports the hypothesis that the pitch perception adapts to the clinical processor mapping (Reiss et al., 2007).
The conclusions drawn from the pitch comparison are limited to the specific methods and stimulus parameters. It is possible that a high pulse rate, different stimulation levels (Reiss et al., 2007), or an adaptive matching procedure may have yielded different electrode pairs. If this were the case, however, it would also suggest pitch matching is not a robust pairing technique.
Sensitivity to IPTDs
Although the large variability in IPTD sensitivity across subjects, and the range of estimated detection thresholds, are both consistent with previous studies (see, e.g., Laback, Egger, & Majdak, 2015, for a review), it was nevertheless the case that sensitivity to temporal disparities could be measured in seven of eight subjects, with little to no training required. The simple method of constant stimulus was well received by all subjects and yielded reliable and easily interpretable results. Although one specific electrode pair with significantly better IPTD sensitivity than any other IEP was identified in four of our subjects, the pairing of the remaining three subjects spanned several electrodes (e.g., S5 in Figure 7). This is consistent with the previous findings that ITD just-noticeable difference do not change much until there is a 3 to 6 mm mismatch interaurally between electrodes, compared with the best matched-place condition (van Hoesel & Clark, 1997), and that lateralization is still possible with up to 3 mm of interaural mismatch (Kan et al., 2013, 2015). The deviation from the processor-paired electrode was 1.5 electrodes on average, and in one case, it was 3 electrodes. Given the fairly large MED-EL electrode spacing of approximately 2.2 to 2.4 mm, these suggest very large offsets indeed. One possible reason for finding large electrode mismatches corresponding to 4 to 7 mm in two of our subjects is that MED-EL electrodes are on average longer than electrodes from other manufacturers, potentially causing a larger insertion depth variance (Franke-Trieger, Jolly, Darbinjan, Zahnert, & Murbe, 2014). Another possibility is that even if electrodes are place matched, different neural survival across the ears can result in nonplace-paired electrodes eliciting the best binaural interaction. We cannot distinguish between these possibilities here because of the lack of anatomical insertion data and because only one reference electrode was tested.
Only the most recently implanted S8, who also had more than 40 years of unaided deafness, was IPTD performance not above chance. This is consistent with previous reports (e.g., Poon et al., 2009), suggesting that some bilateral CI listeners require many months, or even more than a year, to exploit IPTDs perceptually, even at the lowest pulse rates. This reinforces the need for alternative measures of electrode pairing for newly implanted subjects, even if the objective is to optimize binaural sensitivity.
EABRs
Before discussing the BIC amplitude as a function of probe electrode number, it is worth first considering the monaural and binaural eABR data used to derive the BIC, in particular, CI-specific artifacts and the amplitude of wave eV (see Hu et al., 2015 for a further artifact analysis). In some subjects, the amplitude of wave eV varied as a function of electrode number, despite the fact that all electrodes were LB against the same reference electrode. This is in contrast to previous reports (Abbas & Brown, 1988; Gallégo et al., 1999; Gordon, Papsin, & Harrison, 2004) that posit wave eV amplitude as an acceptable objective measure for loudness. One reason can be that the loudness of the probe electrodes was not equalized by direct comparison. Priority was given to the interaural loudness balance; henceforth, loudness across probe electrodes was only equalized in an indirect way. The observed variations need attention when interpreting eABR-derived measures such as the BIC.
Some artifacts apparent in the eABR such as the facial-nerve artifact (Hu et al., 2015) or even CI stimulation artifacts were less prominent in the BIC data. While some of these artifacts can be mostly eliminated by stimulating with alternating polarity (Bahmer et al., 2008; Brown et al., 1994, 2000; Hofmann & Wouters, 2010; Undurraga et al., 2013), this is typically not necessary to acquire the BIC itself (Hu et al., 2015). The main reason for this is the BIC’s inherent elimination of monaural contributions by the formula . All monaural components, including monaurally generated artifacts should be cancelled out by construction. In two cases (S3 electrode 12; S8 electrode 4), a facial-nerve, or a myogenic, artifact was observed that was not cancelled in the BIC. We currently have no explanation for this, only that the fixed order of binaural and monaural stimulation may contribute to its appearance.
To our knowledge, the current study is the first to assess eABR-based BIC responses obtained with MED-EL subjects. Previously, BIC amplitudes in bilaterally implanted human subjects have been assessed in individuals implanted with Cochlear devices (Gordon et al., 2012; He et al., 2010, 2012), and these studies were important in our setting stimulation parameters, for example, employing a moderate stimulation level such as 60% DR, allowed us to generate meaningful data in the first CI subject from which we recorded binaural eABR data in our laboratory. As in the studies outlined earlier, no satisfactory solution was found to cope with the low statistical power but, encouragingly, most subjects’ data revealed a specific electrode pair that generated the largest BIC amplitude and a gradual reduction in the amplitude for probe electrodes more distant to this. The deviation of the electrode pair evoking the largest magnitude BIC differed from the processor-paired electrode by an average 1.7 electrodes, or approximately 4 mm. This difference may explain why averaging BIC amplitudes across subjects as a function of probe electrode number does not result in tuned mean data in a previous study (Gordon et al., 2012). The largest BIC amplitudes for each subject were close to 1 µV, in line with the amplitudes reported by the other two groups (Gordon et al., 2007, 2012; He et al., 2010, 2012) and larger than what is typically reported in acoustically evoked BIC studies (Riedel & Kollmeier, 2002).
Comparison of Pairing Methods
To our knowledge, no previous study has compared electrode pairing based on ITD sensitivity and the BIC. The ultimate goal of IEP is generally described to be the restoration of binaural hearing, that is, optimal ILD and ITD sensitivity, binaural fusion, and optimal spatial release of masking. We, therefore, consider the ITD sensitivity or, in our terminology, best IPTD discriminability, as the most direct IEP measure. It is, therefore, particularly important to compare other methods against measures of electrode pairing based on IPTD sensitivity.
In previous studies, interaural pitch comparison showed some predictive value in selecting interaural electrode pairs with optimal binaural performance but was repeatedly reported not to compensate fully for any underlying differences between the two implanted cochleae. In line with these previous studies (Long et al., 2003; Poon et al., 2009; van Hoesel & Clark, 1997), we found a systematic discrepancy between the pitch-matched pair and the pair with the best IPTD sensitivity.
Within our group of 8 subjects, 2 (S6 and S8) had been bilaterally implanted for only 9 and 6 months, respectively—the remaining subjects had at least 24 months’ experience of bilateral CI listening. Of these, one (S1) had an EAS device on one side; and the data from another (S4) suggested a large spread of excitation in the five most apical electrodes for all three methods. For the four remaining subjects (S2, S3, S5, S7), the signs of and were the same, but the average deviation from the processor-paired electrode was 1.7 electrodes for IPTD, and just 0.3 electrodes for pitch. This suggests that both methods can reliably detect the direction (sign) of the processor pair mismatch and that pitch pairing largely underestimates the absolute mismatch in subjects provided with mismatched processor pairs over a long period. It is particularly noteworthy that S6—one of the two subjects with less than 1 year of bilateral experience—has a , the largest value of observed, and similar to the average value of the other subjects.
IPTD-based and BIC-based pairings indicated the highest degree of similarity (Figure 11(b)). Especially considering the difficulties with both methods in determining a statistically significant best probe electrode, this strong similarity suggests that both methods measure highly correlated quantities with a fair degree of accuracy and precision. Consistent with the data of He et al. (2012), we found considerable differences between the BIC-based pairing and the pitch-based pairing. This is notwithstanding that similar to the pitch versus IPTD comparison, the direction of the mismatch is always the same, and pitch pairing results in a much smaller absolute mismatch compared the BIC-based pairing. A promising finding for the use of the BIC amplitude as a potential binaural fitting technique is that it produced meaningful results even for the most recently implanted S8 who had no IPTD sensitivity.
The neural circuits responsible for ITD sensitivity are located in the superior olivary complex, part of the auditory brainstem (see, e.g., Grothe, 2003 for a review). Similarly, but not necessarily identically, the generators of the BIC are believed to be binaural neurons in the superior olivary complex, inferior colliculus, or the lateral lemniscus (Goldberg & Brown, 1968, 1969; Jones & der Poel, 1990; Ungan & Yagcioglu, 2002). Given the exquisite temporal processing required for binaural hearing and the, presumed, tonotopically (and, hence, “place-”) matched left and right inputs to these binaural neurons (e.g., Grothe, Pecka, & McAlpine, 2010), binaural processing is not expected to allow for plasticity or acclimatization of binaural interactions from place-mismatched inputs. For pitch, on the other hand, different mechanisms (place- and rate-pitch) and different areas of the auditory system appear to be responsible for the perceptual experience, and binaural neurons appear unnecessary to perform the task. Especially for the sequential pitch comparison used in IEP studies, the neural comparison can be expected to take place at a cortical level. Thus, it is likely subject to plasticity or acclimatization on short time scales (Moore, 2003; Oxenham, Bernstein, & Penagos, 2004; Oxenham et al., 2011; Plack & Oxenham, 2005) and during the course of the first months of CI use (Reiss et al., 2007).
In previous studies, no correlation between BIC- and pitch-based pairing (He et al., 2012), and no systemic variation of the across subject average BIC amplitude for electrode pairs with a (Gordon et al., 2012), were observed. Both of these studies considered the BIC measurement precision to be one possible reason failure to do so. The present study, with three pairwise method comparisons, allows for an alternative interpretation, namely, that the amplitude of the BIC as a function of probe electrode may have been highly indicative of the electrode pairing in these aforementioned studies. However, BIC magnitude was compared against potentially much less indicative quantities, such as the pitch-matched pair (He et al., 2012) or against the matched electrode number (Gordon et al., 2012), this was not obvious.
The correlation of predicted electrode-pair mismatches between the BIC- and the IPTD-based method does not imply that a subject with generally larger BIC amplitudes is expected to have a better binaural sensitivity. For instance, S6 has much larger BIC amplitudes than S7 but requires a larger IPTD for a comparable left–right discriminability.
Conclusions and Implications
One of the most important implications is that IEP is important for a considerable proportion of bilateral CI users, at least for those using MED-EL implants. Despite the current spread across a few electrodes, it appears to be not appropriate to assume that a left/right electrode pair with the same channel number will stimulate a sufficiently high proportion of interaurally place-matched nerve fibers. The pairing is expected to be even more important when speech-coding strategies exploiting channel-specific pulse timing are employed because ITD sensitivity is more susceptible to electrode mismatch than is ILD sensitivity (Kan et al., 2013, 2015). This is notwithstanding, that a potential conflict exists between bilateral matching and optimizing the frequency table for monaural speech intelligibility. Determining the optimal frequency tables for the two implants to maximize binaural speech intelligibility as well as spatial awareness is expected to be a challenging and subject-specific task for future studies.
The data obtained using the most common IEP method—pitch comparison—appear misleading in two ways: First that the very small differences typically observed in the interaural place of stimulation when interpreting pitch-matched pairs are “ground truth.” This appears to be presumptive. Second, that any effective (pitch) differences upon implantation will be minimized within several months due to brain plasticity and that this represents a positive outcome. This ignores the apparent situation we describe in which binaural function is not adaptive to a place of stimulation mismatch.
Pitch-based pairing may be more useful shortly after implantation. IPTD- and BIC-based pairing is arguably the better choice for subjects that have used their generic frequency map for many months, or even years. Particularly for children implanted at an early age, the BIC-based pairing appears both promising and suitable (Gordon et al., 2007, 2012; Steel et al., 2015), as no perceptual measures will be possible. Validation by a second method, especially the measurement of both IPTD sensitivity and BIC amplitudes, albeit time consuming, would be the optimal choice.
Objective imaging that considers both the electrode position (Franke-Trieger et al., 2014) and the local electrode-nerve interface would also be most valuable for a comparison against the three presented methods, and eventually for an objective parallel pairing of all electrodes.
Future studies should determine whether, and to what extent, the data we report depend on the specific procedure and stimulus parameters chosen, especially in terms of pulse rates and stimulation level. Further, it should be investigated how an optimal frequency map might be generated for the first implant received (Guérit, Santurette, Chalupper, & Dau, 2014). Measuring the BIC amplitude in a bimodal configuration or with single sided deaf subjects will have to be established before the BIC can be used for determining the place-matched frequency table of monaural CIs. Another issue for these groups of listeners is to determine whether the place-frequency matched map is optimal for other aspects of communication, such as speech intelligibly. Longitudinal studies of IEP (Poon et al., 2009) are also expected to provide valuable data about how much plasticity is involved in each method.
Acknowledgments
We thank our ABCIT project partners at the UCL Ear Institute David McAlpine and Torsten Marquardt for inspirational discussions when planning this study. We further appreciate the valuable comments and suggestions by the anonymous reviewers and by the editor Andrew Oxenham. We are grateful to Stefan Strahl (MED-EL) for RIB II support and other helpful suggestions as well as to Stephan D. Ewert and Tom Campbell for their help during method development. We thank Karsten Plotz, Katrin Bomke (Klinik für Phoniatrie und Pädaudiologie, Ev. Krankenhaus Oldenburg), Stefan Dazert, and Andreas Engel (CI-Zentrum Ruhrgebiet, Universitätsklinik Bochum) for recruiting CI participants. We are most grateful to Birger Kollmeier for excellent support and fruitful discussions and to our colleagues Regina Baumgärtel and Ben Williges for many insightful comments. Last but not least, we thank all CI participants for joining the study and for giving us valuable feedback.
Declaration of Conflicting Interests
The authors declared no potential conflicts of interest with respect to the research, authorship, and/or publication of this article.
Funding
The authors disclosed receipt of the following financial support for the research, authorship, and/or publication of this article: This work was funded by European Union under the Advancing Binaural Cochlear Implant Technology (ABCIT) grant agreement (No. 304912).
References
- Abbas P. J., Brown C. J. (1988) Electrically evoked brainstem potentials in cochlear implant patients with multi-electrode stimulation. Hearing Research 36(2–3): 153–162. [DOI] [PubMed] [Google Scholar]
- Bahmer A., Peter O., Baumann U. (2008) Recording of electrically evoked auditory brainstem responses (E-ABR) with an integrated stimulus generator in Matlab. Journal of Neuroscience Methods 173(2): 306–314. [DOI] [PubMed] [Google Scholar]
- Brown C. J., Abbas P. J., Fryauf-Bertschy H., Kelsay D., Gantz B. J. (1994) Intraoperative and postoperative electrically evoked auditory brain stem responses in nucleus cochlear implant users: Implications for the fitting process. Ear and Hearing 15(2): 168–176. [DOI] [PubMed] [Google Scholar]
- Brown C. J., Hughes M. L., Luk B., Abbas P. J., Wolaver A., Gervais J. (2000) The relationship between EAP and EABR thresholds and levels used to program the nucleus 24 speech processor: Data from adults. Ear and Hearing 21(2): 151–163. [DOI] [PubMed] [Google Scholar]
- Carlyon R. P., Macherey O., Frijns J. H. M., Axon P. R., Kalkman R. K., Boyle P., Dauman R. (2010) Pitch comparisons between electrical stimulation of a cochlear implant and acoustic stimuli presented to a normal-hearing contralateral ear. Journal of the Association for Research in Otolaryngology 11(4): 625–640. [DOI] [PMC free article] [PubMed] [Google Scholar]
- Chadha N. K., Papsin B. C., Jiwani S., Gordon K. A. (2011) Speech detection in noise and spatial unmasking in children with simultaneous versus sequential bilateral cochlear implants. Otology and Neurotology 32(7): 1057–1064. [DOI] [PubMed] [Google Scholar]
- Dietz M., Ewert S., Hohmann V., Kollmeier B. (2008) Coding of temporally fluctuating interaural timing disparities in a binaural processing model based on phase differences. Brain Research 1220: 234–245. [DOI] [PubMed] [Google Scholar]
- Eisen M. D., Franck K. H. (2004) Electrically evoked compound action potential amplitude growth functions and HiResolution programming levels in pediatric CII implant subjects. Ear and Hearing 25(6): 528–538. [DOI] [PubMed] [Google Scholar]
- Ewert, S. D. (2013). AFC – A modular framework for running psychoacoustic experiments and computational perception models. Paper presented at the Proceedings of the International Conference on Acoustics (AIA-DAGA 2013), Merano, Italy.
- Franke-Trieger A., Jolly C., Darbinjan A., Zahnert T., Murbe D. (2014) Insertion depth angles of cochlear implant arrays with varying length: A temporal bone study. Otology and Neurotology 35(1): 58–63. [DOI] [PubMed] [Google Scholar]
- Furst M., Bresloff I., Levine R. A., Merlob P. L., Attias J. J. (2004) Interaural time coincidence detectors are present at birth: Evidence from binaural interaction. Hearing Research 187(1–2): 63–72. [DOI] [PubMed] [Google Scholar]
- Gallégo S., Garnier S., Micheyl C., Truy E., Morgon A., Collet L. (1999) Loudness growth functions and EABR characteristics in Digisonic cochlear implantees. Acta Oto-laryngologica 119(2): 234–238. [DOI] [PubMed] [Google Scholar]
- Gardi J. N., Berlin C. I. (1981) Binaural interaction components. Their possible origins in guinea pig auditory brainstem response. Archives of Otolaryngology 107(3): 164–168. [DOI] [PubMed] [Google Scholar]
- Gifford R. H., Dorman M. F., Sheffield S. W., Teece K., Olund A. P. (2014) Availability of binaural cues for bilateral implant recipients and bimodal listeners with and without preserved hearing in the implanted ear. Audiology and Neurootology 19(1): 57–71. [DOI] [PMC free article] [PubMed] [Google Scholar]
- Goldberg J. M., Brown P. B. (1968) Functional organization of the dog superior olivary complex: An anatomical and electrophysiological study. Journal of Neurophysiology 31(4): 639–656. [DOI] [PubMed] [Google Scholar]
- Goldberg J. M., Brown P. B. (1969) Response of binaural neurons of dog superior olivary complex to dichotic tonal stimuli: Some physiological mechanisms of sound localization. Journal of Neurophysiology 32(4): 613–636. [DOI] [PubMed] [Google Scholar]
- Gordon K. A., Deighton M. R., Abbasalipour P., Papsin B. C. (2014) Perception of binaural cues develops in children who are deaf through bilateral cochlear implantation. PLoS ONE 9(12): e114841. [DOI] [PMC free article] [PubMed] [Google Scholar]
- Gordon K. A., Papsin B. C., Harrison R. V. (2004) Toward a battery of behavioral and objective measures to achieve optimal cochlear implant stimulation levels in children. Ear and Hearing 25(5): 447–463. [DOI] [PubMed] [Google Scholar]
- Gordon K. A., Salloum C., Toor G. S., van Hoesel R., Papsin B. C. (2012) Binaural interactions develop in the auditory brainstem of children who are deaf: Effects of place and level of bilateral electrical stimulation. The Journal of Neuroscience 32(12): 4212–4223. [DOI] [PMC free article] [PubMed] [Google Scholar]
- Gordon K. A., Valero J., Papsin B. C. (2007) Auditory brainstem activity in children with 9–30 months of bilateral cochlear implant use. Hearing Research 233(1–2): 97–107. [DOI] [PubMed] [Google Scholar]
- Goupell M. J., Stoelb C., Kan A., Litovsky R. Y. (2013) Effect of mismatched place-of-stimulation on the salience of binaural cues in conditions that simulate bilateral cochlear-implant listening. Journal of the Acoustical Society of America 133(4): 2272–2287. [DOI] [PMC free article] [PubMed] [Google Scholar]
- Grothe B. (2003) New roles for synaptic inhibition in sound localization. Nature Reviews Neuroscience 4(7): 540–550. [DOI] [PubMed] [Google Scholar]
- Grothe B., Pecka M., McAlpine D. (2010) Mechanisms of sound localization in mammals. Physiological Reviews 90(3): 983–1012. [DOI] [PubMed] [Google Scholar]
- Guérit F., Santurette S., Chalupper J., Dau T. (2014) Investigating interaural frequency-place mismatches via bimodal vowel integration. Trends in Hearing 18: 1–10. [DOI] [PMC free article] [PubMed] [Google Scholar]
- Harris J. D. (1952) Pitch discrimination. Journal of the Acoustical Society of America 24(6): 750–755. [Google Scholar]
- Hay-McCutcheon M. J., Brown C. J., Clay K. S., Seyle K. (2002) Comparison of electrically evoked whole-nerve action potential and electrically evoked auditory brainstem response thresholds in nucleus CI24R cochlear implant recipients. Journal of the American Academy of Audiology 13(8): 416–427. [PubMed] [Google Scholar]
- He S., Brown C. J., Abbas P. J. (2010) Effects of stimulation level and electrode pairing on the binaural interaction component of the electrically evoked auditory brain stem response. Ear and Hearing 31(4): 457–470. [DOI] [PMC free article] [PubMed] [Google Scholar]
- He S., Brown C. J., Abbas P. J. (2012) Preliminary results of the relationship between the binaural interaction component of the electrically evoked auditory brainstem response and interaural pitch comparisons in bilateral cochlear implant recipients. Ear and Hearing 33(1): 57–68. [DOI] [PMC free article] [PubMed] [Google Scholar]
- Hofmann M., Wouters J. (2010) Electrically evoked auditory steady state responses in cochlear implant users. Journal of the Association for Research in Otolaryngology 11(2): 267–282. [DOI] [PMC free article] [PubMed] [Google Scholar]
- Hu, H., Ewert, S., Campbell, T., Kollmeier, B., & Dietz, M. (2014). An interaural electrode pairing clinical research system for bilateral cochlear implants. Paper presented at the 2nd IEEE China Summit and International Conference on Signal and Information Processing (ChinaSIP’ 14) (pp. 66–72), Xi’an, China.
- Hu H., Kollmeier B., Dietz M. (2015) Reduction of stimulation coherent artifacts in electrically evoked auditory brainstem responses. Biomedical Signal Processing and Control 21: 74–81. [Google Scholar]
- Jesteadt W. (1980) An adaptive procedure for subjective judgments. Perception & Psychophysics 28(1): 85–88. [DOI] [PubMed] [Google Scholar]
- Jones S. J., der Poel J. C. V. (1990) Binaural interaction in the brain-stem auditory evoked potential: Evidence for a delay line coincidence detection mechanism. Electroencephalography and Clinical Neurophysiology/Evoked Potentials Section 77(3): 214–224. [DOI] [PubMed] [Google Scholar]
- Kan A., Litovsky R. Y., Goupell M. J. (2015) Effects of interaural pitch matching and auditory image centering on binaural sensitivity in cochlear implant users. Ear and Hearing 36(3): e62–e68. [DOI] [PMC free article] [PubMed] [Google Scholar]
- Kan A., Stoelb C., Litovsky R. Y., Goupell M. J. (2013) Effect of mismatched place-of-stimulation on binaural fusion and lateralization in bilateral cochlear-implant users. Journal of the Acoustical Society of America 134(4): 2923–2936. [DOI] [PMC free article] [PubMed] [Google Scholar]
- Kerber S., Seeber B. U. (2012) Sound localization in noise by normal-hearing listeners and cochlear implant users. Ear and Hearing 33(4): 445–457. [DOI] [PMC free article] [PubMed] [Google Scholar]
- König E. (1957) Pitch discrimination and age. Acta Oto-laryngologica 48(5–6): 475–489. [DOI] [PubMed] [Google Scholar]
- Laback, B., Egger, K., & Majdak, P. (2015). Perception and coding of interaural time differences with bilateral cochlear implants. Hearing Research, 322, 138--150. [DOI] [PubMed]
- Levine R. A. (1981) Binaural interaction in brainstem potentials of human subjects (Research Support, U.S. Gov’t, P.H.S.). Annals of Neurology 9(4): 384–393. [DOI] [PubMed] [Google Scholar]
- Litovsky R. Y., Goupell M. J., Godar S., Grieco-Calub T., Jones G. L., Garadat S. N., Misurelli S. (2012) Studies on bilateral cochlear implants at the University of Wisconsin’s Binaural Hearing and Speech Laboratory. Journal of the American Academy of Audiology 23(6): 476–494. [DOI] [PMC free article] [PubMed] [Google Scholar]
- Litovsky R. Y., Parkinson A., Arcaroli J. (2009) Spatial hearing and speech intelligibility in bilateral cochlear implant users. Ear and Hearing 30(4): 419–431. [DOI] [PMC free article] [PubMed] [Google Scholar]
- Long C. J., Eddington D. K., Colburn H. S., Rabinowitz W. M. (2003) Binaural sensitivity as a function of interaural electrode position with a bilateral cochlear implant user. Journal of the Acoustical Society of America 114(3): 1565–1574. [DOI] [PubMed] [Google Scholar]
- Majdak P., Goupell M. J., Laback B. (2011) Two-dimensional localization of virtual sound sources in cochlear-implant listeners. Ear and Hearing 32(2): 198–208. [DOI] [PMC free article] [PubMed] [Google Scholar]
- Marsh M. A., Xu J., Blamey P. J., Whitford L. A., Xu S. A., Silverman J. M., Clark G. M. (1993) Radiologic evaluation of multichannel intracochlear implant insertion depth. The American Journal of Otology 14(4): 386–391. [PubMed] [Google Scholar]
- Moore B. C. J. (2003) An introduction to the psychology of hearing, 5th ed San Diego, CA: Academic Press. [Google Scholar]
- Miller S., Zhang Y. (2014) Validation of the cochlear implant artifact correction tool for auditory electrophysiology. Neuroscience Letters 577: 51–55. [DOI] [PubMed] [Google Scholar]
- Nuetzel J. M., Hafter E. R. (1976) Lateralization of complex waveforms: Effects of fine structure, amplitude, and duration. Journal of the Acoustical Society of America 60(6): 1339–1346. [DOI] [PubMed] [Google Scholar]
- Oxenham A. J., Bernstein J. G. W., Penagos H. (2004) Correct tonotopic representation is necessary for complex pitch perception. Proceedings of the National Academy of Sciences of the United States of America 101(5): 1421–1425. [DOI] [PMC free article] [PubMed] [Google Scholar]
- Oxenham A. J., Micheyl C., Keebler M. V., Loper A., Santurette S. (2011) Pitch perception beyond the traditional existence region of pitch. Proceedings of the National Academy of Sciences 108(18): 7629–7634. [DOI] [PMC free article] [PubMed] [Google Scholar]
- Pelizzone M., Kasper A., Montandon P. (1989) Electrically evoked responses in cochlear implant patients. Audiology 28(4): 230–238. [DOI] [PubMed] [Google Scholar]
- Pelizzone M., Kasper A., Montandon P. (1990) Binaural interaction in a cochlear implant patient. Hearing Research 48(3): 287–290. [DOI] [PubMed] [Google Scholar]
- Plack C., Oxenham A. (2005) The psychophysics of pitch. In: Plack C., Fay R., Oxenham A., Popper A. (eds) Pitch vol 24, New York, NY: Springer, pp. 7–55. [Google Scholar]
- Poon B. B., Eddington D. K., Noel V., Colburn H. S. (2009) Sensitivity to interaural time difference with bilateral cochlear implants: Development over time and effect of interaural electrode spacing. Journal of the Acoustical Society of America 126(2): 806–815. [DOI] [PMC free article] [PubMed] [Google Scholar]
- Reiss L. A., Turner C. W., Erenberg S. R., Gantz B. J. (2007) Changes in pitch with a cochlear implant over time. Journal of the Association for Research in Otolaryngology 8(2): 241–257. [DOI] [PMC free article] [PubMed] [Google Scholar]
- Riedel H., Kollmeier B. (2002) Auditory brain stem responses evoked by lateralized clicks: Is lateralization extracted in the human brain stem. Hearing Research 163(1–2): 12–26. [DOI] [PubMed] [Google Scholar]
- Seeber B. U., Fastl H. (2008) Localization cues with bilateral cochlear implants. Journal of the Acoustical Society of America 123(2): 1030–1042. [DOI] [PubMed] [Google Scholar]
- Skinner M. W., Ketten D. R., Holden L. K., Harding G. W., Smith P. G., Gates G. A., Blocker B. (2002) CT-derived estimation of cochlear morphology and electrode array position in relation to word recognition in Nucleus-22 recipients. Journal of the Association for Research in Otolaryngology 3(3): 332–350. [DOI] [PMC free article] [PubMed] [Google Scholar]
- Smith Z. M., Delgutte B. (2007) Using evoked potentials to match interaural electrode pairs with bilateral cochlear implants. Journal of the Association for Research in Otolaryngology 8(1): 134–151. [DOI] [PMC free article] [PubMed] [Google Scholar]
- Starr A., Brackmann D. E. (1979) Brain stem potentials evoked by electrical stimulation of the cochlea in human subjects. Annals of Otology, Rhinology & Laryngology 88(4): 550–556. [DOI] [PubMed] [Google Scholar]
- Steel M. M., Papsin B. C., Gordon K. A. (2015) Binaural fusion and listening effort in children who use bilateral cochlear implants: A psychoacoustic and pupillometric study. PLoS ONE 10(2): e0117611. [DOI] [PMC free article] [PubMed] [Google Scholar]
- Undurraga J., Carlyon R., Wouters J., Wieringen A. (2013) The polarity sensitivity of the electrically stimulated human auditory nerve measured at the level of the brainstem. Journal of the Association for Research in Otolaryngology 14(3): 359–377. [DOI] [PMC free article] [PubMed] [Google Scholar]
- Ungan P., Yagcioglu S. (2002) Origin of the binaural interaction component in wave P4 of the short-latency auditory evoked potentials in the cat: Evaluation of serial depth recordings from the brainstem. Hearing Research 167(1–2): 81–101. [DOI] [PubMed] [Google Scholar]
- Van Deun L., van Wieringen A., Wouters J. (2010) Spatial speech perception benefits in young children with normal hearing and cochlear implants. Ear and Hearing 31(5): 702–713. [DOI] [PubMed] [Google Scholar]
- van Hoesel R. J. (2004) Exploring the benefits of bilateral cochlear implants. Audiology and Neurootology 9(4): 234–246. [DOI] [PubMed] [Google Scholar]
- van Hoesel R. J. (2007) Sensitivity to binaural timing in bilateral cochlear implant users. Journal of the Acoustical Society of America 121(4): 2192–2206. [DOI] [PubMed] [Google Scholar]
- van Hoesel R. J., Clark G. M. (1997) Psychophysical studies with two binaural cochlear implant subjects. Journal of the Acoustical Society of America 102(1): 495–507. [DOI] [PubMed] [Google Scholar]
- van Hoesel R. J., Jones G. L., Litovsky R. Y. (2009) Interaural time-delay sensitivity in bilateral cochlear implant users: Effects of pulse rate, modulation rate, and place of stimulation. Journal of the Association for Research in Otolaryngology 10(4): 557–567. [DOI] [PMC free article] [PubMed] [Google Scholar]
- van Hoesel R. J. M., Tyler R. S. (2003) Speech perception, localization, and lateralization with bilateral cochlear implants. Journal of the Acoustical Society of America 113(3): 1617–1630. [DOI] [PubMed] [Google Scholar]
- Vecchiato G., Toppi J., Astolfi L., Mattia D., Malerba P., Scorpecci A., Ba biloni F. (2011) Investigation on the pleasantness of music perception in monolateral and bilateral cochlear implant users by using neuroelectrical source imaging: A pilot study. Conference proceedings: Annual International Conference of the IEEE Engineering in Medicine and Biology Society. IEEE Engineering in Medicine and Biology Society. Annual Conference 2011: 8110–8113. [DOI] [PubMed] [Google Scholar]
- Wanna G. B., Gifford R. H., McRackan T. R., Rivas A., Haynes D. S. (2012) Bilateral cochlear implantation. Otolaryngologic Clinics of North America 45(1): 81–89. [DOI] [PubMed] [Google Scholar]
- Xu J., Xu S. A., Cohen L. T., Clark G. M. (2000) Cochlear view: Postoperative radiography for cochlear implantation. The American Journal of Otology 21(1): 49–56. [PubMed] [Google Scholar]
- Zeng F. G. (2002) Temporal pitch in electric hearing. Hearing Research 174(1–2): 101–106. [DOI] [PubMed] [Google Scholar]