

Summary
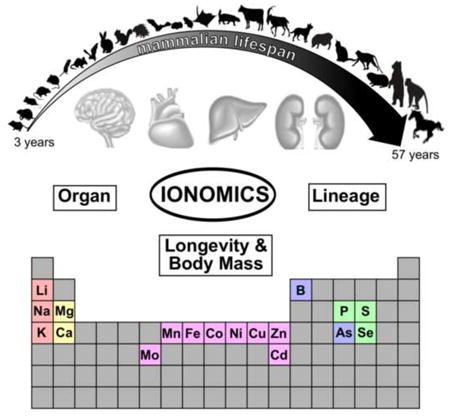
Trace elements are essential to all mammals, but their distribution and utilization across species and organs remains unclear. Here we examined 18 elements in the brain, heart, kidney, and liver of 26 mammalian species, and report the elemental composition of these organs, the patterns of utilization across the species, and their correlation with body mass and longevity. Across the organs we observed distinct distribution patterns for abundant elements, transition metals, and toxic elements. Some elements showed lineage-specific patterns, including reduced selenium utilization in African mole rats, and positive correlation between the number of selenocysteine residues in selenoprotein P and the selenium levels in liver and kidney across mammals. Body mass was linked positively to zinc levels, whereas species lifespan correlated positively with cadmium and negatively with selenium. This study provides insights into the variation of mammalian ionome by organ physiology, lineage specialization, body mass, and longevity.
Graphical abstract
Introduction
The full set of elements used by organisms, or the ionome, supports diverse cellular functions (Eide et al., 2005; Salt et al., 2008). Transition metals alone are estimated to be required by more than one third of enzymes (Holm et al., 1996; Waldron and Robinson, 2009). Selenium (Se) and iodine (I) are used as components of proteins or hormones. Together with manganese (Mn), iron (Fe), cobalt (Co), nickel (Ni), copper (Cu), zinc (Zn), and molybdenum (Mo), these trace elements are needed only in minute quantities, but often act as important protein cofactors and active site components. Their deficiency or overload can result in severe pathological conditions (Fraga, 2005; Goldhaber, 2003).
In contrast, the metals sodium (Na), magnesium (Mg), potassium (K), calcium (Ca), as well as nonmetals phosphorus (P) and sulfur (S), are required in much larger quantities and are often called macronutrients. Some exist as free ions for establishing the electrochemical gradient across biological membranes (e.g. Na+ and K+); others reside in specific subcellular compartments as signaling molecules (e.g. Ca2+). Many are constituents of macromolecules like proteins (e.g. sulfur) and nucleic acids (e.g. phosphate groups), or key structural components in bones, shells and exoskeletons (e.g. calcium phosphate minerals). Yet another group of elements, including lithium (Li), arsenic (As), and cadmium (Cd), are present in the environment and can be readily taken up by plants and animals, but have no apparent biological functions. Depending on the quantity, these elements elicit different biological responses, features that underlie both their use in medical treatments when applied in moderate concentrations, and their toxicity when absorbed in excess.
While a number of large-scale cross-species ionomics studies have been performed in plants (Ozaki et al., 2000; Watanabe et al., 2007; White et al., 2012), similar studies are lacking in mammals. In particular, the variation of element levels across organs, species, and lineages is not well understood. Since the use of these elements is likely shaped by evolution and environmental constraints, one may also be able to identify the links between the ionome and life-history traits (e.g., body mass, time to maturity, and longevity). Crucially, the nature of these questions means that one may need to look across a spectrum of organisms and organs to identify the common trends.
Recent advances in sequencing technology have enabled comparative genomics analyses to reveal the evolution of element utilization (Zhang and Gladyshev, 2009). In this study, we characterized the mammalian ionome by directly quantifying 18 elements in brain, heart, kidney and liver of 26 mammalian species, providing insights into the organization, distribution, and evolution of utilization of elements in mammals.
Results
Conservation of the ionomes of mammalian organs
We analyzed 233 freshly frozen samples from the brain, heart, kidney, and liver of 26 mammalian species representing 10 taxonomic orders (Figure 1A and Table S1). All animals were young adults, and at least two biological replicates (i.e. different individual animals) were obtained for most species. The tissue concentrations of Li, B, Na, Mg, P, S, K, Ca, Mn, Fe, Co, Ni, Cu, Zn, As, Se, Mo, and Cd were quantified by four independent runs of inductively-coupled plasma mass spectrometry (ICP-MS) (Malinouski et al., 2014). After filtering and normalization, the final data quality was assessed graphically (Figure S1).
Figure 1. Basic features of the mammalian ionome.
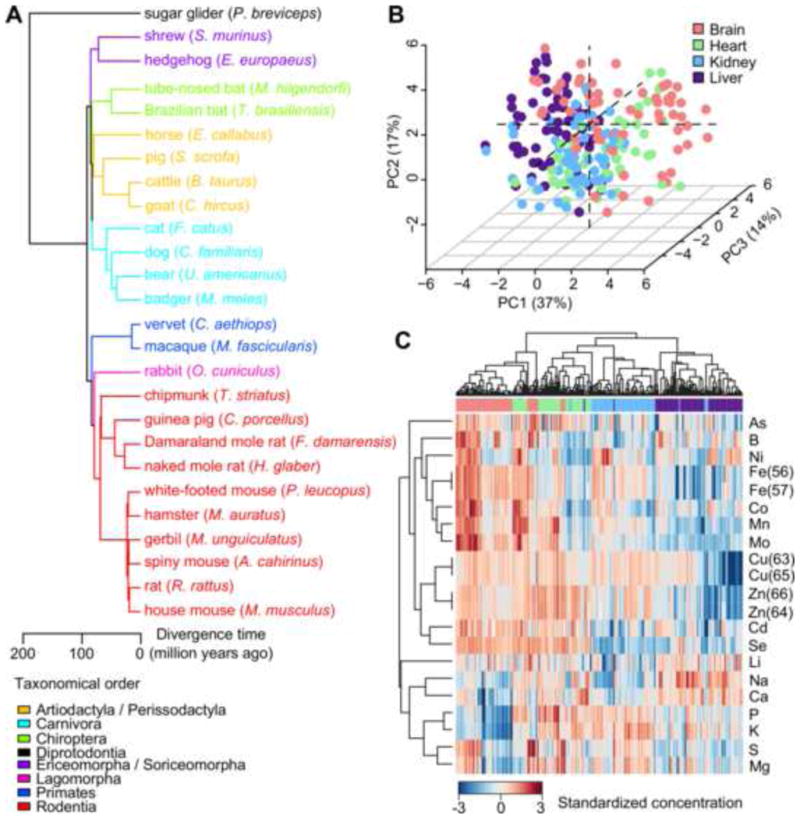
(A) Mammals examined in this study. The species and their common names are indicated and the branches are colored according to taxonomical orders.
(B) Principal Component Analysis reveals segregation of samples by organ origin. Biological replicates are presented as individual points and colored by organ. The percentage variation explained by each principal component (PC) is indicated in parentheses.
(C) Overview of the mammalian ionome using heat map. Each row represents one element or isotope. Each column represents one biological sample (same color scheme as in (B)). Hierarchical clustering was performed using 1 minus Pearson correlation coefficient with average linkage.
Both principal component analysis (PCA) and heat map showed the samples generally clustered according to their organ origin (Figure 1B,C). The first three principal components (PCs) accounted for ∼ 65% of the total variance (Figure 1B), suggesting the elemental composition of each organ was generally conserved. The heat map also revealed a few clusters of elements with similar distribution patterns (Figure 1C), such as the transition metals Mo, Mn, Co, and Fe; the various isotopes of Cu and Zn; as well as the macronutrients P, K, S and Mg.
Interactions among elements are indicative of biological functions
To explore the relationship among the elements, we computed Spearman correlation coefficients for all possible element pairs, using the full data (Figure 2A) and individually within each organ (Figure S2). As expected, the isotopes of the same element showed very strong correlations (all coefficients > 0.99), suggesting that mammals lack the ability to distinguish different isotopic forms. In addition, there were several clusters of elements with high correlations (Figure 2A,B), suggesting potential commonality in uptake mechanism or biological functions.
Figure 2. Correlation and distribution of elements.
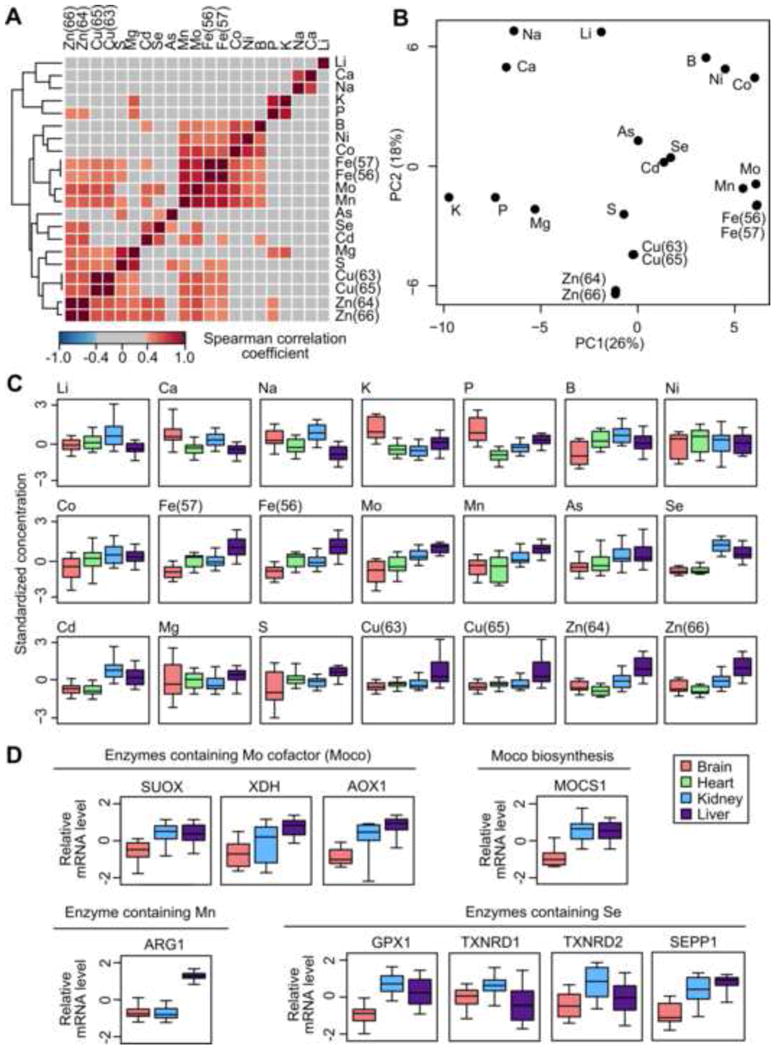
(A) Elements form clusters of significant correlation. Pairwise correlation coefficients among the elements are shown. Coefficients > 0.4 or < -0.4 (approximately equal to p value < 0.05) are highlighted in color. The correlations shown are based on data for all four organs. See Figure S2 for correlations based on individual organs.
(B) Principal Component Analysis reveals distinct clusters of elements. The elements and isotopes are projected on the first two principal components (PCs).
(C) Distribution of elements across organs. The box plots represent standardized concentrations in the brain, heart, kidney, and liver, with the central bands indicating median values and the whiskers indicating 5th and 95th percentiles.
(D) Gene expression patterns of enzymes that utilize Mo, Mn and Se are consistent with the organ distribution of these elements. Gene expression data are based on a previous study (Fushan et al., 2015); data for heart are not available. SUOX: sulfite oxide; XDH: xanthine oxidase/dehydrogenase; AOX1: aldehyde oxidase; MOCS1: Molybdenum cofactor biosynthesis protein 1; ARG1: arginase 1; GPX1: glutathione peroxidase 1; TXNRD1: thioredoxin reductase 1; TXNRD2: thioredoxin reductase 2; SEPP1: selenoprotein P.
One such cluster consisting of Fe, Mo, Mn, Co and Ni was consistently observed in brain, heart, and kidney (all pair-wise correlation coefficients > 0.4; Figure S2). These transition metals often exist as divalent ions, some of which are known to interact. Divalent metal transporter 1 (DMT1) is a key metal transporter with a very broad substrate range that includes Fe2+, Mn2+, Co2+, Ni2+, and Cd2+ ions (Gunshin et al., 1997; Mackenzie et al., 2007). Mn2+ uptake can be coupled with Fe2+ uptake via both transferrin-dependent and transferrin-independent pathways (Roth, 2006). Fe-S clusters and heme groups are required for biosynthesis of the prosthetic group Moco (molybdenum cofactor) and for functioning of most Mo enzymes (Hamza et al., 1998; Mendel and Bittner, 2006). A trace element study of 96 fern and fern ally species also reported correlation coefficient of 0.62 between Fe and Co concentrations (Ozaki et al., 2000). Although in vertebrates Ni has no known biological function, in bacteria and archaea Ni and Co utilize similar or common transport systems (Zhang et al., 2009).
Cu and Zn, two of the most abundant trace metals in the body, also correlated positively in multiple organs (Figure S2). Interaction between Cu and Zn at the physiological level is well documented, as Zn administration is used to antagonize Cu overload in patients with Wilson's disease (Hill and Link, 2009). Cellular transport of Cu and Zn depends on their respective transporters: ZnT and Zip transporter families for Zn; high affinity transporter CTR1, chaperone COX17, CSS, ATOX1, and P-type ATPase ATP7A, ATP7B for Cu (Amaravadi et al., 1997; Eide, 2006; Hamza et al., 1999; Liuzzi and Cousins, 2004). Zn is required for the catalytic activities of more than 200 enzymes and also serves a structural role in transcription factors, whereas Cu is found in several metabolic enzymes, as well as cytochrome c oxidase (Complex IV) of the electron transport chain. Some enzymes (e.g. Cu/Zn superoxide dismutase) contain both elements in the active sites. Therefore, the observed correlation may reflect the physiological requirement for proper balance of Cu and Zn.
Interestingly, both Se and Cd were high in kidney and liver, and low in brain and heart (Figure 2A,C). While Se is mainly found in the form of selenocysteine (Sec) in selenoproteins, Cd has no known biological functions in higher organisms. Both elements are toxic at high concentrations and their levels in plants and animals often depend on the environmental concentrations in soil, water, or food (Clemens et al., 2013; Hurst et al., 2013). Another toxic element, As, also clustered very closely with Cd and Se (Figure 2B), suggesting that all three elements are treated by mammals as toxic species and are handled in a similar manner, although Se is primarily recognized as an essential element.
Ionomes of mammalian organs
Next we analyzed the elemental distribution across the four organs (Figure 2C, Figure S3A). Liver had the highest or the second highest levels of 15 out of the 21 elements and/or isotopes (Figure 2C and Table S2), likely reflecting its central role in catabolism, anabolism, and detoxification. As electrolytes become concentrated during renal ultrafiltration and reabsorption, kidney had relatively high levels of Li, Na, and Ca. Brain and heart are less diverse in their metabolic functions and contained low levels of many elements. Nevertheless, P and K were found at the highest concentrations in brain, with Na and Ca also present at high levels. Our data also agreed well with a previous report of metal levels in humans (Katoh et al., 2002) (Figure S3B).
We also examined the gene expression patterns of some enzymes known to utilize trace elements (Figure 2D) (Fushan et al., 2015). Sulfite oxidase (SUOX), xanthine oxidase/dehydrogenase (XDH), and aldehyde oxidase (AOX1) require the molybdenum cofactor (Moco) for their activities, whereas molybdenum cofactor biosynthesis protein 1 (MOCS1) catalyzes the biosynthesis of Moco. They were all highly expressed in liver and showed significant correlation with Mo concentration (Spearman correlation coefficient SUOX: 0.58; XDH: 0.49; AOX1: 0.58; MOCS1: 0.68). Arginase 1 (ARG1) binds Mn at the active site and showed strong correlation with Mn concentration (Spearman correlation coefficient 0.58). The selenoproteins glutathione peroxidase 1 (GPX1), thioredoxin reductases TXNRD1 and TXNRD2, and selenoprotein P (SEPP1) also showed significant correlation to Se levels (Spearman correlation coefficient GPX1: 0.64; TXNRD1: 0.27; TXNRD2: 0.40; SEPP1: 0.61).
Lineage-specific distribution of elements
To identify lineage-specific patterns, i.e. whether some elements were significantly higher or lower in a particular group of related species, we quantified the phylogenetic signal using Pagel's lambda and Blomberg's K (Revell, 2012), and performed phylogenetic ANOVA (Harmon et al., 2008) to explicitly test for differential distribution in a particular taxonomical order or family.
Mg, S, P, and K in brain exhibited significant phylogenetic signals (Figure 3A). They were also enriched in the brain of rodents compared to non-rodents (Table S3; phylogenetic ANOVA p value < 0.05 for Mg, S, K and 0.07 for P). The distribution patterns were very similar between Mg and S as well as between K and P, supporting our observation above that these elements clustered with strong correlation (Figure 2).
Figure 3. Lineage specific distribution of elements.
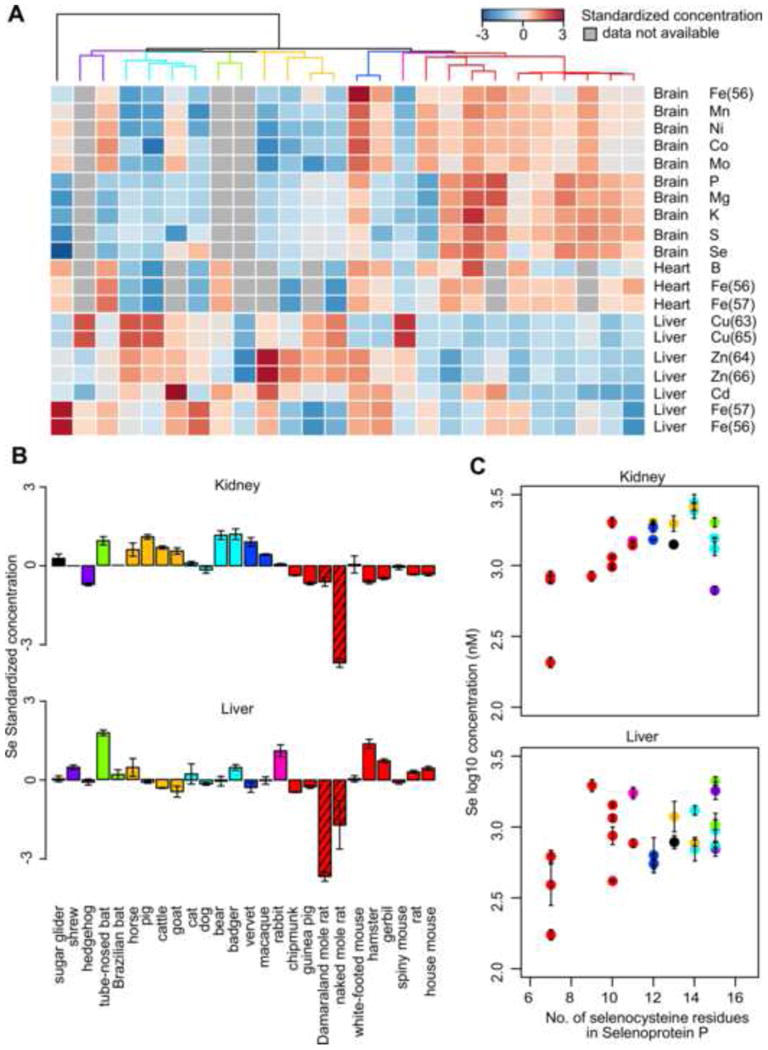
(A) Elements with significant phylogenetic signals. The grids are colored based on the standardized concentration and the columns are arranged by phylogenetic relationship (see Figure 1A). Only those elements with p values < 0.05 for both Pagel's λ and Blomberg's K are shown.
(B) Low kidney and liver Se in African mole rats. The error bars represent standard error. The bars corresponding to the naked mole rat and Damaraland mole rat are shaded.
(C) Kidney and liver Se levels correlate with the number of Sec residues in selenoprotein P. The error bars represent standard error. The points are colored by taxonomical order. Pearson correlation coefficient: (C) 0.62 for kidney and (D) 0.42 for liver. See Figure S4 for more details.
Among the animals examined were two species of desert-dwelling African mole rats (the naked mole rat and the Damaraland mole rat), whose genetic and physiological features are quite distinct from other rodents (Fang et al., 2014; Kim et al., 2011; LaVinka and Park, 2012; Maina et al., 2001). In particular, naked mole rats face significant oxidative stress, even though they are the longest lived rodents (Andziak et al., 2006; Buffenstein, 2005). In terms of element distribution, both had significantly lower levels of Se in kidney and liver than all other species (Figure 3B and Table S3; phylogenetic ANOVA p value=0.007 for kidney and 0.005 for liver), and to a lesser extent, than other rodents (p value=0.13 for kidney and 0.16 for liver). Se levels and glutathione peroxidase activity (Andziak et al., 2005; Malinouski et al., 2012) are lower in the naked mole rat liver and kidney than in mouse tissues, in part due to an early stop codon in the sequence coding for GPX1 (Kasaikina et al., 2011). The same early stop codon is also found in Damaraland mole rat (Fang et al., 2014).
Mammalian selenoproteomes consist of 24-25 selenoproteins (Kryukov et al., 2003). Selenoprotein mRNAs have a structure called SECIS element that supports co-translational insertion of Sec at UGA codon. While most selenoproteins contain only single Sec residue, the number of Sec residues in plasma selenoprotein P (SelP, coded by SEPP1) vary greatly across different organisms (Lobanov et al., 2008). All but one of these Sec residues are found in the C-terminal region and SelP is involved in the transport of Se throughout the body. We observed the number of Sec residues in SelP correlated remarkably with the measured Se levels in kidney and liver (Figure 3D and S4; Pearson correlation coefficient = 0.62 for kidney and 0.42 for liver). For example, both naked mole rat and Damaraland mole rat had only 7 Sec residues and contained very little Se in kidney and liver, whereas pig, the carnivores (dog, bear, and badger), and the bats had 14-16 Sec residues in SelP and relatively high Se levels in both organs (Figure S4). Thus, the use of Se in mammals is tuned by altering the number of Sec residues in the C-terminal region of SelP.
Nature alters elemental composition to adjust lifespan and body mass
To understand the relationship between element levels and longevity, we obtained the lifespan data from AnAge database (Tacutu et al., 2013) and performed regression analysis using generalized least squares, to account for the phylogenetic relatedness of species and incorporate the measurement errors (Felsenstein, 1985; Grafen, 1989; Ives et al., 2007). We focused on adult weight as well as 4 longevity traits: Maximum Lifespan (ML), Maximum Lifespan Residual (MLres), Female Time to Maturity (FTM), and Female Time to Maturity Residual (FTMres) (Table S1). FTM was used as an alternative measure for longevity, since it is easier to quantify and less prone to reporting bias than ML (Pearson correlation coefficient between ML and FTM = 0.84, p value < 10-7). The residuals (MLres and FTMres) describe the portion of the trait that has not been accounted for by body mass. We evaluated different evolutionary models, selected the best-fit model by maximum likelihood, and reported the slope coefficient and p value (Figure 4A, Table S4; Experimental Procedure). A two-step verification procedure (Ma et al., 2015) was applied to remove potential outliers and ensure the results were generalizable (Experimental Procedure).
Figure 4. Elements correlating with life history traits.
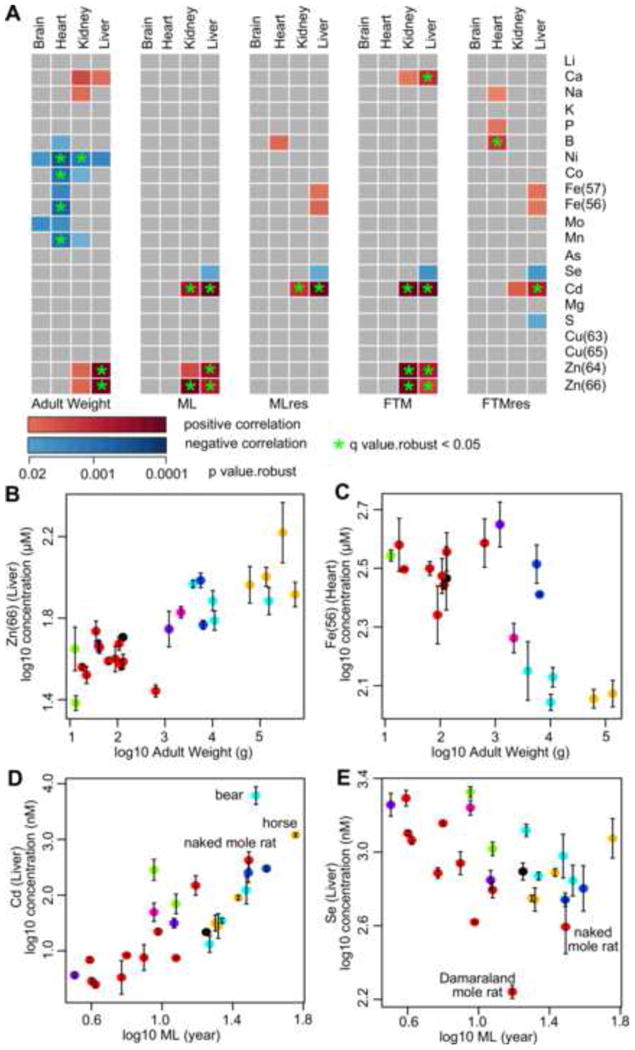
(A) Correlation of elements in each organ with Adult Weight, Maximum Lifespan (ML), Maximum Lifespan Residual (MLres), Female Time to Maturity (FTM), and Female Time to Maturity Residual (FTMres). Only those with regression p value.robust < 0.02 are indicated in colors: red – positive correlation; blue – negative correlation (see Table S4 for more details). Green asterisks indicate those with q value.robust < 0.05.
Adult Weight correlates (B) positively with liver Zn level and (C) negatively with heart Fe level. The error bars represent standard error (already incorporated in regression calculation). The points are colored by taxonomical order. (B) p value.all = 4.41×10⁻⁷; q value.all = 9.25×10⁻⁵; p value.robust = 4.15×10⁻⁹; q value.robust = 1.70×10⁻⁸; p value.max = 2.48×10⁻⁷; q value.max = 1.04×10⁻⁴. (C) p value.all = 4.91×10⁻⁴; q value.all = 0.0187; p value.robust = 6.00×10⁻⁴; q value.robust = 0.0194; p value.max = 1.21×10⁻³; q value.max = 0.036.
Maximum Lifespan correlates (D) positively with liver Cd level and (E) negatively with liver Se level. Selected species are indicated. (D) p value.all = 4.28×10⁻⁶; q value.all = 4.49×10⁻⁴; p value.robust = 5.63×10⁻⁶; q value.robust = 4.73×10⁻⁴; p value.max = 2.50×10⁻⁶; q value.max = 2.10×10⁻⁴. (E) p value.all = 0.0331; q value.all = 0.266; p value.robust = 0.0126; q value.robust = 0.120; p value.max = 0.0335; q value.max = 0.285.
In terms of body mass, liver Zn level showed a strong positive correlation (Figure 4B; p value.robust = 4.15×10⁻⁹ for 64Zn and 1.70×10⁻⁸ for 66Zn; q value.robust < 10-5 for both), whereas negative correlations were observed for Fe, Mn, Co and Ni, especially in heart tissue (Figure 4C). In terms of longevity, Zn levels in liver and kidney showed strong, positive correlations with ML and FTM. However, the relationships became much weaker in MLres and FTMres, suggesting the observed correlation is largely due to the effects of body mass.
Cd levels in liver and kidney correlated positively with all four measures of longevity (Figure 4A), with a particularly robust relationship in liver (q value.robust < 0.05 in all four measures). While the Cd levels might potentially be affected by diets, the correlation remained statistically significant when we methodically left out each species one at a time (Table S4). As there has been no known biological role for Cd in mammals, the result was somewhat unexpected. Since Cd mostly comes from the soil or food, one possibility is that longer lived/larger mammals simply consume a greater amount of food over their life time and, as they cannot efficiently excrete this metal, accumulate more Cd. Among our samples, the liver Cd levels were highest in horse and bear, both of which were large and long-lived (Figure 4D). The naked mole rat, being the longest-lived rodent, also had a much higher liver Cd level than other rodents of comparable sizes. The observation is unlikely to simply reflect the higher heavy metal content of soils either, for another strictly subterranean solitary Bathyergid rodent (but shorter-lived than the naked mole rat), the silvery mole-rat Heliophobius, has relatively low levels of Cd in liver tissue (Sumbera et al., 2003).
Liver Se was the only element correlating negatively with all four measures of longevity, although the correlations were relatively weak (Figure 4E and Table S4; p value.robust = 0.013 for ML, 0.015 for MLres, 0.006 for FTM, and 0.007 for FTMres). Even when the points corresponding to the African mole rats were excluded, we still observed a negative correlation with ML (p value = 0.028). Selenoproteins are important cellular redox regulators, whose changes may affect redox homeostasis and DNA mutation rates. Interestingly, the long-lived naked mole rat may experience significant oxidative stress in captivity (Andziak et al., 2006) and limit both GPX1 expression and GPX activity (Andziak et al., 2005; Kasaikina et al., 2011; Kim et al., 2011). Excessive intake of Se is toxic and can lead to selenosis. Therefore, there is a delicate balance between the beneficial aspects of Se, its toxicity, and other systems that support maintenance functions.
Discussion
Prior to this study, it has been unclear how evolutionary processes adjust the ionomes across mammalian species and organs according to phylogeny, longevity and body mass. We were able to offer new insights on elemental composition of organs and species, identify common and distinct patterns of element utilization, and link these findings to physiological functions. The elements clustered as macronutrients, transition metals or toxic elements, suggesting they are handled by mammals using common strategies based on their biological functions. Some elements also showed lineage-specific changes, including decreased utilization of Se in African mole rats, and a strong link between the number of Sec residues in SelP and the kidney and liver Se levels across mammals. In addition, we found that lifespan of mammals was positively linked with Cd tissue levels and negatively linked with Se in liver. Some elements, such as Zn, showed a positive association with species body mass, whereas others, such as Ni, Co, Fe, and Mn, showed negative association.
The multiple associations and interactions among these elements revealed by our study would not have been possible without examining a wide spectrum of mammals and different organs. This approach can also offer valuable insights into the interaction between elements and environment, as previously demonstrated by similar studies in plants (Watanabe et al., 2007; White et al., 2012). When the same plant species were collected under different fertilizer treatments and environmental conditions, the concentrations of Ca, Zn, Mn and Mg were found to remain more closely linked to phylogeny. In contrast, the concentrations of Cu and Fe varied more strongly with environmental factors, suggesting different elements might be more or less responsive to external variations. In addition, related species may be exposed to similar environmental conditions, or may have similar detoxification abilities, either of which can drive the similarities in their ionomes and potentially confound the phylogenetic signals. Similar studies on a much larger scale will help determine the variability and elasticity of element levels in mammals under different dietary regimens. Overall, this study provided direct insights into how evolution may adjust the ionome of mammals according to organ physiology, phylogeny, environment, lineage specialization and life histories and may provide a useful predictive tool in future studies.
Experimental Procedures
Biological samples and element quantifications
Inductively-coupled plasma mass spectrometry (ICP-MS) was applied to characterize element levels in the brain, heart, kidney, and liver of 26 mammalian species. Guinea pig, rabbit, hamster, gerbil, and rat were from Charles River; mouse, Damaraland mole rat and naked mole rat were from our laboratories; and other species were as described previously (Fushan et al., 2015; Ma et al., 2015). The animals were young adults and, except for horse and vervet, all were males, with two to four biological replicates (tissues from different animals) for most species (Table S1). Whole liver, kidney, heart, or frontal parts of brain were frozen in liquid nitrogen and stored at -80°C until further use.
The concentrations of Li (nM), B (nM), Na (mM), Mg (μM), P (mM), S (mM), K (mM), Ca (μM), Mn (nM), Fe (μM), Co (nM), Ni (nM), Cu (μM), Zn (μM), As (nM), Se (nM), Mo (nM), and Cd (nM), per gram of tissue digested, were quantified with spike-in 50 μg/L Ga as internal control, using the sample preparation and data collection method described previously (Malinouski et al., 2014). Two isotopes were measured for Fe (56Fe, 57Fe), Cu (63Cu, 65Cu), and Zn (64Zn, 66Zn). The samples were subjected to four independent ICP-MS runs, each with three injections to each sample. Those injections with clearly abnormal results (i.e. reporting negative concentrations for most elements and differing significantly from the other runs of the same sample) were discarded (79 out of over 2600 injections, or ∼ 3%, were discarded this way) (Data S1).
Data processing
The results were log10-transformed and batch effect was removed using R package “sva” (Leek et al.) (Figure S1). The average values were computed across the four runs and the mean and standard errors were calculated across the replicates. For those without biological replicates, the standard error was taken as average standard error of the other samples. Over 90% of the measurements had coefficient of variation < 0.14 (Figure S1). Standardized concentrations (i.e. scaled to mean = 0 and standard deviation = 1) were used for cross-element analysis.
Element distribution in organs
Wilcoxon Rank-Sum Test was used to identify elements relatively enriched or depleted in a particular organ. Data from the same animal were considered as paired. For each element, the numbers of significant pair-wise comparisons (p value < 0.05) were tabulated. Enrichment or depletion was declared in an organ if at least two out of the three pair-wise comparisons were statistically significant.
Phylogenetic signals and phylogenetic ANOVA
Pagel's lambda and Blomberg's K were calculated using R package “phytools” (Revell, 2012), after incorporating standard error of measurement. Those elements with p value < 0.05 in both cases were considered to have significant phylogenetic signals. Phylogenetic ANOVA was performed using R package “geiger” (Harmon et al., 2008). The species were grouped and compared according to their taxonomical orders or families.
Regression by generalized least square
The generalized least squares approach was implemented to identify elements with significant correlation to the given traits. In constructing the variance-covariance matrix, 4 different models of trait evolutions (“Null”, “BM”, “Pagel”, and “OU”) were tested (Ma et al., 2015); the best fit model was selected based on maximum likelihood. Standard errors of measurement were also incorporated in the variance-covariance matrix (Ives et al., 2007). The regression slope coefficient and p value were reported (“Slope.all” and “p value.all”) and False Discovery Rate adjustment (“q value.all”) was applied to account for multiple testing.
Robustness of results
To verify that the regression relationship was robust, two verification steps were used as previously described (Ma et al., 2015). Briefly, the point with largest residual error was first identified and removed; and the regression slope coefficient, p value, and q value of the remaining species were reported (“Slope.robust”, “p value.robust”, and “q value.robust”, respectively). Next, each of the species was left out, one at a time, and the maximal (i.e. least significant) regression p value was calculated (“p value.max”) and adjusted (“q value.max”). This ensured our findings were neither skewed by a single outlier, nor dependent on a particular species.
Supplementary Material
Acknowledgments
Supported by NIH AG047745, AG047200, CA080946 and GM061603, and the WCU Program R31-2008-000-10010-0. We thank Anton Turanov and Sun Hee Yim for help with sample collection or preparation.
Footnotes
Publisher's Disclaimer: This is a PDF file of an unedited manuscript that has been accepted for publication. As a service to our customers we are providing this early version of the manuscript. The manuscript will undergo copyediting, typesetting, and review of the resulting proof before it is published in its final citable form. Please note that during the production process errors may be discovered which could affect the content, and all legal disclaimers that apply to the journal pertain.
Author contribution: V.N.G. coordinated the study. S.M. carried out data analyses. S.G.L., E.B.K., T.J.P., A.S. V.G. and R.B. provided, collected and prepared samples. J.S. carried out ICP-MS measurements. All authors contributed to data interpretation. S.M. and V.N.G. wrote the paper with input from all authors.
References
- Amaravadi R, Glerum DM, Tzagoloff A. Isolation of a cDNA encoding the human homolog of COX17, a yeast gene essential for mitochondrial copper recruitment. Hum Genet. 1997;99:329–333. doi: 10.1007/s004390050367. [DOI] [PubMed] [Google Scholar]
- Andziak B, O'Connor TP, Buffenstein R. Antioxidants do not explain the disparate longevity between mice and the longest-living rodent, the naked mole-rat. Mech Ageing Dev. 2005;126:1206–1212. doi: 10.1016/j.mad.2005.06.009. [DOI] [PubMed] [Google Scholar]
- Andziak B, O'Connor TP, Qi W, DeWaal EM, Pierce A, Chaudhuri AR, Van Remmen H, Buffenstein R. High oxidative damage levels in the longest-living rodent, the naked mole-rat. Aging Cell. 2006;5:463–471. doi: 10.1111/j.1474-9726.2006.00237.x. [DOI] [PubMed] [Google Scholar]
- Buffenstein R. The naked mole-rat: a new long-living model for human aging research. J Gerontol A Biol Sci Med Sci. 2005;60:1369–1377. doi: 10.1093/gerona/60.11.1369. [DOI] [PubMed] [Google Scholar]
- Clemens S, Aarts MG, Thomine S, Verbruggen N. Plant science: the key to preventing slow cadmium poisoning. Trends Plant Sci. 2013;18:92–99. doi: 10.1016/j.tplants.2012.08.003. [DOI] [PubMed] [Google Scholar]
- Eide DJ. Zinc transporters and the cellular trafficking of zinc. Biochim Biophys Acta. 2006;1763:711–722. doi: 10.1016/j.bbamcr.2006.03.005. [DOI] [PubMed] [Google Scholar]
- Eide DJ, Clark S, Nair TM, Gehl M, Gribskov M, Guerinot ML, Harper JF. Characterization of the yeast ionome: a genome-wide analysis of nutrient mineral and trace element homeostasis in Saccharomyces cerevisiae. Genome Biol. 2005;6:R77. doi: 10.1186/gb-2005-6-9-r77. [DOI] [PMC free article] [PubMed] [Google Scholar]
- Fang X, Seim I, Huang Z, Gerashchenko MV, Xiong Z, Turanov AA, Zhu Y, Lobanov AV, Fan D, Yim SH, et al. Adaptations to a subterranean environment and longevity revealed by the analysis of mole rat genomes. Cell Rep. 2014;8:1354–1364. doi: 10.1016/j.celrep.2014.07.030. [DOI] [PMC free article] [PubMed] [Google Scholar]
- Felsenstein J. Phylogenies and the Comparative Method. Am Nat. 1985;125:1–15. [Google Scholar]
- Fraga CG. Relevance, essentiality and toxicity of trace elements in human health. Mol Aspects Med. 2005;26:235–244. doi: 10.1016/j.mam.2005.07.013. [DOI] [PubMed] [Google Scholar]
- Fushan AA, Turanov AA, Lee SG, Kim EB, Lobanov AV, Yim SH, Buffenstein R, Lee SR, Chang KT, Rhee H, et al. Gene expression defines natural changes in mammalian lifespan. Aging Cell. 2015;14:352–365. doi: 10.1111/acel.12283. [DOI] [PMC free article] [PubMed] [Google Scholar]
- Goldhaber SB. Trace element risk assessment: essentiality vs toxicity. Regul Toxicol Pharmacol. 2003;38:232–242. doi: 10.1016/s0273-2300(02)00020-x. [DOI] [PubMed] [Google Scholar]
- Grafen A. The phylogenetic regression. Philos Trans R Soc Lond B Biol Sci. 1989;326:119–157. doi: 10.1098/rstb.1989.0106. [DOI] [PubMed] [Google Scholar]
- Gunshin H, Mackenzie B, Berger UV, Gunshin Y, Romero MF, Boron WF, Nussberger S, Gollan JL, Hediger MA. Cloning and characterization of a mammalian proton-coupled metal-ion transporter. Nature. 1997;388:482–488. doi: 10.1038/41343. [DOI] [PubMed] [Google Scholar]
- Hamza I, Chauhan S, Hassett R, O'Brian MR. The bacterial irr protein is required for coordination of heme biosynthesis with iron availability. J Biol Chem. 1998;273:21669–21674. doi: 10.1074/jbc.273.34.21669. [DOI] [PubMed] [Google Scholar]
- Hamza I, Schaefer M, Klomp LW, Gitlin JD. Interaction of the copper chaperone HAH1 with the Wilson disease protein is essential for copper homeostasis. Proc Natl Acad Sci USA. 1999;96:13363–13368. doi: 10.1073/pnas.96.23.13363. [DOI] [PMC free article] [PubMed] [Google Scholar]
- Harmon LJ, Weir JT, Brock CD, Glor RE, Challenger W. GEIGER: investigating evolutionary radiations. Bioinformatics. 2008;24:129–131. doi: 10.1093/bioinformatics/btm538. [DOI] [PubMed] [Google Scholar]
- Hill GM, Link JE. Transporters in the absorption and utilization of zinc and copper. J Anim Sci. 2009;87:E85–89. doi: 10.2527/jas.2008-1341. [DOI] [PubMed] [Google Scholar]
- Holm RH, Kennepohl P, Solomon EI. Structural and Functional Aspects of Metal Sites in Biology. Chem Rev. 1996;96:2239–2314. doi: 10.1021/cr9500390. [DOI] [PubMed] [Google Scholar]
- Hurst R, Siyame EW, Young SD, Chilimba AD, Joy EJ, Black CR, Ander EL, Watts MJ, Chilima B, Gondwe J, et al. Soil-type influences human selenium status and underlies widespread selenium deficiency risks in Malawi. Sci Rep. 2013;3:1425. doi: 10.1038/srep01425. [DOI] [PMC free article] [PubMed] [Google Scholar]
- Ives AR, Midford PE, Garland T. Within-Species Variation and Measurement Error in Phylogenetic Comparative Methods. Syst Biol. 2007;56:252–270. doi: 10.1080/10635150701313830. [DOI] [PubMed] [Google Scholar]
- Kasaikina MV, Lobanov AV, Malinouski MY, Lee BC, Seravalli J, Fomenko DE, Turanov AA, Finney L, Vogt S, Park TJ, et al. Reduced utilization of selenium by naked mole rats due to a specific defect in GPx1 expression. J Biol Chem. 2011;286:17005–17014. doi: 10.1074/jbc.M110.216267. [DOI] [PMC free article] [PubMed] [Google Scholar]
- Katoh Y, Sato T, Yamamoto Y. Determination of multielement concentrations in normal human organs from the Japanese. Biol Trace Elem Res. 2002;90:57–70. doi: 10.1385/BTER:90:1-3:57. [DOI] [PubMed] [Google Scholar]
- Kim EB, Fang X, Fushan AA, Huang Z, Lobanov AV, Han L, Marino SM, Sun X, Turanov AA, Yang P, et al. Genome sequencing reveals insights into physiology and longevity of the naked mole rat. Nature. 2011;479:223–227. doi: 10.1038/nature10533. [DOI] [PMC free article] [PubMed] [Google Scholar]
- Kryukov GV, Castellano S, Novoselov SV, Lobanov AV, Zehtab O, Guigo R, Gladyshev VN. Characterization of mammalian selenoproteomes. Science. 2003;300:1439–1443. doi: 10.1126/science.1083516. [DOI] [PubMed] [Google Scholar]
- LaVinka PC, Park TJ. Blunted behavioral and c Fos responses to acidic fumes in the African naked mole-rat. PLoS One. 2012;7:e45060. doi: 10.1371/journal.pone.0045060. [DOI] [PMC free article] [PubMed] [Google Scholar]
- Leek JT, Johnson WE, Parker HS, Jaffe AE, Storey JD. sva: Surrogate Variable Analysis. 2014 R package version 3.10.0. [Google Scholar]
- Liuzzi JP, Cousins RJ. Mammalian zinc transporters. Annu Rev Nutr. 2004;24:151–172. doi: 10.1146/annurev.nutr.24.012003.132402. [DOI] [PubMed] [Google Scholar]
- Lobanov AV, Hatfield DL, Gladyshev VN. Reduced reliance on the trace element selenium during evolution of mammals. Genome Biol. 2008;9:R62. doi: 10.1186/gb-2008-9-3-r62. [DOI] [PMC free article] [PubMed] [Google Scholar]
- Ma S, Yim SH, Lee SG, Kim EB, Lee SR, Chang KT, Buffenstein R, Lewis KN, Park TJ, Miller RA, et al. Organization of the Mammalian Metabolome according to Organ Function, Lineage Specialization, and Longevity. Cell Metab. 2015;22:332–343. doi: 10.1016/j.cmet.2015.07.005. [DOI] [PMC free article] [PubMed] [Google Scholar]
- Mackenzie B, Takanaga H, Hubert N, Rolfs A, Hediger MA. Functional properties of multiple isoforms of human divalent metal-ion transporter 1 (DMT1) Biochem J. 2007;403:59–69. doi: 10.1042/BJ20061290. [DOI] [PMC free article] [PubMed] [Google Scholar]
- Maina JN, Gebreegziabher Y, Woodley R, Buffenstein R. Effects of change in environmental temperature and natural shifts in carbon dioxide and oxygen concentrations on the lungs of captive naked mole-rats (Heterocephalus glaber): a morphological and morphometric study. J Zool. 2001;253:371–382. [Google Scholar]
- Malinouski M, Hasan NM, Zhang Y, Seravalli J, Lin J, Avanesov A, Lutsenko S, Gladyshev VN. Genome-wide RNAi ionomics screen reveals new genes and regulation of human trace element metabolism. Nat Commun. 2014;5:3301. doi: 10.1038/ncomms4301. [DOI] [PMC free article] [PubMed] [Google Scholar]
- Malinouski M, Kehr S, Finney L, Vogt S, Carlson BA, Seravalli J, Jin R, Handy DE, Park TJ, Loscalzo J, et al. High-resolution imaging of selenium in kidneys: a localized selenium pool associated with glutathione peroxidase 3. Antioxid Redox Signal. 2012;16:185–192. doi: 10.1089/ars.2011.3997. [DOI] [PMC free article] [PubMed] [Google Scholar]
- Mendel RR, Bittner F. Cell biology of molybdenum. Biochim Biophys Acta. 2006;1763:621–635. doi: 10.1016/j.bbamcr.2006.03.013. [DOI] [PubMed] [Google Scholar]
- Ozaki T, Enomoto S, Minai Y, Ambe S, Makide Y. A survey of trace elements in pteridophytes. Biol Trace Elem Res. 2000;74:259–273. doi: 10.1385/BTER:74:3:259. [DOI] [PubMed] [Google Scholar]
- Revell LJ. phytools: an R package for phylogenetic comparative biology (and other things) Methods Ecol Evol. 2012;3:217–223. [Google Scholar]
- Roth JA. Homeostatic and toxic mechanisms regulating manganese uptake, retention, and elimination. Biol Res. 2006;39:45–57. doi: 10.4067/s0716-97602006000100006. [DOI] [PubMed] [Google Scholar]
- Salt DE, Baxter I, Lahner B. Ionomics and the study of the plant ionome. Annu Rev Plant Biol. 2008;59:709–733. doi: 10.1146/annurev.arplant.59.032607.092942. [DOI] [PubMed] [Google Scholar]
- Sumbera R, Barus V, Tenora F. Heavy metals in the silvery mole-rat, Heliophobius argenteocinereus (Bathyergidae, Rodentia) from Malawi. Folia Zool. 2003;52:149–153. [Google Scholar]
- Tacutu R, Craig T, Budovsky A, Wuttke D, Lehmann G, Taranukha D, Costa J, Fraifeld VE, de Magalhaes JP. Human Ageing Genomic Resources: integrated databases and tools for the biology and genetics of ageing. Nucleic Acids Res. 2013;41:D1027–1033. doi: 10.1093/nar/gks1155. [DOI] [PMC free article] [PubMed] [Google Scholar]
- Waldron KJ, Robinson NJ. How do bacterial cells ensure that metalloproteins get the correct metal? Nat Rev Microbiol. 2009;7:25–35. doi: 10.1038/nrmicro2057. [DOI] [PubMed] [Google Scholar]
- Watanabe T, Broadley MR, Jansen S, White PJ, Takada J, Satake K, Takamatsu T, Tuah SJ, Osaki M. Evolutionary control of leaf element composition in plants. New Phytol. 2007;174:516–523. doi: 10.1111/j.1469-8137.2007.02078.x. [DOI] [PubMed] [Google Scholar]
- White PJ, Broadley MR, Thompson JA, McNicol JW, Crawley MJ, Poulton PR, Johnston AE. Testing the distinctness of shoot ionomes of angiosperm families using the Rothamsted Park Grass Continuous Hay Experiment. New Phytol. 2012;196:101–109. doi: 10.1111/j.1469-8137.2012.04228.x. [DOI] [PubMed] [Google Scholar]
- Zhang Y, Gladyshev VN. Comparative genomics of trace elements: emerging dynamic view of trace element utilization and function. Chem Rev. 2009;109:4828–4861. doi: 10.1021/cr800557s. [DOI] [PubMed] [Google Scholar]
- Zhang Y, Rodionov DA, Gelfand MS, Gladyshev VN. Comparative genomic analyses of nickel, cobalt and vitamin B12 utilization. BMC Genomics. 2009;10:78. doi: 10.1186/1471-2164-10-78. [DOI] [PMC free article] [PubMed] [Google Scholar]
Associated Data
This section collects any data citations, data availability statements, or supplementary materials included in this article.