Abstract
Purpose
We determined if the Bruch's membrane opening (BMO) location changes over time in healthy eyes and eyes with progressing glaucoma, and validated an automated segmentation algorithm for identifying the BMO in Cirrus high-definition coherence tomography (HD-OCT) images.
Methods
We followed 95 eyes (35 progressing glaucoma and 60 healthy) for an average of 3.7 ± 1.1 years. A stable group of 50 eyes had repeated tests over a short period. In each B-scan of the stable group, the BMO points were delineated manually and automatically to assess the reproducibility of both segmentation methods. Moreover, the BMO location variation over time was assessed longitudinally on the aligned images in 3D space point by point in x, y, and z directions.
Results
Mean visual field mean deviation at baseline of the progressing glaucoma group was −7.7 dB. Mixed-effects models revealed small nonsignificant changes in BMO location over time for all directions in healthy eyes (the smallest P value was 0.39) and in the progressing glaucoma eyes (the smallest P value was 0.30). In the stable group, the overall intervisit–intraclass correlation coefficient (ICC) and coefficient of variation (CV) were 98.4% and 2.1%, respectively, for the manual segmentation and 98.1% and 1.9%, respectively, for the automated algorithm
Conclusions
Bruch's membrane opening location was stable in normal and progressing glaucoma eyes with follow-up between 3 and 4 years indicating that it can be used as reference point in monitoring glaucoma progression. The BMO location estimation with Cirrus HD-OCT using manual and automated segmentation showed excellent reproducibility.
Keywords: glaucoma, BMO location variation, reference plane, automated segmentation
Spectral-domain optical coherence tomography (SD-OCT) advances have brought a significant improvement in image capture speed and resolution, and exhibit many characteristics of a good diagnostic tool, including high sensitivity and specificity, good reproducibility, ability to detect change over time, simplicity in use and interpretation, and convenience for patient and physician. Because early diagnosis of glaucoma and detection of its progression through subtle changes in the optic nerve head (ONH) measurements may be useful for glaucoma diagnosis and management, the ability of such measurements to detect glaucomatous change must be studied before these measurements can be used for detection of progression.
Several studies have shown that Bruch's membrane opening (BMO; i.e., the termination of Bruch membrane layer) can be used as a reference from which lamina cribrosa (LC) and ONH parameters can be estimated.1–3 For example, rim width estimation requires segmentation of the BMO and internal limiting membrane (ILM) layer. In particular, it has been shown that the minimum distance from BMO to the ILM can be used as an accurate estimate of minimum rim width to discriminate glaucoma patients from healthy subjects.4 Moreover, many histologic studies of humans and animals as well as experimental animal models based on IOP elevation have shown that eyes in early stage of glaucoma often have posterior LC displacement.5 Studies propose the anterior LC surface depth (ALCSD) measurement to model such displacement.6,7 The ALCSD parameter is defined as the average perpendicular distance from the anterior LC surface (i.e., the surface separating the prelaminar tissue and LC structure) relative to BMO-based reference plane. Because many ONH parameters used for glaucoma diagnosis or glaucoma progression monitoring are based on the assumption that the BMO is stable over time, it is important to determine whether the BMO location changes with age or severity of glaucoma.
Recently, Johnstone et al.8 reported that the BMO is located more posteriorly in older individuals compared to younger individuals based on a cross-sectional analysis that included a total of 168 eyes from 84 study subjects. They suggested that these differences were explained by the fact that the BMO migrates posteriorly with age due to age-related choroidal thinning. As they suggest, these results must be confirmed in longitudinal cohorts.
We determined if the BMO location changes over time in healthy eyes and eyes with progressing glaucoma and validated the custom San Diego automated layer segmentation algorithm (SALSA) by comparing the reproducibility of automated and manual BMO segmentation results with Cirrus HD-OCT optic disc cube scans.
Methods
Subjects
Patients with primary open–angle glaucoma and healthy subjects included in this study were recruited from the Diagnostic Innovations in Glaucoma Study (DIGS) conducted at the Hamilton Glaucoma Center (University of California, San Diego [UCSD], CA, USA). The DIGS methodological details have been described previously.9 In brief, for glaucoma subjects, inclusion criteria were 20/40 or better best-corrected visual acuity, spherical refraction within ±5.0 diopters (D), cylinder correction within ±3.0 D, open–angles on gonioscopy, and at least 2 consecutive and reliable standard automated perimetry (SAP) examinations with either a pattern standard deviation (PSD) or a glaucoma hemifield test (GHT) result outside the 99% normal limits. Exclusion criteria were eyes with coexisting retinal disease and eyes with nonglaucomatous optic neuropathy.
For healthy subjects, inclusion criteria were 20/40 or better best-corrected visual acuity, spherical refraction within ±5.0 D, cylinder correction within ±3.0 D, IOP < 22 mm Hg with no history of elevated IOP, and at least 2 reliable normal visual fields, defined as a PSD within 95% confidence limits and a GHT result within normal limits.
In this report, we included 3 groups of participants. The first group was composed of 35 eyes of 32 glaucoma patients with progressing glaucoma from the DIGS cohort followed for an average of 3.9 ± 0.8 years. Participants had normal SAP at baseline. Progression was defined as development of repeatable abnormal SAP on three consecutive visits or glaucomatous progressive optic disc changes based on standard assessment of simultaneous stereo photographs of the optic disc by two independent graders.9 All eyes were followed at approximately 6-month intervals with SAP and OCT testing, and were required to have a minimum of 5 SAP and 5 OCTs during follow-up for inclusion in this study (test range, 5–10).
A second group of 50 eyes from 27 stable glaucoma patients was used to evaluate the reproducibility of BMO location estimation using the manual segmentation and SALSA algorithm. This set consisted of eyes with three serial OCT exams imaged every week for 3 weeks.
A third group of 60 eyes from 31 healthy subjects followed for an average of 3.6 ± 0.9 years was used to evaluate the effect of aging on BMO location. All eyes were followed at approximately 6-month intervals with SAP and OCT testing, and had an average of 6 ± 1.5 tests acquired during follow-up (test range, 5–9). Healthy participants were recruited from the general population through advertisement, from referring practices and from the staff and employees at Shiley Eye Institute.
Informed consent was obtained from all participants. The UCSD Institutional Review Board (IRB) approved the study methodologies, and all methods adhered to the Declaration of Helsinki guidelines for research in human subjects and the Health Insurance Portability and Accountability Act (HIPAA).
Imaging and Preprocessing
All subjects were imaged with the Cirrus HD-OCT 4000 (Carl Zeiss Meditec, Dublin, CA, USA) 200 × 200 optic disc scan and analyzed with software (version 6.5.0.772). The Cirrus HD-OCT acquires 27,000 axial scans (a-scans) per second, and has a 5 μm depth resolution in tissue. After the scanning process was completed, the instrument's 840-nm wavelength laser beam generated a cube of data measuring 6 × 6 mm after scanning a series of 200 B-scans with 200 A-scans per B-scan and each A-scan consists of 1024 voxels within a cube measuring 6 × 6 × 2 mm. The x–y registration is performed by the built-in instrument algorithm using the blood vessels in the enface image, which has the benefit of not introducing bias into the estimate of the variation in BMO location because the registration is performed on the enface image and not on each individual b-scan. Moreover, the x–y registration is necessary to ensure that we are comparing the same region over time. With respect to the z-axis, custom free field registration and segmentation software was used to segment and align the sclera, outer plexiform layer (OPL), and external limiting membrane layer (ELM) of the follow-up images to the baseline images.
To assess the accuracy of the automated z-axis alignment, a grader manually delineated the ELM, OPL, and the sclera layers on at least 10 B-scans on each eye of the progressing glaucoma group. Moreover, we normalized the follow-up images to the baseline for the magnification variation by using the SLO images. Specifically, the widths of the large vessel were used as an indicator of the magnification coefficient. Across the three groups, the magnification errors were small; the magnification coefficient (mean [95% CI]) was 0.99 (0.97–1.02). A magnification coefficient equaling 1 means that there was no magnification error. Quality assessment of OCT scans was evaluated by Imaging Data Evaluation and Assessment (IDEA) Center experienced examiners masked to the subject's results of the other tests. Good-quality scans had to have focused images from the ocular fundus and signal strength of greater than or equal to 7.9
SALSA Algorithm
Raw 3D Cirrus HD-OCT images were exported to a numerical computing language (MATLAB; MathWorks, Natick, MA, USA). The automated segmentation algorithm SALSA was used to automatically segment BMO in each eye of the three groups. Details of the SALSA have been described previously.10,11 Briefly, we assumed that each B-scan consists of several interretinal layers (e.g., BM layer, retinal nerve fiber layer [RNFL]). Because the interretinal layers have different thicknesses, each layer can be defined by a curve modeling its skeleton and a filter or set of filters modeling its thickness. To segment the different layers, it is sufficient to estimate their skeletons and the hyperparameters of the filters. In this study, we are only interested in the segmentation of the BM layer. To build connected skeletons, we considered an object-oriented approach rather than the voxel-oriented approach.12 Therefore, short segments (20 voxel in our case) are added to or deleted from the current configuration depending on their state (connected or not). Note that shorter segments have been considered in the termination of the skeletons for better estimation accuracy. The estimation of the model parameter and hyperparameters are addressed using a Monte Carlo Markov Chain.13 Once we estimated the BM layer separately in each of the 200 B-scans, we used the whole 3D volume to estimate the BMO points to take into account the planarity of the BMO points. Our aim is to properly integrate the elliptical shape of the BMO curve and to rely only on the reliable BMO points in the estimation scheme. Note that our aim is not to fit an ellipse to the data but to use the elliptical shape as a Bayesian “prior” shape to estimate the curve that best represents the data. An elegant way to address this task is to use the inverse artificial neural network ANN-PCA to model the elliptical shape of the BMO curve.14 To validate the BMO detection using SALSA and to estimate the reproducibility of the BMO position using the Cirrus HD-OCT, the positions of the BMO points first were identified manually by one operator in each eye of the stable group and then compared to the SALSA results.
Statistical Analysis
The absolute value of the differences, in voxels and micrometers, between SALSA and manual BMO segmentation location for x, y, and z-axes, denoted by ΔBMOx, ΔBMOy, and ΔBMOz, were calculated for each BMO point across all scans of each eye of the stable group. For manual and SALSA BMO identification methods, the total variability of the BMO location in the stable group was partitioned into two variance components: differences between subjects and differences between number of visits within subjects. The analysis was performed with a commercial statistical software package (SAS Institute, Inc., Cary, NC, USA) using the minimum norm quadratic unbiased estimation method. Reproducibility was assessed by calculating the intraclass correlation coefficient (ICC) and coefficient of variation (CV) for intervisit BMO location. The ICC is a statistic that summarizes the reproducibility of a measurement process for a given group of subjects. The maximum value of the ICC is 1 (or 100%). A measurement with a CV <5% was considered as having a good reproducibility.
Mixed-effects models were used to estimate the location variation of BMO during follow-up. The stability of the BMO location over time was assessed on a point by point basis in the 3D space without the need for a defined external reference. An advantage of using longitudinal over cross-sectional datasets is that all follow-up images are registered in the 3D space to the baseline on a point by point basis. Differences in the intercept and slope between healthy and progressing glaucoma eyes in x-, y-, and z-axes were modeled as fixed effects, and the individual distribution of intercept and slope between subjects were modeled as random effects. The sign of the slopes indicates the 3D shift direction of the BMO. For example, a negative slope in the z-axis means that the BMO shifts posteriorly. The model was adjusted for age and the correlation between eyes was accounted for in the model. In addition, the values of the slopes, in x-, y-, and z-axes, of the BMO location change over time in healthy and progressing glaucoma eyes were compared.
Results
The study included 35 eyes of 32 glaucoma patients with progressing glaucoma, 50 eyes from 27 with stable glaucoma, and 60 eyes from 31 healthy subjects. A summary of the demographic variables and measurements at baseline of each group are shown in Table 1. Progressing glaucoma patients were significantly older (P = 0.023) and had worse visual field mean deviation (MD; P < 0.001) than healthy subjects. The progressing glaucoma and healthy eye groups were similar in sex (P = 0.87), axial length (P = 0.83), disc area (P = 0.92), and length of follow-up (P = 0.29).
Table 1.
Baseline Characteristics of Study Subjects

BMO Reproducibility
Table 2 shows the absolute value of differences in voxels and micrometers between SALSA and manual BMO segmentation location for x-, y-, and z-axes using the scans of 50 eyes of the stable glaucoma group. The global mean values (± SD) of absolute value of the difference in the BMO location between the SALSA and manual assessment were ΔBMOx = 12 μm (±2.16), ΔBMOy = 10.5 μm (±2.79), and ΔBMOz = 5.8 μm (±1.68). However, Figure 1 shows that the distributions had a long positive tail. There was no statistically significant correlation between the manual and SALSA BMO detection and image signal strength in x- and y-axes (Spearman's ρ = 0.04, P = 0.32 and ρ = 0.12, P = 0.43, respectively) but the difference in z-axis tended to be larger in eyes with worse image quality (lower signal strength; Spearman's ρ = 0.1, P = 0.09). Figure 2 shows the manual and SALSA segmentation results on two B-scans.
Table 2.
The Absolute Value of the Differences in Voxels and Micrometers Between SALSA and Manual BMO Segmentation Location for x-, y-, and z-Axes (ΔBMOx, ΔBMOy, and ΔBMOz, Respectively) Using the 50 Eyes of the Stable Group
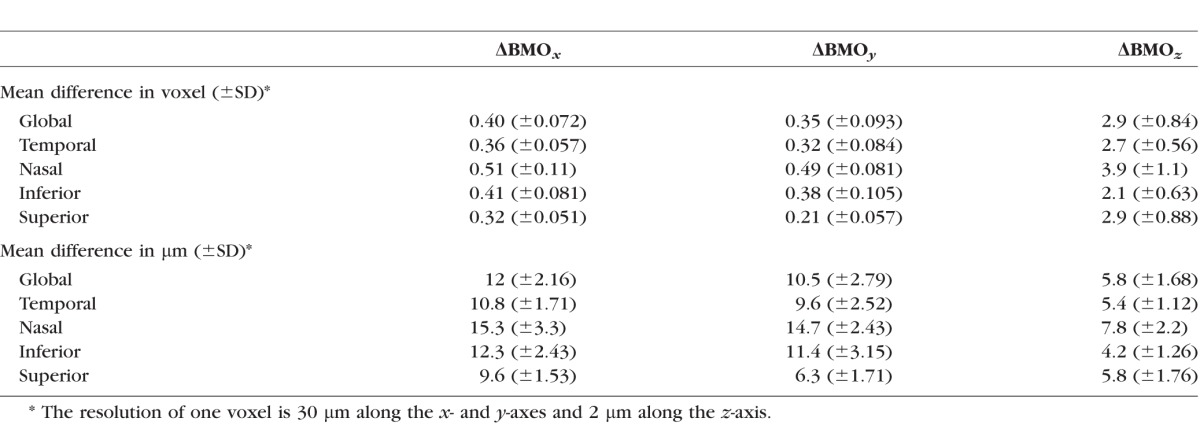
Figure 1.
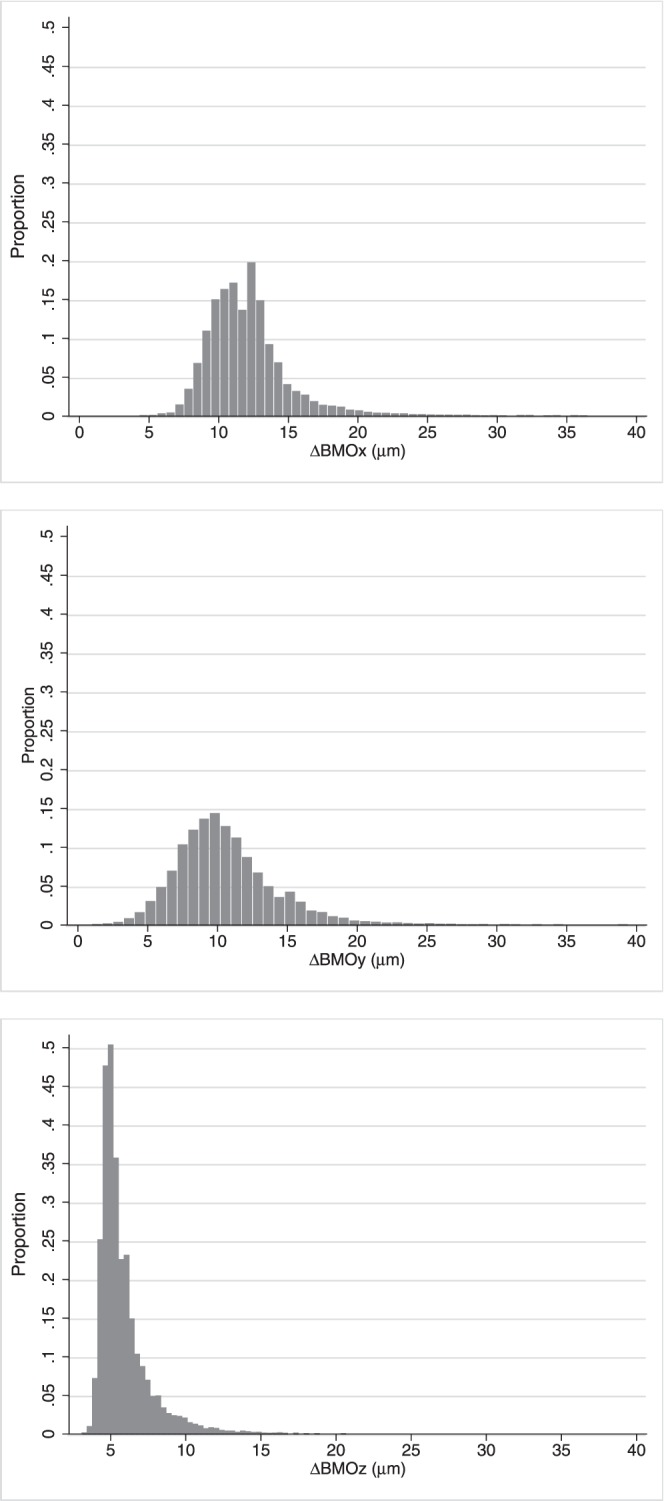
Distribution of the absolute value of the differences in micrometers between SALSA and manual BMO segmentation location for x-, y-, and z-axes (top to bottom, ΔBMOx, ΔBMOy, and ΔBMOz, respectively) using the 50 eyes of stable group.
Figure 2.
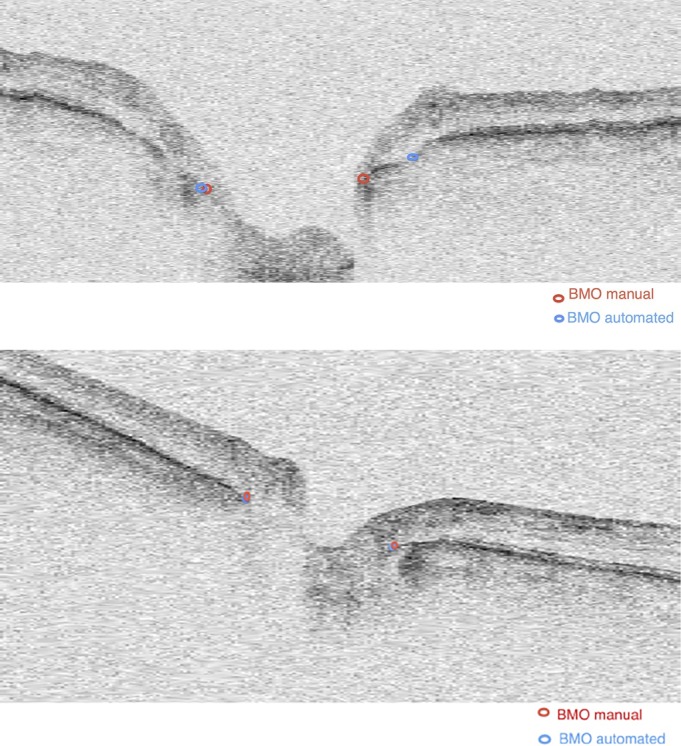
Examples of automated BMO segmentation. The red points are the manual segmentation results and the blue points are the automated segmentation results using SALSA algorithm. For the top image, the BMO failure of the SALSA is due to a disconnection of the BM layer. In the bottom image, manual and SALSA segmentation methods showed similar results.
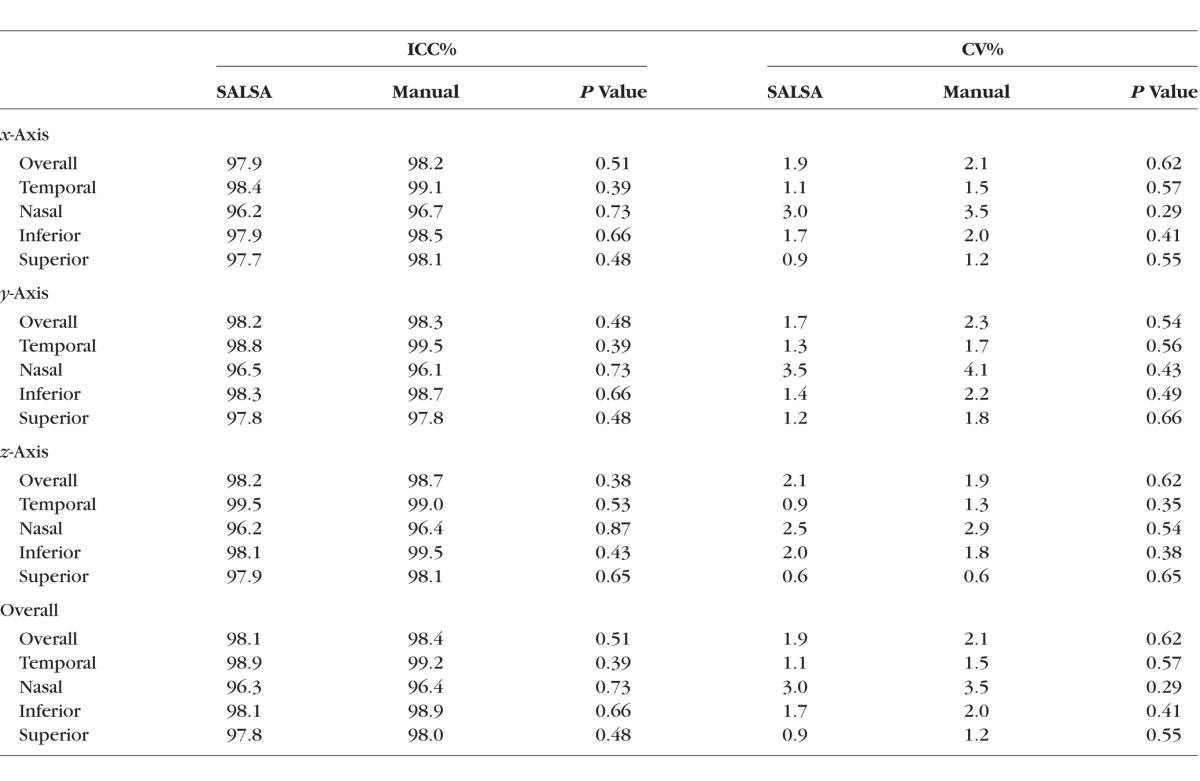
The ICCs and CVs calculated for x-, y-, and z-axes as well as the overall ICCs and CVs calculated across all axes are presented in Table 3. The overall ICCs were excellent for both segmentation methods, with 98.1% for the SALSA segmentation and 98.4% for the manual segmentation. Among quadrants (four equal 90° sectors), the nasal quadrant had the lowest ICC of 96.4% and 96.3% for the manual and SALSA segmentation, respectively. Coefficients of variation were all under 4%, with the highest values for nasal quadrant with 3.5% and 3.0% for the manual and SALSA segmentation, respectively.
Table 3.
The ICC and CV for BMO Location in Voxels Calculated Across the x-, y-, z-Axes and Overall Using Manual and SALSA Segmentation of the 50 Eyes of Stable Group
BMO Location Change Over Time
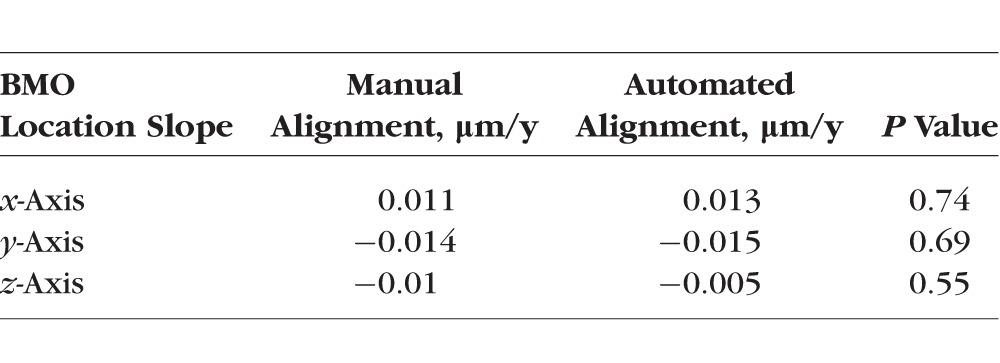
In healthy and progressing glaucomatous eyes, the change in BMO location along each of the three axes was small. Specifically, in healthy eyes, the mean change or slope (S) in BMO location along the x-, y-, and z-axes was 0.004 μm/y (95% CI, −0.069; 0.072, P = 0.39), 0.01 μm/y (95% CI, −0.070; 0.063, P = 0.41), and 0.011 μm/y (95% CI, −0.035; 0.055, P = 0.57), respectively. In progressing glaucoma eyes, the mean change in BMO location was 0.013 μm/y (95% CI, −0.056; 0.062, P = 0.42), −0.015 μm/y (95% CI, −0.068; 0.038, P = 0.30), and 0.005 μm/y, (95% CI, −0.040; 0.019, P = 0.38) respectively. There was no statistically significant difference in the BMO location slopes between both groups (x-axis, P = 0.41; y-axis, P = 0.66; and z-axis, P = 0.51). In the univariate mixed-effects models, we found no association between the BMO location variation and age at baseline (x-axis, P = 0.76; y-axis, P = 0.52; z-axis, P = 0.29), axial length (x-axis, P = 0.58; y-axis, P = 0.55; z-axis, P = 0.61), disc area (x-axis, P = 0.42; y-axis, P = 0.39; z-axis, P = 0.50), mean deviation (x-axis, P = 0.83; y-axis, P = 0.77; z-axis, P = 0.63), and sex (x-axis, P = 0.85; y-axis, P = 0.74; z-axis, P = 0.69). Figure 3 shows similar distributions of the BMO location change over time for healthy and progressing glaucoma eyes in x-, y-, and z-axes, respectively. Moreover, there was no statistical difference between the location of the sectorial BMO points over time in each of the four quadrants (nasal, temporal, superior, and inferior) in either the healthy or glaucoma group (P values ranged from 0.75–0.41). Table 4 presents the change in BMO location estimated in progressing glaucoma eyes using manual and automated z-axis alignment methods. These results (Table 4) suggest that the estimated BMO location variation using the manual and SALSA methods are similar.
Figure 3.
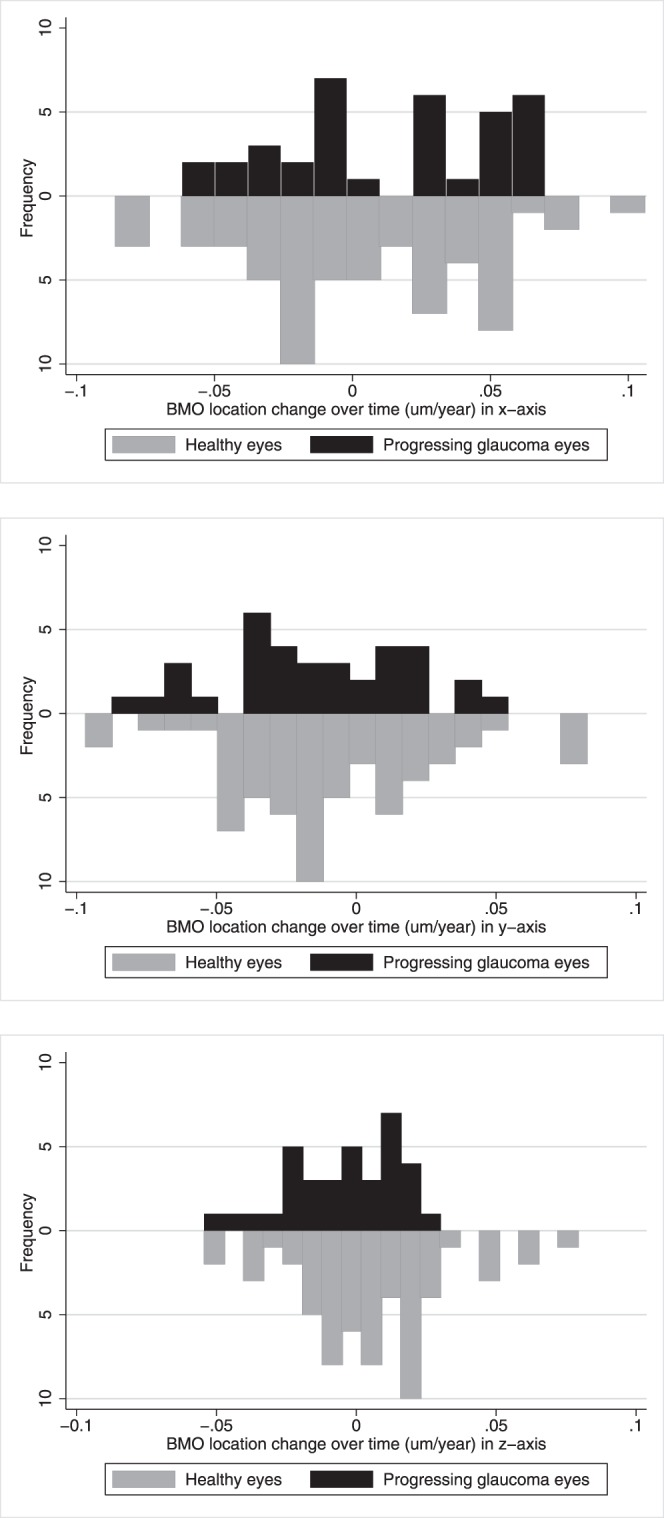
Distributions of the BMO location change over time for healthy (top) and progressing glaucomatous eyes (bottom) along the x-, y-, and z-axes.
Table 4.
Comparison Between the Mean BMO Location Change Over Time Estimated in Progressing Glaucoma Eyes Using Manual and Automated z-Axis Alignment Methods
Discussion
Recent advances in SD-OCT technology have improved image resolution, made it possible to measure ONH parameters, and allowed the imaging of deeper retinal structures, such as the choroid and LC.15 For these reasons, the SD-OCT has been adopted widely for clinical care to objectively assess small-scale changes in the eye, in particular changes in the ONH. In this context, the evaluation of the stability of the BMO location over time is important as it was considered as a reference for many clinical measurements, such as the minimum rim width, anterior LC surface depth, cup-to-disc ratio, rim area and volume, and so forth, to assess glaucomatous changes.
Our results indicated that the BMO location is stable over time for healthy and progressing glaucomatous eyes at least for the available 3 to 4 years of follow-up. Our findings suggested that the BMO-based measurements can be used to monitor glaucoma progression. Johnstone et al.,8 using the sclera as reference, reported that BMO migrates posteriorly with age due to age-related choroidal thinning based on a cross-sectional analysis that included a total of 168 eyes from both eyes of 84 study subjects. However, the study is limited due to its cross-sectional nature. Cross-sectional analysis usually requires a fixed reference to compare BMO location across different subjects. In contrast to the cross-sectional analysis, the longitudinal analysis does not require a reference as the follow-up images are registered and compared to the baseline image. Moreover, it is unclear what reference plane is most appropriate. For example, Avetisov et al.16 reported an age-related increase in sclera stiffness, based on 59 human sclerae ranging from 0 to 75 years of age. To the best of our knowledge, this is the first investigation of the stability of the BMO over time using longitudinal datasets.
Since the Cirrus HD-OCT instrument incorporates built-in software for the measurement of RNFL thickness and the ONH parameters, in particular the neuroretinal rim measurements, many studies have investigated the reproducibility of these measurements.17–19 However, these studies reported only the percent of eyes with incorrect determination of the disc margin without any quantitative information of the accuracy of the segmentation compared to manual segmentation. Moreover, in contrast to the Cirrus built-in software where the BMO is segmented on 36 resampled radial B-scans from the Cirrus optic disc cube 200 × 200 scans centered on the ONH, we used the whole 200 × 200 scans 3D volume to segment the BMO on every B-scan while taking into account the planarity of the BMO.
The results in this study indicated excellent intervisit reproducibility of BMO location using manual and SALSA segmentation based on ICC and CV. Mwanza et al.20 studied the reproducibility of peripapillary RNFL thickness and ONH parameters measured with Cirrus HD-OCT in 55 glaucomatous eyes and reported all ICCs were excellent and ranging from 80.8% to 99.1% for intervisit measurements, and the nasal clock hours and quadrants showed the poorest reproducibility. Leung et al.21 reported similar results in 97 healthy and 83 glaucomatous eyes. In another study using the Cirrus HD-OCT, Hwang et al.17 reported the errors in neuroretinal rim measurement. Among 255 myopic eyes, 45 (17.6%) had neuroretinal rim measurement errors; 29 (11.4%) had optic disc margin detection errors at the temporal (16 eyes), superior (11 eyes), and inferior (2 eyes) quadrants; 19 (7.5%) showed cup margin detection errors at the nasal (17 eyes) and temporal (2 eyes) quadrants; and 3 (1.2%) had disc and cup margin detection errors. However, it should be noted that the criteria used to assess the errors were not provided. Sung et al.22 reported 2.6% of eyes (21 from a total of 796 healthy and glaucomatous eyes) had incorrect determination of the disc margin. Almobarak et al.23 tested a new Spectralis (Heidelberg Engineering, Heidelberg, Germany) SD-OCT based software for BMO segmentation using 107 glaucoma patients and 48 healthy subjects. They reported differences between automated and manual segmentation results (ΔBMO) were 11.5 μm for the healthy eyes and 12.4 μm for glaucomatous eyes, which is similar to our results. However, it should be noted that their measurements were obtained on only two separate occasions. Further, our results showed that for a small number of eyes, the difference between the manual and SALSA segmentation is relatively high (>20 μm). Hence, it still is important to review images manually to identify segmentation errors24,25 before images are used in clinical management of disease. One alternative to the subjective review for segmentation error verification is to develop automated methods to detect when a segmentation method more likely fails to segment accurately the BMO. This can be addressed by defining a new parameter quantifying the likelihood of algorithm failure based on predefined criteria, such as border tissue orientation and blood vessels presence, that can obscure visibility of the underlying BMO by absorbing incident light and casting shadows.
Limitations of the current study include the relative short follow-up time for the normal and glaucoma groups, and limited age range, particularly of the healthy eyes. It can be argued that the relatively short follow-up (between 3 and 4 years) included in this study is clinically relevant, as clinicians want to determine if a patient is progressing in as short a time-frame as possible. However, longitudinal studies with longer follow-up are needed to confirm these findings and to determine whether the BMO can be used as a long-term stable reference to estimate the changes due to glaucoma. Another limitation is the lack of eyes with advanced glaucoma. Histologic studies of humans and animals as well as experimental animal models based on IOP elevation reported that in the advanced stages of glaucoma, remodeled connective tissue was observed in the ONH, and in particular the connective tissues of the LC become posteriorly displaced and excavated beneath the BMO.5,26 This may lead to a displacement of the BMO location at the late stage of glaucoma. Moreover, the study sample size is relatively small and, therefore, these finding should be interpreted with caution. Nevertheless, the small variation of the slopes among eyes in both groups suggests that the study is powered adequately to support these findings. Further, this study did not include high myopic subjects (spherical refraction was restricted to ±5.0 D).The BMO location may not be stable in high myopic eyes where the BMO, as well as scleral openings, is tilted.27
Another limitation of this study is the lack of gold standard or ground truth of the BMO positions. While we assumed that a small difference between the manual and SALSA BMO location detection values indicates high accuracy of the SALSA segmentation method and high ΔBMO values are due to the automated segmentation failures, it is possible that high ΔBMO values could be due to errors in the manual identification of the BMO. It is likely that the difference between manual and SALSA methods increases when the visibility of BMO decreases (the difference between manual and SALSA segmentation tended to be large in eyes with lower signal strength). Therefore, the hypothesis that the SALSA segmentation algorithm performs worse when the operator also has difficulty with identifying BMO must be tested. Moreover, one can argue that these OPL, ELM, and sclera layers used for z-axis 3D image alignment are fuzzy and not visible enough in every B-scan. However, given the fact that only a portion of these layers are necessary to perform the alignment, all the B-scans in one 3D follow-up image have a unique z-axis alignment vector, and we used a relatively large number of B-scans (200), we believe this limitation did not adversely influence or bias our results. Another possible limitation is the fact that we used the Cirrus instrument built-in x–y registration algorithm for processing the images. However, one can argue that using the standard software ensures that our results are relevant to standard clinical use of the Cirrus HD-OCT. Another limitation of this study is that only good quality scans with signal strength3 7 were included to measure the reproducibility of the BMO location with manual and automated segmentation methods. Therefore, these findings may not be valid for poor quality scans. It would be interesting to investigate the ability of the automated method to identify the BMO when poor quality scans, which are likely to be frequent in a busy clinic than in a research setting, are included in the study. Another limitation of this study is that only one operator manually segmented the BMO. Therefore, the interobserver variability for the manual segmentation was not calculated. However, the interoperator reproducibility of the SALSA method for BMO detection was previously validated on Spectralis SD-OCT images10 and results suggest good agreement between manual and SALSA results (in 92.5% of 40 eyes, the difference in BMO location was less than 3 voxels).
In conclusion, our data suggested that with follow-up between 3 and 4 years, the BMO location was stable in normal and progressing eyes indicating that it can be used as a reference plane for the calculation of the ONH parameters to monitor glaucoma progression. However, additional longitudinal datasets with longer follow-up are needed to validate these findings.
Acknowledgments
Supported by National Eye Institute (Bethesda, MD, USA) Grants EY021818 (FAM), U10EY14267 (LMZ), P30EY022589 (LMZ), EY11008 (LMZ), EY019869 (LMZ), and EY022039 (CB).
Disclosure: A. Belghith, None; C. Bowd, None; F.A. Medeiros, Carl Zeiss Meditec (F, C, R), Heidelberg Engineering (F, C), Topcon (F), Ametek (F, C), Bausch+Lomb (F), Allergan (F, C), Sensimed (F), Alcon (C); N. Hammel, None; Z. Yang, None; R.N. Weinreb, Alcon (C), Allergan (C), Amatek (C), Bausch+Lomb (C), Carl Zeiss Meditec (F, C, R), Forsight (C), Topcon (F, C), Valeant (C); Heidelberg Engineering (F), Genentech (F), Konan (F), Neurovision (F), Optovue (F), Quark (F), Reichert (F), Tomey (F); L.M. Zangwill, Carl Zeiss Meditec (F, R), Heidelberg Engineering (F), Optovue, Inc. (F, R), Topcon (F), Quark (F)
References
- 1. Reis AS,, O'Leary N,, Yang H,, et al. Influence of clinically invisible, but optical coherence tomography detected, optic disc margin anatomy on neuroretinal rim evaluation. Invest Ophthalmol Vis Sci. 2012; 53: 1852–1860. [DOI] [PMC free article] [PubMed] [Google Scholar]
- 2. Považay B,, Morgan JE,, Glittenberg C,, et al. Minimum distance mapping using three-dimensional optical coherence tomography for glaucoma diagnosis. J Biomed Optics. 2007; 12: 041204–041204. [DOI] [PubMed] [Google Scholar]
- 3. Abràmoff MD,, Lee K,, Niemeijer M,, et al. Automated segmentation of the cup and rim from spectral domain oct of the optic nerve head. Invest Ophthalmol Vis Sci. 2009; 50: 5778–5784. [DOI] [PMC free article] [PubMed] [Google Scholar]
- 4. Chauhan BC,, O'Leary N,, AlMobarak FA,, et al. Enhanced detection of open-angle glaucoma with an anatomically accurate optical coherence tomography–derived neuroretinal rim parameter. Ophthalmology. 2013; 120: 535–543. [DOI] [PMC free article] [PubMed] [Google Scholar]
- 5. Roberts MD,, Sigal IA,, Liang Y,, Burgoyne CF,, Downs, JC. Changes in the biomechanical response of the optic nerve head in early experimental glaucoma. Invest Ophthalmol Vis Sci. 2010; 51: 5675–5684. [DOI] [PMC free article] [PubMed] [Google Scholar]
- 6. Reis AS,, O'Leary N,, Stanfield MJ,, Shuba LM,, Nicolela MT,, Chauhan BC. Laminar displacement and prelaminar tissue thickness change after glaucoma surgery imaged with optical coherence tomography. Invest Ophthalmol Vis Sci. 2012; 53: 5819–5826. [DOI] [PubMed] [Google Scholar]
- 7. He L,, Yang H,, Gardiner SK,, et al. Longitudinal detection of optic nerve head changes by spectral domain optical coherence tomography in early experimental glaucoma. Invest Ophthalmol Vis Sci. 2014; 55: 574–586. [DOI] [PMC free article] [PubMed] [Google Scholar]
- 8. Johnstone J,, Fazio M,, Rojananuangnit K,, et al. Variation of the axial location of Bruch's membrane opening with age, choroidal thickness, and race. Invest Ophthalmol Vis Sci. 2014; 55: 2004–2009. [DOI] [PMC free article] [PubMed] [Google Scholar]
- 9. Sample PA,, Girkin CA,, Zangwill LM,, et al. The African descent and glaucoma evaluation study (adages): design and baseline data. Arch Ophthalmol. 2009; 127: 1136–1145. [DOI] [PMC free article] [PubMed] [Google Scholar]
- 10. Belghith A,, Bowd C,, Weinreb RN,, Zangwill LM. A hierarchical framework for estimating neuroretinal rim area using 3d spectral domain optical coherence tomography (SD-OCT) optic nerve head (ONH) images of healthy and glaucoma eyes. Conf Proc IEEE Eng Med Biol Soc. 2014; 2014: 3869–3872. [DOI] [PubMed] [Google Scholar]
- 11. Belghith A,, Bowd C,, Medeiros F,, Weinreb R,, Zangwill L. Automated segmentation of anterior lamina cribrosa surface: how the lamina cribrosa responds to intraocular pressure change in glaucoma eyes? 2015 IEEE 12th International Symposium on Biomedical Imaging (ISBI). 2015: 222–225. Doi:http://dx.doi.org/10.1109/ISBI.2015.7.163854.
- 12. Rue H,, Hurn MA. Bayesian object identification. Biometrika. 1999; 86: 649–660. [Google Scholar]
- 13. Belghith A,, Collet C,, Armspach J. A statistical framework for biomarker analysis and HR-MAS 2d metabolite identification. : Computational Surgery and Dual Training. New York NY: Springer; 2014: 89–112. [Google Scholar]
- 14. Kirby M,, Miranda R. Circular nodes in neural networks. Neural Comput. 1996; 8: 390–402. [DOI] [PubMed] [Google Scholar]
- 15. Yang H,, Qi J,, Hardin C,, et al. Spectral-domain optical coherence tomography enhanced depth imaging of the normal and glaucomatous nonhuman primate optic nerve head. Invest Ophthalmol Vis Sci. 2012; 53: 394–405. [DOI] [PMC free article] [PubMed] [Google Scholar]
- 16. Avetisov E,, Savitskaya N,, Vinetskaya M,, Iomdina E. A study of biochemical and biomechanical qualities of normal and myopic eye sclera in humans of different age groups. Metab Ped Syst Ophthalmol. 1982; 7: 183–188. [PubMed] [Google Scholar]
- 17. Hwang YH,, Kim YY,, Jin S,, Na JH,, Kim HK,, Sohn YH. Errors in neuroretinal rim measurement by cirrus high-definition optical coherence tomography in myopic eyes. Br J Ophthalmol. 2012; 96: 1386–1390. [DOI] [PubMed] [Google Scholar]
- 18. Sung KR,, Na JH,, Lee Y. Glaucoma diagnostic capabilities of optic nerve head parameters as determined by cirrus HD optical coherence tomography. J Glaucoma. 2012; 21: 498–504. [DOI] [PubMed] [Google Scholar]
- 19. Cheung CY,, Chen D,, Wong TY,, et al. Determinants of quantitative optic nerve measurements using spectral domain optical coherence tomography in a population-based sample of non-glaucomatous subjects. Invest Ophthalmol Vis Sci. 2011; 52: 9629–9635. [DOI] [PubMed] [Google Scholar]
- 20. Mwanza J-C,, Chang RT,, Budenz DL,, et al. Reproducibility of peripapillary retinal nerve fiber layer thickness and optic nerve head parameters measured with cirrus HD-OCT in glaucomatous eyes. Invest Ophthalmol Vis Sci. 2010; 51: 5724–5730. [DOI] [PMC free article] [PubMed] [Google Scholar]
- 21. Leung CK-S,, Cheung CY-L,, Weinreb RN,, et al. Retinal nerve fiber layer imaging with spectral-domain optical coherence tomography: a variability and diagnostic performance study. Ophthalmology. 2009; 116: 1257–1263. [DOI] [PubMed] [Google Scholar]
- 22. Sung KR,, Na JH,, Lee Y. Glaucoma diagnostic capabilities of optic nerve head parameters as determined by cirrus HD optical coherence tomography. J Glaucoma. 2012; 21: 498–504. [DOI] [PubMed] [Google Scholar]
- 23. Almobarak FA,, O'Leary N,, Reis AS,, et al. Automated segmentation of optic nerve head structures with optical coherence tomography. Invest Ophthalmol Vis Sci. 2014; 55: 1161–1168. [DOI] [PubMed] [Google Scholar]
- 24. Khachatryan N,, Bowd C,, Medeiros FA,, Zangwill LM. 20 - optic disc imaging. In: Shaarawy TM,, MB, Sherwood,, Hitchings RA,, Crowston JG, eds Glaucoma, 2nd ed. Philadelphia, PA: W.B. Saunders; 2015: 221–243.
- 25. Hood DC,, Raza AS. On improving the use of OCT imaging for detecting glaucomatous damage. Br J Ophthalmol. 2014; 98 (suppl 2): ii1–ii9. [DOI] [PMC free article] [PubMed] [Google Scholar]
- 26. Quigley HA,, Addicks EM,, Green WR,, Maumenee A. Optic nerve damage in human glaucoma: Ii. the site of injury and susceptibility to damage. Arch Ophthalmol. 1981; 99: 635–649. [DOI] [PubMed] [Google Scholar]
- 27. Shoji T,, Kuroda H,, Suzuki M,, et al. Correlation between lamina cribrosa tilt angles, myopia and glaucoma using OCT with a wide bandwidth femtosecond mode-locked laser. PLoS One. 2014; 9: e116305. [DOI] [PMC free article] [PubMed] [Google Scholar]


