Abstract
A detailed microscopic analysis of renal podocyte substructure is essential to understand and diagnose nephrotic kidney disease. Currently only time consuming electron microscopy (EM) can resolve this substructure. We used structured illumination microscopy (SIM) to examine frozen sections of renal biopsies stained with an immunofluorescence marker for podocin, a protein localized to the perimeter of the podocyte foot processes and compared them with EM in both normal and nephrotic disease biopsies. SIM images of normal glomeruli revealed curvilinear patterns of podocin densely covering capillary walls similar to podocyte foot processes seen by EM. Podocin staining of all nephrotic disease biopsies were significantly different than normal, corresponding to and better visualizing effaced foot processes seen by EM. The findings support the first potential use of SIM in the diagnosis of nephrotic disease.
OCIS codes: (100.6640) Superresolution, (170.0170) Medical optics and biotechnology, (170.3880) Medical and biological imaging, (170.4580) Optical diagnostics for medicine, (170.4730) Optical pathology, (180.0180) Microscopy, (180.2520) Fluorescence microscopy
1. Introduction
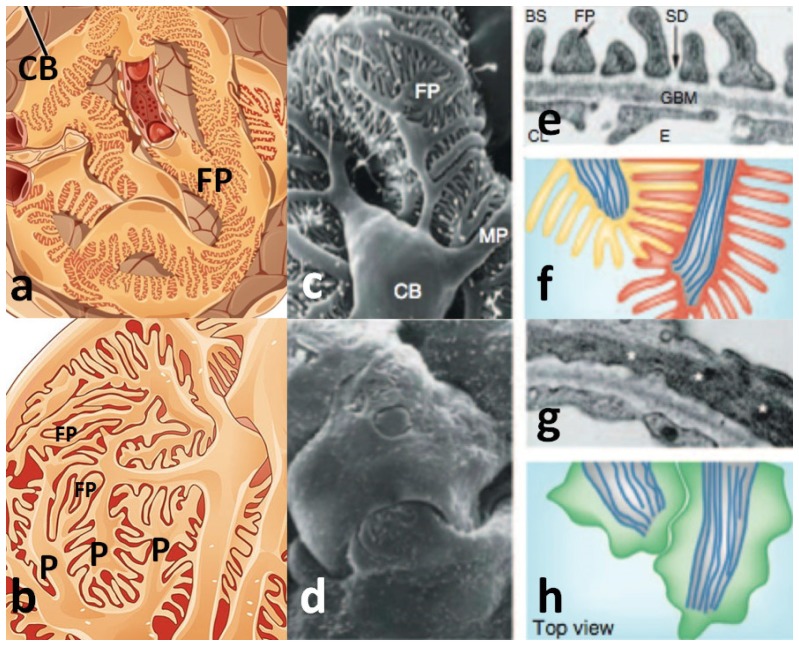
Nephrotic syndrome comprises a group of diseases in which the kidney loses its normal ability to retain proteins in the blood while eliminating smaller molecules through filtration into the urine. These diseases are usually debilitating, sometimes lethal and their diagnosis and treatment often requires microscopic analysis of a small sample, or biopsy, of kidney tissue, and in particular the glomerulus [1]. The glomerulus is a multicellular filtration apparatus, consisting of a coiled ball of interconnected capillaries present in 1-1.2 million copies per kidney (Fig. 1(a)). One of the three cell types in the glomerulus, the podocyte, covers the outside of all glomerular capillaries (Fig. 1(a)) and plays a key role in the regulation of blood filtration. Changes in the highly ordered podocyte substructure are causative of nephrotic disease and diagnosis hinges on visualization of this substructure. Podocyte substructure consists of cytoplasmic extensions emanating from large cell bodies and branching to form leg-like appendages, the pedicels, which terminate in slipper-like projections, the foot processes (Fig. 1(b)). Pedicels and foot processes wrap around the exterior of glomerular capillaries, and foot processes of adjacent podocytes interlock (Fig. 1(a)-1(c)), connected by thin filtration slit diaphragms and attached to the underlying glomerular basement membrane (GBM), which forms the remainder of the filtration barrier (Fig. 1(e)). Loss, or effacement, of the podocyte foot processes and disappearance of the filtration slits are the major structural changes in the kidney associated with protein leakage and nephrotic diseases [1] (Fig. 1(d), 1(g), 1(h)).
Fig. 1.
Normal (a, b, c, e, f) and nephrotic (d, g, h) glomerular podocyte substructure. P = pedicel, FP = foot process, CB = cell body, MP = major pedicel processes, SD = slit diaphragm, GBM = glomerular basement membrane. (a) Representation of the glomerulus with podocyte cell bodies wrapping around capillaries, (b) higher magnification view of (a) showing the highly interdigitated structure of pedicels and foot processes, (c) SEM view similar to (b). (d) SEM view of altered podocyte substructure in nephrotic syndrome, (e) cross sectional view by TEM of podocyte foot processes (FP) against the GBM, (f) schematic en face view of normal podocyte foot processes, (g) TEM image of a nephrotic podocyte without visible foot processes, (h) schematic en face view of nephrotic podocytes. (a-b) reprinted from Wikipedia commons, (c-h) from reference [1] with permission from Macmillan Publishers, Ltd.
These structures are at or below the resolution limit of standard light microscopy. Normal podocyte foot processes are between 250 and 700 nm in width [2], the filtration slit diaphragm between them are smaller yet at 40 nm [3], and so electron microscopy (EM) has been required for their observation. Scanning electron microscopy (SEM) visualizes details in 3 dimensions over a large area at high resolution, and would be the ideal technique to use, but is not practical for routine diagnosis since it requires expensive and specialized equipment for sample preparation. Until now, transmission electron microscopy (TEM) of thin sections of kidney tissue has therefore become the standard technology, since its sample preparation is less expensive and simpler than that for SEM, and it often yields more information. However, TEM, unlike SEM, provides only a two-dimensional image over a field-of-view limited to 10 microns or less. EM techniques are costly, requiring expensive equipment, specially trained technicians. Furthermore, EM is a time consuming technique; the preparation, imaging, and analysis of a single sample can routinely take up to one week.
From a diagnostic perspective, it is desirable, for several reasons, to visualize podocyte substructure using an optical microscopy technique which combines the resolving power of TEM, the 3-dimensional (3D) views of SEM, and the use of simple and versatile sample preparation techniques. Such a technique would be more cost effective, require fewer man-hours per diagnosis, and, most importantly, enable visualization of podocyte substructure with excellent 3D detail over an unprecedented volume of glomerulus. Confocal microscopy has been used to visualize podocyte substructure but only with genetic fluorescent tagging of podocyte proteins in mouse models [4,5]; there is presently no reported optical imaging technique that allows visualization of podocyte foot processes using conventional staining techniques in otherwise native tissue.
The small size of foot processes makes observation by optical microscopy a challenge but there are a number of super-resolution microscopy techniques that may fulfill the requirements needed for diagnosis. Stochastic optical resolution microscopy (STORM) is a technique that can resolve structures on the order of 20 nm and has been applied to a related problem in nephrotic disease, the substructure of the glomerular basement membrane [6]. This is a very promising study, but is not yet directly applicable to routine diagnosis on standardly prepared kidney tissue samples as the technique requires specific fluorophores, additional sample preparations, and cannot capture the full 3D structure over a sufficiently large volume. Recently, stimulated emission depletion (STED) microscopy, typically capable of resolving structures on the order of 50 nm, has been utilized in conjunction with optical clearing protocols to visualize the structure of foot processes throughout whole, intact glomeruli [7]. While this technique yields detailed images of podocyte substructure, this is only achieved after a lengthy sample preparation protocol (over 2 weeks) [7] which is not useful for routine diagnosis.
Structured illumination microscopy (SIM) is a super-resolution microscopy technique that breaks the diffraction limit by a factor of 2 both laterally [8] and axially [9], facilitates 3D visualization by optical sectioning [10], and is compatible with traditional immunohistological tissue preparations. These advantages of SIM may enable optical resolution of podocyte substructure, and differentiation of its normal and abnormal forms, thereby allowing accurate and rapid diagnosis of nephrotic disease. We remark that SIM is being tested in other areas of medical diagnosis, for example, the high-throughput determination of tumor margins in tissue sections [11], but none so far for the purpose of resolving structures of biological and medical importance that are otherwise visible only by EM.
In this paper, we test the hypothesis that SIM can resolve podocyte substructure by imaging fluorescent probes tagged to podocin, a protein localized to the perimeter of the foot process, where it meets the filtration slit and is close to the GBM [12]. The predicted fluorescence image of this protein should be a curvilinear outline that is similar to the foot process profile seen by EM. Our findings confirm we may observe such structures and show that SIM provides sufficient information to distinguish normal from nephrotic podocytes, supporting its use in pathologic diagnosis of nephrotic disease and has the potential to displace EM as the gold standard.
2. Methods and materials
Kidney tissue was snap-frozen on receipt in O.C.T. tissue mounting media (Cat. #4583, Sakura Finetek, USA) and stored at −80°C. All tissue was left over from biopsies of patients taken to diagnose kidney disease and no tissue was obtained primarily for research. The diagnoses of each biopsy were obtained without any direct patient identifiers. The Montefiore-Einstein Institutional Review Board approved this research usage (docket #2014-3678). Cases included 3 normal biopsies and 3 with minimal change disease, a nephrotic disease with a consistent and high degree of podocyte foot process effacement [13] and therefore appropriate for this study.
Tissue sections for indirect immunofluorescence (IF) staining were cut 5μm thick from frozen tissue using a Tissue-Tek Cryo3 Microtome/Cryostat, (Cat. #5805, Sakura Finetek, USA) and mounted on either Colorfrost Plus Slides (Cat. #12-550-17, ThermoFisher Scientific, USA) or Leica IPS Plus Slides (Leica Biosystems, USA). Sections were warmed to room temperature, rinsed twice for 1 min. in phosphate buffered saline (PBS, Cat. #B11248, Becton Dickinson and Company, USA), fixed for 10 min. in freshly made 2% paraformaldehyde (Cat. #19200, 1g Prill’s form, Electron Microscopy Sciences, USA), in 50mL Dulbecco’s PBS (pH 7.4, Cat. #14200-075, Life Technologies, USA), rinsed in 3 changes of PBS for 1 min. each, permeabilized in PBS-0.2% Triton X-100, (Cat. #T9284, Sigma-Aldrich, USA) for 20 min. and washed 3 times in PBS. The sections were incubated in wash buffer (Cat. #S1966, PBS-0.05% Tween 20, Dako, USA) + 1% bovine serum albumin (BSA, Cat. #001-000-162, Jackson ImmunoResearch Labs, USA) for 5 min., blocked for 20 min. at room temperature with 5% normal goat serum (Cat #S1000, Vector Labs, USA) in antibody diluent (Cat. #003218, Invitrogen, USA) with 1% BSA. Slides were incubated for 30 min. with 100µL per slide of rabbit polyclonal anti-podocin antibody (Cat. #P0372, SigmaAldrich, USA) diluted 1:500 in antibody diluent with 1% BSA and washed 3 times in wash buffer then incubated for 30 min. with fluorescein isothiocyanate (FITC)-conjugated goat anti-rabbit antibody (Cat # F0382, Sigma-Aldrich, USA). They were then rinsed 3 times in wash buffer and coverslipped (24 x 50mm) with Vectashield anti-fade mounting medium with DAPI (Cat. #H-1200, Vector Labs, USA) and the coverslip edges sealed with nail polish to prevent drying.
Immunostained slides were visualized on a Nikon N-SIM structured illumination microscope. The samples were examined at 20x magnification (0.5 numerical aperture (NA); Plan Fluor 20x Ph1 DLL, Nikon, Japan) under standard epi-fluorescence illumination with FITC filter sets. Glomeruli were identified as the only structures showing strong fluorescence, and were first examined at this magnification. Glomerular capillaries were further examined at 100x magnification (1.49 NA; Plan Apo TIRF 100x Oil DIC H N2, Nikon, Japan) using both epi-fluorescence and the 3D-SIM modality of the microscope using the method detailed in Gustafsson et al [9]. 3D images (z-stacks) were acquired with a plane separation of 120nm. 3D-SIM z-stacks through the entire thickness of the tissue over an area approximately 30 x 30μm2 slice were acquired in approximately 5 minutes. For analysis and display of the 3D-SIM z-stack images, the maximum intensity projection option of the Nikon-supplied NIS elements viewer software was used. Individual xy planes in the z-stack were also examined.
Kidney TEM images used for comparison to SIM images were taken as part of routine diagnosis from tissue processed by standard EM fixation, embedding, staining and thin sectioning procedures [14]. Briefly, biopsy portions 1-2mm in maximal dimension were fixed in cacodylate-buffered 4% formaldehyde-2.5% glutaraldehyde solution for at least 1 hour, postfixed in 1% osmium tetroxide, and then dehydrated through aqueous ethanol solutions and acetonitrile, for embedding in Araldite-Epon resin. Thin sections (100-200 nanometers) of this embedded tissue were cut on a Leica Ultracut ultramicrotome, mounted on 3 mm copper grids, stained with 1% uranyl acetate-lead citrate, observed in a JEOL 1400 TEM and digitally photographed with a side-mounted GATAN 785 ES1000W CCD camera at primary magnifications between 1000 and 20000x.
3. Results
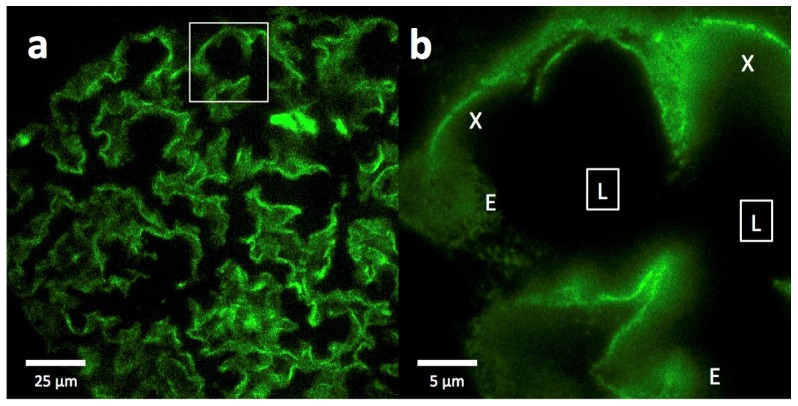
Epi-fluorescence images at 20x magnification of FITC-podocin stained glomeruli from normal kidney biopsies show outlines along capillary walls (Fig. 2(a)). At 100x magnification, substructure begins to appear in cross sectional and en face views, although significant details cannot be discerned (Fig. 2(b)).
Fig. 2.
Epi-fluorescence imaging of a FITC-podocin stained normal glomerulus. (a) Section of a whole glomerulus at 20x magnification showing the outlines of many interconnected capillaries. (b) High magnification (100x) image of the region outlined by the white square in (a), showing cross sections (X) and some partial en face views (E) of capillaries as they curve through the section. Squares with (L) denote the capillary lumens. The data set can be accessed at [15].
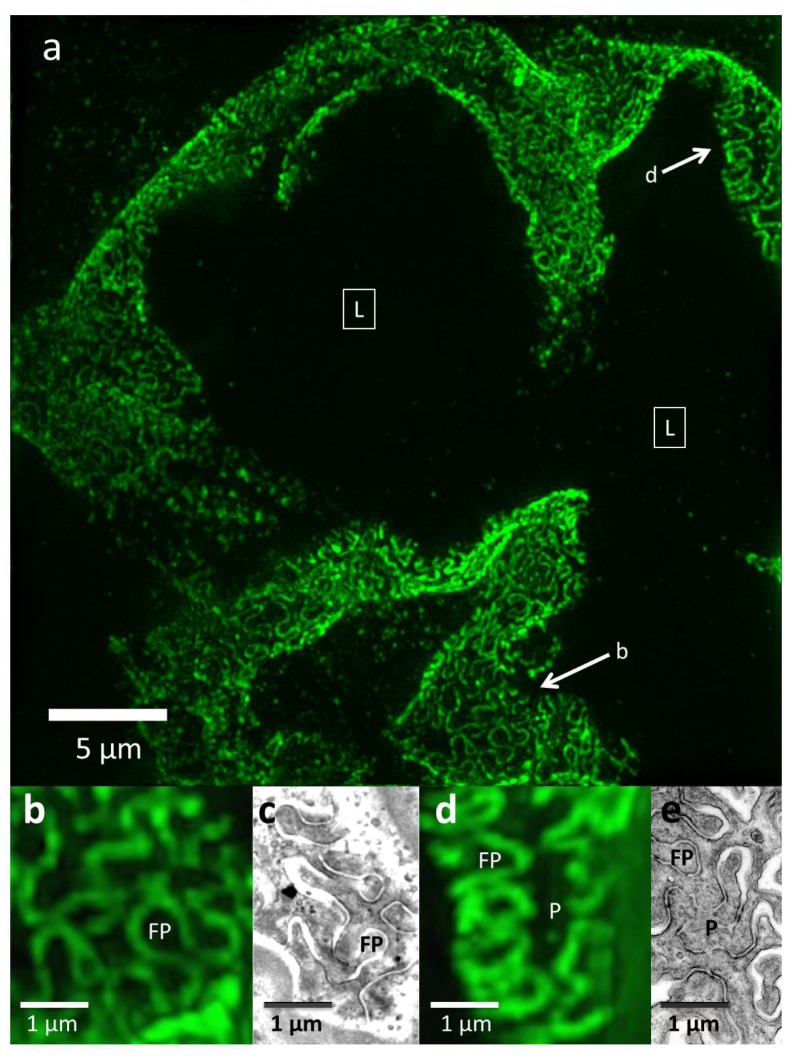
In 3D-SIM mode, images of the same capillaries show clear podocin outlines of podocyte substructure that were not resolved by epi-fluorescence (Fig. 3(a), 3(b), 3(d)). They appear to be confined to a plane curving in 3D that corresponds to the glomerular capillary wall, are still seen in cross section and en face views, and are best viewed in the maximum intensity projection option of the NIS viewer software (Fig. 3(a)). This software allows the viewer to rotate the projection axis, allowing visualization of the sample from any orientation and to see that the podocin outlines are uniform and cover the entire capillary wall (not shown). Single image planes also show podocin outlines, although incompletely since they come in and out of the plane (not shown).
Fig. 3.
3D-SIM imaging of a FITC-podocin stained normal glomerulus. Maximum intensity projection of a SIM z-stack (79 planes, 9.36μm thick) at 100x. (a) Same region as shown in Fig. 2(b). Squares with (L) denote the capillary lumens. Image shows cross sectional and en face views of podocytes foot processes as they curve around capillary walls. Arrows point to well-resolved podocyte outlines. (b) and (d) Enlargements of two areas marked with arrows in (a). FP = foot process, P = pedicel. (c) and (e) EM sections with similar en face views of podocytes at the same magnification as (b) and (d). The data set can be accessed at [15].
The podocin outlines appear similar to the curved, interdigitating podocyte foot processes occasionally seen by TEM in tangential view of thin sections (Fig. 3(c) and 3(e)). The diameter of the foot process from 3D-SIM images of FITC-podocin is 300-600 µm, about 30-50% larger than the EM measurements of 250-400 µm. This size difference is likely due to differences in sample preparation as well as imaging differences; EM directly observes the podocyte substructure whereas we image a fluorescent marker tagged to the perimeter of foot processes. However, the shape and organization of podocytes is similar for both methods, with interdigitation of foot process observed by both SIM and EM (Fig. 3(b), 3(c), 3(d), 3(e)).
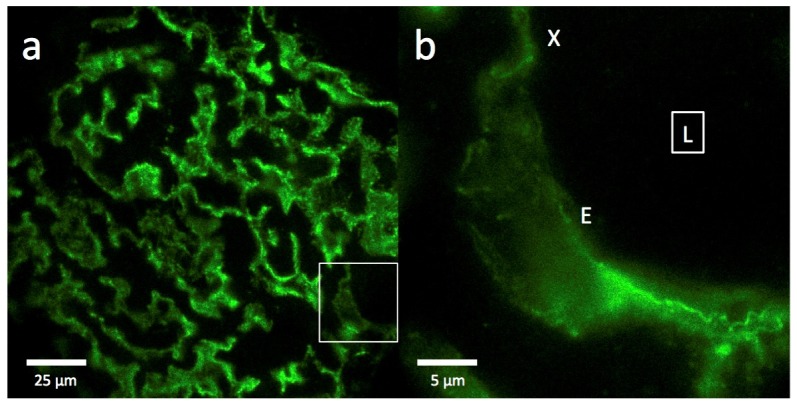
Epi-fluorescence images of FITC-podocin stained glomeruli from patients with nephrotic syndrome (minimal change disease, Fig. 4) are similar to those from normal glomeruli (Fig. 2). At 20x magnification, normal and minimal change disease glomeruli are completely indistinguishable (Fig. 4(a) vs. Fig. 2(a)). At 100x magnification, some barely visible substructure in cross sectional and en face views is present in nephrotic capillary images (Fig. 4(b)), but there are still no features that would allow diagnosis of nephrotic syndrome.
Fig. 4.
Epi-fluorescence imaging of a FITC-podocin stained glomerulus from a patient with nephrotic syndrome (minimal change disease). (a) Section of a whole glomerulus at 20x magnification showing the outlines of many interconnected capillaries, identical in appearance to those in the normal glomerulus in Fig. 2(a). (b) High magnification (100x) image of the region outlined by the white square in (a), showing a cross section (X) and an en face view (E) of one capillary curving through the section. Square with (L) denotes the capillary lumen. The data set can be accessed at [15].
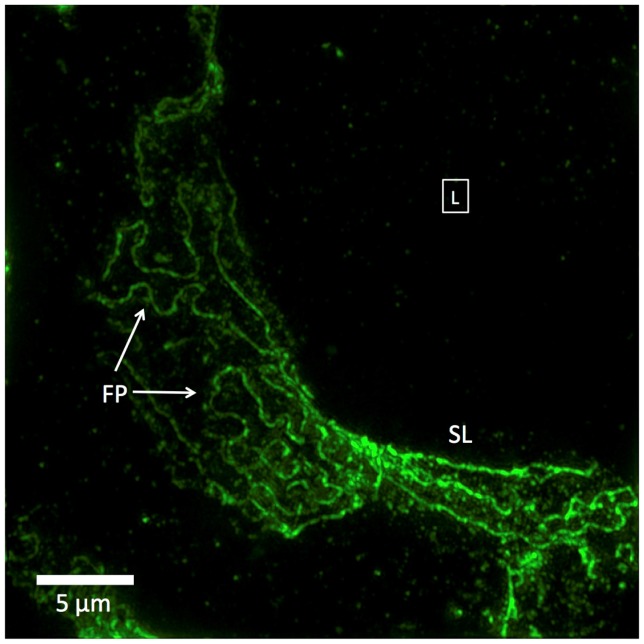
However, 3D-SIM images of the same minimal change disease glomeruli show significant alterations of FITC-podocin outlines that are characteristic of nephrotic syndrome (Fig. 5). Like the 3D-SIM images of normal glomeruli (Fig. 3), the nephrotic podocyte foot processes are clearly visible but they differ from normal in several ways. The podocin-outlined foot processes show less interdigitation, fewer foot processes per unit area, larger and more variable radii of foot process curvature (FP in Fig. 5), and foci where foot processes appear to stretch out to form sets of nearly straight parallel lines (SL in Fig. 5). These striking differences, particularly the long, linear configurations, have no direct analogue in TEM, because the thin sections required for TEM cannot capture an en face view of a curved surface large enough to see the edges of enlarged foot processes; only the lack of any foot process structure, termed effacement, is detectable by TEM.
Fig. 5.
3D-SIM image of a FITC-podocin stained glomerular capillary from a patient with nephrotic syndrome (minimal change disease). Maximum intensity projection of a SIM z-stack (100x; 67 planes, 7.92μm thick). Foot processes (FP) appear variably enlarged and sparser than the normal ones in Fig. 3. Straight or minimally curved lines (SL) represent completely effaced foot processes. Square with (L) denotes the capillary lumen. The data set can be accessed at [15].
4. Discussion
SIM imaging of FITC-podocin allows accurate, high-resolution visualization of podocyte substructure to the standard required for diagnosis. Comparison with TEM images of similar regions confirms that the structures observed by SIM correspond to foot processes. The field-of-view of a SIM image is approximately 50 times larger than that of TEM images and SIM images can be acquired throughout a full 5 to 10μm thick tissue slice whereas TEM sections are limited to less than 100nm thick, which results in a volumetric SIM data set containing the equivalent of 2500 TEM images. This information-rich data set facilitates sampling of larger quantities of foot processes than can be achieved by TEM. The larger volumes imaged by SIM also enables large sections of the podocyte substructure to be viewed en face, a view that is incredibly rare in TEM images due to the thin sectioning required and the curved surface of the GBM. One discrepancy observed between SIM and TEM images is the larger size of foot processes in SIM images. This may be attributed to a lack of shrinkage that can occur during EM tissue processing [14], and may therefore yield more accurate measurements. It is also possible that markers for the foot process perimeter other than podocin might yield slightly different dimensions.
Comparison of normal and nephrotic glomerular capillaries by SIM reveals striking morphological changes. Loss of podocyte foot process structure, or effacement, as seen by TEM, varies considerably in different podocytes within the same glomerulus [16], and this variation is also seen in SIM images. Partial effacement of foot processes is identified, as expected, by the presence of fewer foot processes with increased diameter and less interdigitation (Fig. 5). Full effacement of podocytes is only inferred from TEM images by the near-total lack of visible foot processes, but SIM images of podocin in minimal change disease samples gave a different view; long, nearly straight and parallel lines that likely represent very enlarged foot processes that can no longer interdigitate (Fig. 5). These large, apparently stretched out foot processes are missed by TEM as they will almost never lie exactly within the plane of the 100nm thick TEM tissue section.
We chose minimal change disease glomeruli stained with podocin to test the ability of SIM to resolve disease-related structural changes in their podocyte foot processes, and to compare them to normal ones. We made this choice because minimal change disease is considered to show the greatest degree of foot process effacement among all nephrotic diseases and should therefore be easiest to distinguish from normal. We have also tested other nephrotic diseases, and they also have podocin staining patterns that correspond to enlarged or effaced foot processes, although not as dramatically as minimal change disease does (data not shown). A recent study using STED to image optically cleared rat kidney tissue also showed similar changes using an experimental model of nephrotic disease, Heymann nephritis [7].
Our approach has utilized only standard IF protocols which are applicable to tissue specimens as received from the surgical pathology laboratory. These protocols are relatively quick and simple, usually taking 1-2 hours and are already part of the standard preparation of kidney biopsies, whereas standard TEM preparation requires protocols taking 1 to 2 days and trained specialists. Adding an extra step to tag podocin for IF does not significantly increase the preparation time for samples. The optical clearing technique used in the recent STED imaging study of rat kidney [7] eliminates the step of tissue sectioning but adds a significant time delay (up to 2 weeks).
Further time savings over TEM imaging are made in the image acquisition and analysis stages. SIM z-stacks are fast to generate and reconstruct in 3D, requiring only 5 minutes to acquire a volume of approximately 30 x 30 x 5μm3, which provides enough sampling of podocin staining to provide a diagnosis. The ability to visualize such a large volume of the podocyte substructure in a single data set in 3D reduces the cognitive strain on the pathologist that arises from mentally visualizing the substructure from a number of TEM images, and potentially reduces diagnosis time. Diagnosis by TEM routinely takes between one day and one week whereas a diagnosis by SIM could potentially be achieved only a few hours after the initial biopsy.
A dramatic reduction in diagnosis time and labor per diagnosis would also reduce costs. The specialist training, equipment and consumables required for TEM tissue preparation could be eliminated, instead making use of the less expensive and simpler IF preparation protocols available in all surgical pathology laboratories. While SIM is a relatively new and expensive microscope technology, EM is even more expensive despite being an established technique.
SIM may be beneficial from a pathological perspective to facilitate basic study of podocyte structure and function, as well as clinical applications. Mapping the location of other proteins in normal and diseased podocytes could yield new information on the pathobiology of nephrotic diseases and potential therapies. Although EM still has advantages for general identification of ultrastructural changes in disease, it is conceivable that simultaneous imaging of many proteins by SIM could bring functional microanatomy to a new level.
5. Summary and conclusions
We have demonstrated that SIM can resolve kidney podocyte substructure. The large scale yet high resolution view given by SIM of these features makes for remarkably detailed and information-rich images. SIM images of FITC-podocin recapitulate the podocyte substructure as observed by TEM, but go beyond this current gold standard by facilitating rapid diagnosis with 3D visualization and large en face views of foot processes which are almost impossible to obtain by TEM. This demonstration proves the validity of SIM as a diagnostic tool with potential savings in time and cost of diagnosis. Importantly our study shows SIM could form an integral component of a pathology department, enabling both rapid and low-cost diagnosis and advances in functional microanatomy.
Super-resolution optical microscopy techniques, such as SIM, show real promise to be disruptive technologies is a clinical setting and could potentially displace EM as the gold standard diagnostic tool in many cases. The modest but crucial resolution and contrast enhancement provided by SIM has enabled this study but, by widening the choice of fluorophore to include photoswitchable dyes, future studies could utilize more advanced, non-linear implementations of SIM which can achieve even greater resolution [17] and could apply to a wider range of ultrastructural studies.
Acknowledgments
We wish to thank Wa Chen and Joseph Albanese, of the Montefiore Surgical Pathology Translational Research Laboratory, for their expert work in preparing frozen sections and performing immunostaining. We thank the UK Engineering and Physical Sciences Research Council under grant EP/J0177X/1, the RS Macdonald Charitable Trust, the BRAINS 600th anniversary appeal, and Dr. Killick for funding. KD acknowledges the award of a Royal Society Leverhulme Trust Senior Fellowship.
References and links
- 1.Mundel P., Reiser J., “Proteinuria: an enzymatic disease of the podocyte?” Kidney Int. 77(7), 571–580 (2010). 10.1038/ki.2009.424 [DOI] [PMC free article] [PubMed] [Google Scholar]
- 2.Gundersen H. J. G., Seefeldt T., Østerby R., “Glomerular epithelial foot processes in normal man and rats. distribution of true width and its intra- and inter-individual variation,” Cell Tissue Res. 205(1), 147–155 (1980). 10.1007/BF00234450 [DOI] [PubMed] [Google Scholar]
- 3.Rodewald R., Karnovsky M. J., “Porous substructure of the glomerular slit diaphragm in the rat and mouse,” J. Cell Biol. 60(2), 423–433 (1974). 10.1083/jcb.60.2.423 [DOI] [PMC free article] [PubMed] [Google Scholar]
- 4.Grgic I., Brooks C. R., Hofmeister A. F., Bijol V., Bonventre J. V., Humphreys B. D., “Imaging of podocyte foot processes by fluorescence microscopy,” J. Am. Soc. Nephrol. 23(5), 785–791 (2012). 10.1681/ASN.2011100988 [DOI] [PMC free article] [PubMed] [Google Scholar]
- 5.Höhne M., Ising C., Hagmann H., Völker L. A., Brähler S., Schermer B., Brinkkoetter P. T., Benzing T., “Light microscopic visualization of podocyte ultrastructure demonstrates oscillating glomerular contractions,” Am. J. Pathol. 182(2), 332–338 (2013). 10.1016/j.ajpath.2012.11.002 [DOI] [PubMed] [Google Scholar]
- 6.Suleiman H., Zhang L., Roth R., Heuser J. E., Miner J. H., Shaw A. S., Dani A., “Nanoscale protein architecture of the kidney glomerular basement membrane,” eLife 2, e01149 (2013). [DOI] [PMC free article] [PubMed] [Google Scholar]
- 7.Unnersjö-Jess D., Scott L., Blom H., Brismar H., “Super-resolution stimulated emission depletion imaging of slit diaphragm proteins in optically cleared kidney tissue,” Kidney Int. (2015), doi:. 10.1038/ki.2015.308 [DOI] [PubMed]
- 8.Gustafsson M. G. L., “Surpassing the lateral resolution limit by a factor of two using structured illumination microscopy,” J. Microsc. 198(2), 82–87 (2000). 10.1046/j.1365-2818.2000.00710.x [DOI] [PubMed] [Google Scholar]
- 9.Gustafsson M. G. L., Shao L., Carlton P. M., Wang C. J. R., Golubovskaya I. N., Cande W. Z., Agard D. A., Sedat J. W., “Three-dimensional resolution doubling in wide-field fluorescence microscopy by structured illumination,” Biophys. J. 94(12), 4957–4970 (2008). 10.1529/biophysj.107.120345 [DOI] [PMC free article] [PubMed] [Google Scholar]
- 10.Neil M. A. A., Juškaitis R., Wilson T., “Method of obtaining optical sectioning by using structured light in a conventional microscope,” Opt. Lett. 22(24), 1905–1907 (1997). 10.1364/OL.22.001905 [DOI] [PubMed] [Google Scholar]
- 11.Schlichenmeyer T. C., Wang M., Elfer K. N., Brown J. Q., “Video-rate structured illumination microscopy for high-throughput imaging of large tissue areas,” Biomed. Opt. Express 5(2), 366–377 (2014). 10.1364/BOE.5.000366 [DOI] [PMC free article] [PubMed] [Google Scholar]
- 12.Roselli S., Gribouval O., Boute N., Sich M., Benessy F., Attié T., Gubler M.-C., Antignac C., “Podocin Localizes in the Kidney to the Slit Diaphragm Area,” Am. J. Pathol. 160(1), 131–139 (2002). 10.1016/S0002-9440(10)64357-X [DOI] [PMC free article] [PubMed] [Google Scholar]
- 13.Deegens J. K., Dijkman H. B., Borm G. F., Steenbergen E. J., van den Berg J. G., Weening J. J., Wetzels J. F., “Podocyte foot process effacement as a diagnostic tool in focal segmental glomerulosclerosis,” Kidney Int. 74(12), 1568–1576 (2008). 10.1038/ki.2008.413 [DOI] [PubMed] [Google Scholar]
- 14.Bozzola J. J., Russel L. D., Electron Microscopy: Principles and Techniques for Biologists, 2nd ed. (Jones and Bartlett Publishers, c1999), Chap. 2. [Google Scholar]
- 15.Pullman J., Nylk J., Campbell E. C., Gunn-Moore F. J., Prystowsky M. B., Dholakia K., “Data underpinning: Visualization of podocyte substructure with structured illumination microscopy (SIM): a new approach to nephrotic disease”. [DOI] [PMC free article] [PubMed]
- 16.Arakawa M., “A Scanning Electron Microscope Study of the Human Glomerulus,” Am. J. Pathol. 64(2), 457–466 (1971). [PMC free article] [PubMed] [Google Scholar]
- 17.Li D., Shao L., Chen B.-C., Zhang X., Zhang M., Moses B., Milkie D. E., Beach J. R., Hammer J. A., 3rd, Pasham M., Kirchhausen T., Baird M. A., Davidson M. W., Xu P., Betzig E., “Extended-resolution structured illumination imaging of endocytic and cytoskeletal dynamics,” Science 349(6251), aab3500 (2015). 10.1126/science.aab3500 [DOI] [PMC free article] [PubMed] [Google Scholar]


