Abstract
Optical coherence tomography (OCT) is an optical diagnostic modality that can acquire cross-sectional images of the microscopic structure of the esophagus, including Barrett’s esophagus (BE) and associated dysplasia. We developed a swallowable tethered capsule OCT endomicroscopy (TCE) device that acquires high-resolution images of entire gastrointestinal (GI) tract luminal organs. This device has a potential to become a screening method that identifies patients with an abnormal esophagus that should be further referred for upper endoscopy. Currently, the characterization of the OCT-TCE esophageal wall data set is performed manually, which is time-consuming and inefficient. Additionally, since the capsule optics optimally focus light approximately 500 µm outside the capsule wall and the best quality images are obtained when the tissue is in full contact with the capsule, it is crucial to provide feedback for the operator about tissue contact during the imaging procedure. In this study, we developed a fully automated algorithm for the segmentation of in vivo OCT-TCE data sets and characterization of the esophageal wall. The algorithm provides a two-dimensional representation of both the contact map from the data collected in human clinical studies as well as a tissue map depicting areas of BE with or without dysplasia. Results suggest that these techniques can potentially improve the current TCE data acquisition procedure and provide an efficient characterization of the diseased esophageal wall.
OCIS codes: (170.4500) Optical coherence tomography, (170.3880) Medical and biological imaging, (100.6950) Tomographic image processing, (170.6935) Tissue characterization, (170.1610) Clinical applications, (170.2680) Gastrointestinal
1. Introduction
Endoscopic examination of the upper gastrointestinal (GI) tract is costly, inconvenient, and typically requires the patient to be sedated [1]. Furthermore, endoscopy only provides macroscopic information from superficial tissue, and, as a result, biopsies must be excised in order to obtain a microscopic tissue diagnosis. Since only a limited number of samples can be acquired, endoscopic biopsy is prone to sampling error [2, 3]. This is problematic for many upper GI diseases, including Barrett’s esophagus (BE), esophageal adenocarcinoma, and celiac disease, where the condition can be focal and patchy in nature.
Optical coherence tomography (OCT) is an optical diagnostic modality that can produce cross-sectional images of microscopic structure of the esophagus, including BE and dysplasia [4, 5]. We have recently developed a swallowable tethered capsule endomicroscopy (TCE) device that can acquire microscopic OCT images of GI tract luminal organs in a relatively much more comfortable procedure that does not require conscious sedation or the assistance of endoscopy [6, 7]. The OCT-TCE procedure is also simple, as it does not need to be conducted in a specialized setting and can be performed by a nurse or other non-physician medical personnel. However, the capsule optics optimally focus light approximately 500 μm outside the capsule wall and the best quality images are obtained when the tissue is in a full contact with the capsule. Usually, peristalsis ensures this condition, but there are cases where the esophagus expands during the transit of the capsule. The current mode of operation for loss of contact is to stop the movement of the device and ask the patient to sip water, at which point the esophagus re-engages the capsule. It is therefore crucial for the catheter operator to receive feedback about tissue contact during the imaging procedure to acquire best quality data. Here, we present a method for the fully automated segmentation and two-dimensional representation of the contact map from the data collected in human upper GI TCE pilot studies. This information can be used to determine the quality of the TCE data set in terms of tissue contact.
TCE provides detailed information about tissue microstructure. By analyzing TCE images it is possible to characterize the esophageal wall, discriminating between squamous esophagus (TCE visualizes in detail squamous esophagus layered architecture) and BE with or without dysplasia (i.e., lack of layered structure) [6]. Ideally, a TCE data set is analyzed in its entirety. However, since it usually includes >1,000 cross-sectional images, the current method of manual analysis is an inefficient time consuming procedure which requires several hours of work by an expert image reader. In order to become a suitable solution for a screening, the data should be processed automatically and a tissue map depicting the status of the entire esophagus with highlighted presence of abnormalities should be available immediately after acquisition. The feasibility of semi-automatic computer methods for the analysis of esophageal tissue by OCT has been demonstrated [8–10]. In this study, we propose a fully automated tissue characterization algorithm, capable of identifying BE through entire three-dimensional (3D) data sets, acquired in vivo. Both algorithms for the segmentation and tissue characterization were validated against manual analysis of an expert image reader.
2. Methods
2.1 Imaging system
The TCE system used in this study comprises an OCT imaging console, an optical rotary junction and catheter [6]. The previously described OCT system [6] utilizes a polygon based wavelength-swept laser centered at 1290 nm that provides an axial resolution of 10 μm and A-line rate of 40 kHz. The TCE catheter is a small capsule (11 x 24.5 mm), attached to the distal end of a thin, 1.6 m long, flexible tether (Fig. 1). The tether encloses an optical fiber that delivers light from the OCT system to the capsule, where the fiber is terminated with micro optics that redirect and focus the light immediately outside of the capsule’s housing. Cross-sectional imaging is accomplished through one turn of the rotary junction that scans the beam along the circumference of the capsule and surrounding esophagus. During each rotation, 2,048 A-lines are obtained and displayed in real-time at a rate of 20 frames per second. Multiple cross-sectional images of the esophagus are acquired as the capsule passively descends the organ or is manually pulled up using the tether. The catheter is designed so that it can be disinfected and reused.
Fig. 1.
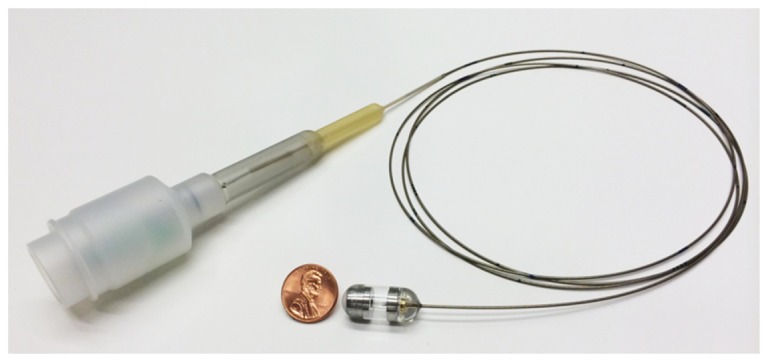
The tether encloses an optical fiber that delivers light from the OCT system through the capsule. The capsule encloses micro optics capable of redirecting and focusing the light laterally and immediately outside of its housing for side viewing imaging. Cross sectional imaging is accomplished by spinning micro optics in the capsule and fiber proximally at a speed of 20 frames per second by the means of a rotary junction.
2.2 Image processing algorithm
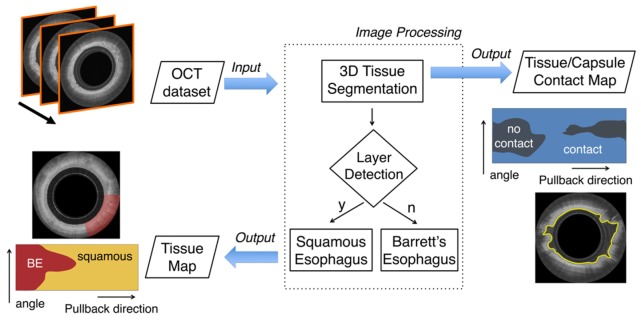
We developed a fully automated framework capable of segmenting and characterizing esophageal tissue over the entire 3D OCT-TCE data set (Fig. 2). The proposed algorithm receives a stack of OCT images as its input. As a first step, the esophageal lumen is automatically segmented, determining the axial position of the surface of the tissue for each A-line. Segmentation results can be further processed to generate a 2D en face map depicting the contact (or the lack of contact) between the imaging capsule and the tissue for the entire data set. Subsequently, a layer detection algorithm is applied, characterizing the esophageal wall identifying squamous (normal) esophagus versus BE. To conclude the processing framework, a tissue characterization map is also generated.
Fig. 2.
Flowchart of the entire automated processing framework. The algorithm receives as its input an entire OCT pullback data set that typically comprises >1,000 images. Initially, the algorithm automatically locates the position of the tissue’s surface over the entire 3D data set and then tissue characteristics are assigned. Squamous esophagus is differentiated from BE (with or without dysplasia) tissue by identifying the presence of horizontal layers. The output of the algorithm is a tissue map of the entire data set, automatically depicting the presence of BE and a contact map showing areas that lack contact between the capsule and the tissue.
2.2.1 Lumen segmentation
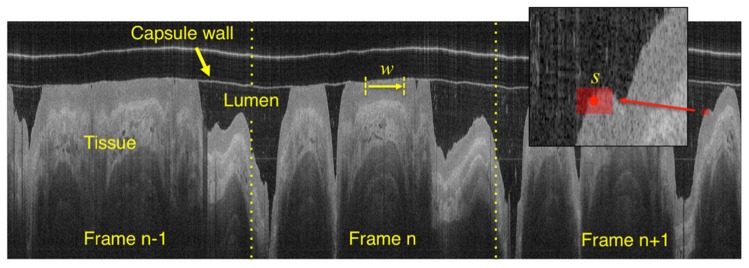
The objective of the segmentation algorithm is to provide a fully automated, accurate and time efficient quantification of the esophageal wall position along the entire data set. Given that TCE data are acquired by the means of a continuous helical scan, the entire 3D data set can be represented as a single image obtained by concatenating individual polar coordinate images next to each other (Fig. 3) and thus segmented in its entirety by analyzing a single digital image [11]. OCT images are preprocessed reducing the image background noise by subtracting the lowest 10% pixel intensity computed using the image histogram [12].
Fig. 3.
An entire OCT data set can be displayed as a single image by concatenating adjacent frames. w indicates the window used for binarization and s is the rectangular structuring element used for morphological image dilation/erosion following binarization.
In the initial segmentation step, an adaptive binarization technique (i.e., Otsu’s method) is applied along the pullback direction by the means of a translating window w (without overlap) having a size of 256 pixels (Fig. 3). This processing method corrects for changes in image illumination that may affect the acquisition procedure. Subsequently, the resulting binary image is processed with the purpose of retaining the esophageal wall only. For this purpose, ad hoc morphological operations are applied: 1) binary morphological image dilation [13] by the means of a rectangular structuring element s (5 by 11 pixels), having the longer dimension oriented along the pullback direction. For this operation, the structuring element is translated along the entire input binary image. For each translation location, if any pixel in the input image within the structuring element is equal to one, then the output pixel is set to one. 2) an area opening procedure eliminating all the 4-connected components with an area below an arbitrary threshold (5000 pixels, in this case), and 3) morphological erosion with the same structuring element used in step 1. In this way, by using textural properties of the esophageal wall and its spatial continuity, it is possible to discriminate the wall from the lumen and intraluminal debris. To conclude the segmentation procedure, a cubic spline with a high smoothing value is fitted through the entire esophageal profile. Importantly, this final step corrects for irregularities in the tissue contour, taking advantage of the 3D spatial continuity of the organ. At the end of the segmentation procedure, it is possible to automatically generate a 2D en face map of the capsule/tissue contact, depicting the area where there is lack of contact. In this study, lack of contact is arbitrarily defined as tissue with a distance >0.3 mm from the imaging capsule.
2.2.2 Tissue characterization
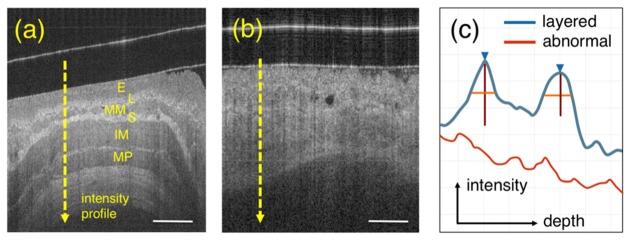
Figure 4 shows representative examples of squamous esophagus (normal tissue) and BE. From Fig. 4(a) it is possible to appreciate that OCT is capable of delineating the layered structure of the squamous esophagus, including the squamous epithelium (E), lamina propria (L), muscularis mucosa (MM), submucosa (S), inner muscularis (IM) and outer muscolaris (OM). In contrast, BE with or without dysplasia is defined as the absence of such layered structure by OCT imaging [5, 6] (Fig. 4(b)).
Fig. 4.
Layer detection. (a) shows a representative OCT image of squamous esophagus where the typical layers are visible: squamous epithelium (E), lamina propria (L), muscularis mucosa (MM), submucosa (S), inner muscularis propria (IM) and outer muscularis propria (OM). (b) shows an example of BE tissue where the layers characterizing normal esophagus are absent. (c) schematic A-lines for both layered normal esophagus (from lumen to IM – blue line) and BE (red).. Blue arrow and vertical/horizontal lines correspond to peak position, height and width measured at half-height, respectively. Scale bar equal to 500 µm.
OCT data are generated acquiring individual A-lines (as described in section 2.1) where the intensity of the backscattered light is plotted as a function of depth. Looking at the profile of such A-lines (Fig. 4(c)) it is possible to observe that the lamina propria and the submucosa appear as sharply defined, high intensity peaks, showing a rapid rise and fall of the OCT signal intensity. On the other hand, BE A-lines appear as a single layer of weakly attenuating tissue following an exponential decay [14, 15].
On the basis of these observations, we developed an automated algorithm for the classification of A-scan lines aiming to discriminate between normal esophagus versus BE (with or without dysplasia), by detecting image layers. Prior to classification, image noise is reduced by applying a 2D median filter using a square kernel having a size of 11 pixels. Starting from the beginning of the A-line (defined during the segmentation procedure) the intensity profile is analyzed looking for the presence of “significant” peaks. As a first step, local maxima of the signal are computed. Subsequently, the prominence of all the local maxima is analyzed. Peak prominence is a measure of its height and location with respect to other peaks [16]. As showed in Fig. 4(c), in squamous mucosa, both the lamina propria and submucosa generate two peaks that significantly stand out with respect to the others. In comparison, BE does not show a peak with elevated prominence. Therefore, A-scan lines showing at least one peak with a “significant” prominence are classified as containing squamous esophagus, where “significant” is defined as a peak having a prominence higher than a predefined threshold tp>25 pixels. A-scan line analysis can be applied to an entire image or data set, culminating in analysis of the OCT data set in its entirety. To conclude the tissue characterization procedure, classification results are corrected as follows: 1) a 2D en face map of tissue characteristics is created for the entire data set; 2) spatial continuity is applied by the means of a median filter with a kernel size of 7 pixels and by an area opening procedure eliminating isolated regions with a pixel area <10,000 pixels. In the 2D tissue map, squamous tissue is colorized in yellow, BE in red; tissue that has lost contact with the capsule is shown in gray.
2.2.3 Parameter tuning and algorithm implementation
Optimal values for the algorithm parameters were empirically determined over a training-set generated using multiple images from a total of 3 different in vivo OCT TCE pullbacks. The values of the different parameters were determined in the presence of common artifacts such as non-uniform rotation distortion (NURD), debris in the lumen, and changes in image illumination. The algorithm was implemented using software Matlab R2014b (MathWorks, Natick, MA) and additional toolboxes: curve fitting toolbox, computer vision system toolbox, image processing toolbox, optimization toolbox, signal processing toolbox, and statistics toolbox. Processing time was evaluated on an 8-core Mac Pro desktop computer with 64 Gb of RAM.
3. Data acquisition
Data were acquired in vivo from healthy volunteers and subjects with esophageal abnormalities enrolled in the TCE clinical study (Partners IRB Protocol P-2011-2619). During the procedure, unsedated subjects first swallowed the capsule with the aid of water. The operator collected OCT images by letting the capsule traverse all the way to the stomach and then pull it up to the proximal esophagus. That procedure was repeated up to two times to make sure that best quality data was obtained. During the procedure, if the contact between the capsule and the esophageal tissue was suboptimal, subjects were asked to dry swallow or sip on water to re-engage peristalsis. After the imaging portion of the procedure was completed, the catheter was pulled out, disinfected and tested for signs of wear before reuse. An algorithm training-set was generated using a total of 3 different in vivo OCT pullbacks (obtained from 1 normal and 2 abnormal subjects) and a test-set was generated from 4 in vivo OCT data sets (obtained from 2 normal and 2 abnormal subjects).
4. Validation
The algorithm was validated by comparing automated to manual OCT image segmentation performed by an expert image reader (gold standard). Four (4) data sets from 4 different patients were automatically segmented by the algorithm. To avoid bias in the validation, 100 images were randomly extracted and compared to manual segmentation. Segmentation accuracy was quantified by the means of Dice similarity coefficient (2D assessment) and by comparing manual to automated segmentation on individual A-scan-lines (1D assessment), quantifying the difference between the two measurements, and using Pearson’s correlation coefficient.
To validate the tissue characterization algorithm, an expert image reader, blinded to automated tissue characterization results, delineated areas of normal and BE using criteria previously established [5] identifying 25 images containing squamous and 25 additional images showing BE wall appearance. These images were automatically analyzed and the algorithm performance was quantified computing accuracy, sensitivity and specificity for the classification of all A-scan lines in each image. The processing time for both segmentation and tissue classification steps were also quantified.
5. Results
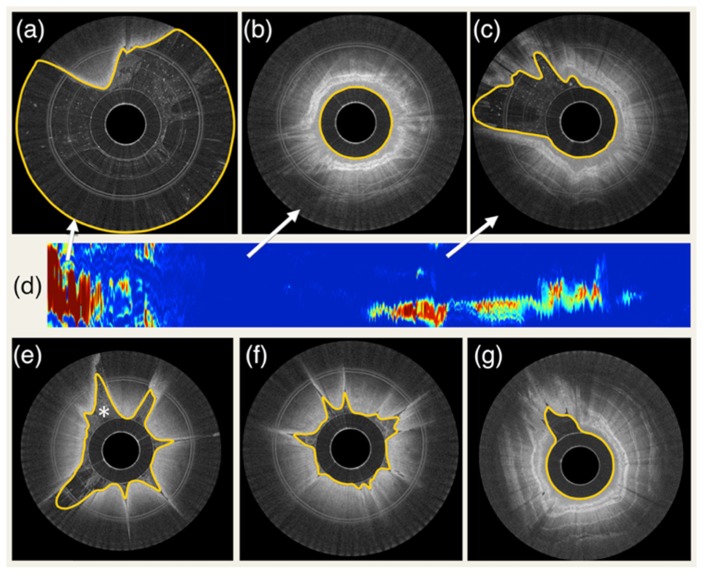
An example of the automated esophageal wall segmentation is shown in Fig. 5. Results for different degrees of contact are illustrated. As it is possible to appreciate in (d), automated segmentation allows the visualization of a 2D map that is representative of capsule-tissue contact for the entire data set. For all 100 randomly selected images, a Dice correlation coefficient of 0.983 ± 0.014 (mean and standard deviation) was found. In addition, algorithm validation demonstrated a 1D segmentation error of 17.7 µm (approximately equal to twice the axial resolution of the imaging system) ± 44.3 µm with a correlation coefficient between automated and manual measurements r = 0.979. The processing time was on average 38 ± 4 ms per image.
Fig. 5.
Example of segmentation results and tissue contact analysis. (a) capsule in the stomach with very low tissue contact, (b) capsule in the esophagus with complete contact, (c) capsule partially touching the esophageal wall (d) 2D contact map automatically generated by segmenting the entire data set. Colormap ranges from blue to red, where blue corresponds to full contact and red corresponds to no contact. (e) example of segmentation with the presence of intraluminal debris (indicated by *). (f) and (g) additional examples of fully automated segmentation results.
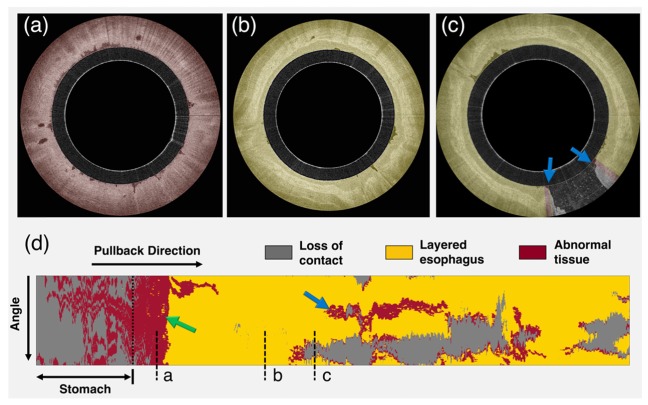
Figure 6 shows an example of tissue characterization for an entire OCT data set obtained in a subject with history of BE. An example of cross-sectional image analysis is given for both squamous and BE and a 2D map of tissue type is generated, depicting the Barrett’s distribution. A BE short segment (green arrow in Fig. 6) was found between the stomach and squamous esophagus. A linear region, likely corresponding to an esophageal folding artifact was also classified as BE (blue arrow in Fig. 6).
Fig. 6.
Example of tissue characterization results. (a)OCT cross sectional image of BE,(b)squamous and(c)lack of contact at 5 o’clock. (d) Tissue 2D map depicting BE tissue distribution. Yellow color indicates tissue classified as squamous esophagus, red color depicts BE (green arrow) and grey color corresponds to lack of contact. Blue arrow indicates folding artifact (see section 6.1).
Tissue analysis validation over 50 images, showed an A-scan line classification accuracy of 94% with a sensitivity and specificity of 94% and 93%, respectively. The average processing time was ~1 second per image.
6. Discussion
In this work, we developed a fully automated method for the segmentation and characterization of esophageal tissue using OCT-TCE in vivo clinical data. A validation study showed strong correlation with expert image reader assessment indicating that automated analysis of TCE data was achieved. Time-efficient segmentation of TCE data was capable of providing the position of the capsule and esophageal wall for each individual image A-scan line automatically, assessing the quality of an entire data set based on the presence or lack of contact between capsule and tissue. The absence of contact can cause the tissue to be out of focus, resulting in a reduced contrast image (Fig. 7(a)). Additionally, the tissue can also fall outside the OCT system’s image range (Fig. 7(b)). If applied on-line, during the imaging procedure, this method can provide helpful information to optimize the data acquisition procedure, allowing swallowing intervention to take place if the capsule loses contact (i.e., stop and restart the imaging acquisition procedure when adequate contact is obtained) and enabling a rapid and complete assessment of the overall quality of the TCE data set. Therefore, the proposed algorithm can ensure that a pullback with acceptable image quality has been acquired before concluding the imaging procedure. In addition, this technique will also be helpful in post-processing techniques to accelerate three-dimensional rendering of the data sets, replacing manual analysis that is currently needed [6, 17].
Fig. 7.
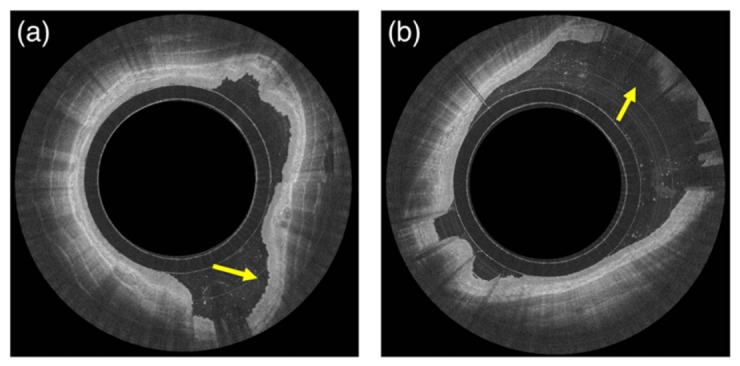
Examples of lack of contact. Image (a) shows an example of squamous esophagus and tissue out of capsule focus with reduced image contrast between the different layers (arrow). Image (b) shows an example of tissue out of the system and capsule image range (arrow).
In addition to tissue segmentation, a fully automated framework capable of characterizing esophageal tissue was developed, discriminating squamous tissue from non-layered appearance of BE with or without dysplasia. The algorithm was validated against the manual analysis of an expert image reader showing a high degree of agreement, indicating that the automated characterization of esophageal wall is feasible. Additional validation using histology as the gold standard is merited. Also, the proposed algorithm was applied to an entire TCE data set acquired in vivo, showing its ability to depict tissue types of an entire esophageal segment (Fig. 6). The proposed methods have the potential to improve the current data acquisition procedure and provide a more efficient analysis of the diseased esophageal wall.
6.1 Limitations and further developments
In this study, an agreement of 94% was found comparing automated to expert manual tissue classification. Since clinical TCE data are acquired by the means of peristalsis to obtain optimal tissue and capsule contact, in some images, it is possible to observe an effect known as “folding artifact” (FA) (blue arrow in Fig. 6). Such artifacts consist of squamous tissue that folds over the imaging capsule causing layers that typify squamous esophagus to become less visible in the OCT image (Fig. 8). In this situation, the proposed algorithm misclassified folded squamous esophagus, such as those seen around areas of lack of contact, as BE. In order to address this issue, the proposed framework may be further expanded including tissue backscattering quantification (e.g., by the means of texture analysis such as co-occurrence matrices [18] and wavelet analysis), however this would significantly increase algorithm complexity and processing time. Since these artifacts usually manifest as longitudinal stripes along the esophagus, it is also possible to remove them computationally using shape analysis image processing techniques and ignoring areas in the proximity of regions that demonstrate lack of contact. The occurrence of folding artifacts is significantly lower in VLE devices that use balloon-centering catheters [19–21], where catheter and tissue contact is optimized by inflating a larger diameter balloon during the imaging procedure.
Fig. 8.
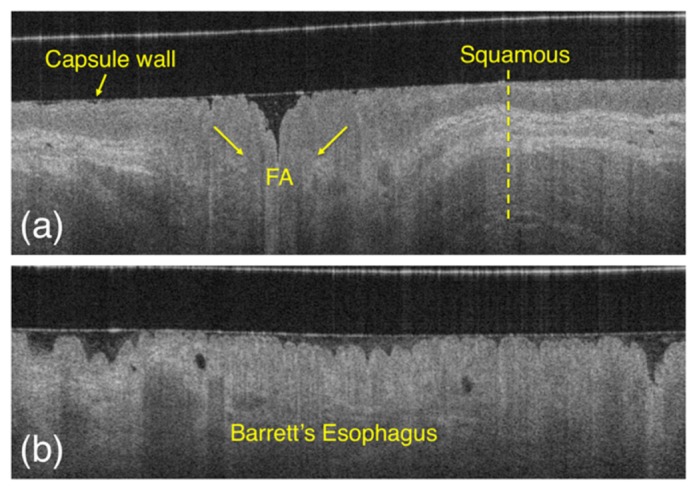
Appearance of squamous esophagus (a) compared to BE (b) and folded squamous tissue, or the so called “folding artifact” (FA). As it is possible to appreciate from the image, folded squamous esophagus appearance is similar to BE, as the layers that typify squamous mucosa disappear on the OCT image.
A Matlab implementation of the proposed algorithms resulted in a processing time of approximately 38 ms for the segmentation of a single image, with each image comprising 2,048 A-lines, and the tissue classification step required <1 second per image, on average. Although these results showed a significant improvement over manual analysis of TCE data, further improvements in computational efficiency will be useful for real-time applications. The processing time can be decreased through code optimization and implementation in a lower level language. As mentioned above, efforts in this study were made to keep algorithm complexity low (avoiding computationally intensive methods, such as co-occurrence matrix or wavelet analysis) and both segmentation and tissue characterization steps are obtained by processing individual A-lines (or bulk of A-lines) in series. This kind of approach makes the proposed algorithms suitable for a GPU parallel programming model, with the potential to achieve a real-time analysis of entire TCE data sets.
A last consideration is about the proposed tissue classification scheme. In this study, we developed an algorithm capable of discriminating between squamous and BE with or without dysplasia. It is possible to argue that the proposed scheme can be further expanded for the automated discrimination of low-grade vs. high-grade dysplasia. Although the typical layers characterizing squamous esophagus can be visually recognized in OCT images, making it possible to discriminate Barrett’s, the difference between BE with or without dysplasia is not as remarkable. Some criteria have been proposed for this purpose, such as presence of glands, surface maturation (i.e., increased superficial backscattering) and tissue homogeneity. However, OCT-TCE validation studies using histopathology as gold standard still need to be conducted. It will be the scope of future studies to further expand the proposed framework for the differentiation of premalignant conditions such as nondysplastic BE dysplasia, low grade, high grade dysplasia, and invasive cancer using TCE data.
7. Conclusion
In this study, we developed a fully automated framework for the segmentation and characterization of esophageal wall using OCT-TCE in vivo clinical data. The algorithm has been validated, showing a high degree of agreement with the analysis of an expert image reader. The proposed methods may be useful for improving the current TCE data acquisition procedure and for automatically classifying the esophageal wall.
Acknowledgements
This work was supported in part by US National Institutes of Health grant NIH R01CA103769 (GJT). Disclosure: Massachusetts General Hospital has a licensing arrangement with NinePoint Medical. Drs. Tearney, Nishioka, and Gora have the rights to receive royalties as part of this licensing arrangement.
References and links
- 1.Thota P. N., Zuccaro G., Jr, Vargo J. J., 2nd, Conwell D. L., Dumot J. A., Xu M., “A randomized prospective trial comparing unsedated esophagoscopy via transnasal and transoral routes using a 4-mm video endoscope with conventional endoscopy with sedation,” Endoscopy 37(6), 559–565 (2005). 10.1055/s-2005-861476 [DOI] [PubMed] [Google Scholar]
- 2.Melson J., Desai V., Greenspan M., Yau S., Abdalla M., Dhanekula R., Mobarhan S., Shapiro D., Losurdo J., Jakate S., “Negative surveillance endoscopy occurs frequently in patients with short-segment non-dysplastic Barrett’s esophagus,” Dis. Esophagus 28(7), 660–665 (2015). [DOI] [PubMed] [Google Scholar]
- 3.Wong Kee Song L. M., Wilson B. C., “Endoscopic detection of early upper GI cancers,” Best Pract. Res. Clin. Gastroenterol. 19(6), 833–856 (2005). 10.1016/j.bpg.2005.04.006 [DOI] [PubMed] [Google Scholar]
- 4.Yun S. H., Tearney G. J., Vakoc B. J., Shishkov M., Oh W. Y., Desjardins A. E., Suter M. J., Chan R. C., Evans J. A., Jang I. K., Nishioka N. S., de Boer J. F., Bouma B. E., “Comprehensive volumetric optical microscopy in vivo,” Nat. Med. 12(12), 1429–1433 (2007). 10.1038/nm1450 [DOI] [PMC free article] [PubMed] [Google Scholar]
- 5.Suter M. J., Gora M. J., Lauwers G. Y., Arnason T., Sauk J., Gallagher K. A., Kava L., Tan K. M., Soomro A. R., Gallagher T. P., Gardecki J. A., Bouma B. E., Rosenberg M., Nishioka N. S., Tearney G. J., “Esophageal-guided biopsy with volumetric laser endomicroscopy and laser cautery marking: a pilot clinical study,” Gastrointest. Endosc. 79(6), 886–896 (2014). 10.1016/j.gie.2013.11.016 [DOI] [PMC free article] [PubMed] [Google Scholar]
- 6.Gora M. J., Sauk J. S., Carruth R. W., Gallagher K. A., Suter M. J., Nishioka N. S., Kava L. E., Rosenberg M., Bouma B. E., Tearney G. J., “Tethered capsule endomicroscopy enables less invasive imaging of gastrointestinal tract microstructure,” Nat. Med. 19(2), 238–240 (2013). 10.1038/nm.3052 [DOI] [PMC free article] [PubMed] [Google Scholar]
- 7.Gora M. J., Sauk J. S., Carruth R. W., Lu W., Carlton D. T., Soomro A., Rosenberg M., Nishioka N. S., Tearney G. J., “Imaging the upper gastrointestinal tract in unsedated patients using tethered capsule endomicroscopy,” Gastroenterology 145(4), 723–725 (2013). 10.1053/j.gastro.2013.07.053 [DOI] [PMC free article] [PubMed] [Google Scholar]
- 8.Garcia-Allende P. B., Amygdalos I., Dhanapala H., Goldin R. D., Hanna G. B., Elson D. S., “Morphological analysis of optical coherence tomography images for automated classification of gastrointestinal tissues,” Biomed. Opt. Express 2(10), 2821–2836 (2011). 10.1364/BOE.2.002821 [DOI] [PMC free article] [PubMed] [Google Scholar]
- 9.Qi X., Pan Y., Sivak M. V., Willis J. E., Isenberg G., Rollins A. M., “Image analysis for classification of dysplasia in Barrett’s esophagus using endoscopic optical coherence tomography,” Biomed. Opt. Express 1(3), 825–847 (2010). 10.1364/BOE.1.000825 [DOI] [PMC free article] [PubMed] [Google Scholar]
- 10.Qi X., Sivak M. V., Isenberg G., Willis J. E., Rollins A. M., “Computer-aided diagnosis of dysplasia in Barrett’s esophagus using endoscopic optical coherence tomography,” J. Biomed. Opt. 11(4), 044010 (2006). 10.1117/1.2337314 [DOI] [PubMed] [Google Scholar]
- 11.Ughi G. J., Verjans J., Fard A. M., Wang H., Osborn E., Hara T., Mauskapf A., Jaffer F. A., Tearney G. J., “Dual modality intravascular optical coherence tomography (OCT) and near-infrared fluorescence (NIRF) imaging: a fully automated algorithm for the distance-calibration of NIRF signal intensity for quantitative molecular imaging,” Int. J. Cardiovasc. Imaging 31(2), 259–268 (2015). [DOI] [PMC free article] [PubMed] [Google Scholar]
- 12.Ughi G. J., Adriaenssens T., Onsea K., Kayaert P., Dubois C., Sinnaeve P., Coosemans M., Desmet W., D’hooge J., “Automatic segmentation of in-vivo intra-coronary optical coherence tomography images to assess stent strut apposition and coverage,” Int. J. Cardiovasc. Imaging 28(2), 229–241 (2012). 10.1007/s10554-011-9824-3 [DOI] [PubMed] [Google Scholar]
- 13.Haralick R. M., Shapiro L. G., Computer and Robot Vision, Vol. I (1992). [Google Scholar]
- 14.Schmitt J. M., Knüttel A., Yadlowsky M., Eckhaus M. A., “Optical-coherence tomography of a dense tissue: statistics of attenuation and backscattering,” Phys. Med. Biol. 39(10), 1705–1720 (1994). 10.1088/0031-9155/39/10/013 [DOI] [PubMed] [Google Scholar]
- 15.Vermeer K. A., Mo J., Weda J. J., Lemij H. G., de Boer J. F., “Depth-resolved model-based reconstruction of attenuation coefficients in optical coherence tomography,” Biomed. Opt. Express 5(1), 322–337 (2014). 10.1364/BOE.5.000322 [DOI] [PMC free article] [PubMed] [Google Scholar]
- 16.“Matlab R2015a Documentation” (MathWorks, 2015), retrieved June 16th, 2015, http://www.mathworks.com/help/signal/ref/findpeaks.html.
- 17.Ughi G. J., Adriaenssens T., Desmet W., D’hooge J., “Fully automatic three-dimensional visualization of intravascular optical coherence tomography images: methods and feasibility in vivo,” Biomed. Opt. Express 3(12), 3291–3303 (2012). 10.1364/BOE.3.003291 [DOI] [PMC free article] [PubMed] [Google Scholar]
- 18.Ughi G. J., Adriaenssens T., Sinnaeve P., Desmet W., D’hooge J., “Automated tissue characterization of in vivo atherosclerotic plaques by intravascular optical coherence tomography images,” Biomed. Opt. Express 4(7), 1014–1030 (2013). 10.1364/BOE.4.001014 [DOI] [PMC free article] [PubMed] [Google Scholar]
- 19.Wolfsen H. C., Sharma P., Wallace M. B., Leggett C., Tearney G., Wang K. K., “Safety and feasibility of volumetric laser endomicroscopy in patients with Barrett’s esophagus (with videos),” Gastrointest. Endosc. 82(4), 631–640 (2015). 10.1016/j.gie.2015.03.1968 [DOI] [PubMed] [Google Scholar]
- 20.Leggett C. L., Gorospe E., Owens V. L., Anderson M., Lutzke L., Wang K. K., “Volumetric laser endomicroscopy detects subsquamous Barrett’s adenocarcinoma,” Am. J. Gastroenterol. 109(2), 298–299 (2014). 10.1038/ajg.2013.422 [DOI] [PMC free article] [PubMed] [Google Scholar]
- 21.Swager A. F., Boerwinkel D. F., de Bruin D. M., Faber D. J., van Leeuwen T. G., Weusten B. L., Meijer S. L., Bergman J. J., Curvers W. L., “Detection of buried Barrett’s glands after radiofrequency ablation with volumetric laser endomicroscopy,” Gastrointest. Endosc. In press (2015). [DOI] [PubMed]


