Abstract
Fungal keratitis is an infection of the cornea by fungal pathogens. Diagnosis methods based on optical microscopy could be beneficial over the conventional microbiology method by allowing rapid and non-invasive examination. Reflectance confocal microscopy (RCM) and two-photon second harmonic generation microscopy (TPSHGM) have been applied to pre-clinical or clinical studies of fungal keratitis. In this report, RCM and TPSHGM were characterized and compared in the imaging of a fungal keratitis rabbit model ex vivo. Fungal infection was induced by using two strains of fungi: aspergillus fumigatus and candida albicans. The infected corneas were imaged in fresh condition by both modalities sequentially and their images were analyzed. Both RCM and TPSHGM could detect both fungal strains within the cornea based on morphology: aspergillus fumigatus had distinctive filamentous structures, and candida albicans had round structures superficially and elongated structures in the corneal stroma. These imaging results were confirmed by histology. Comparison between RCM and TPSHGM showed several characteristics. Although RCM and TPSHGM images had good correlation each other, their images were slightly different due to difference in contrast mechanism. RCM had relatively low image contrast with the infected turbid corneas due to high background signal. TPSHGM visualized cells and collagen in the cornea clearly compared to RCM, but used higher laser power to compensate low autofluorescence. Since these two modalities provide complementary information, combination of RCM and TPSHGM would be useful for fungal keratitis detection by compensating their weaknesses each other.
OCIS codes: (170.0170) Medical optics and biotechnology, (170.1790) Confocal microscopy, (170.2520) Fluorescence microscopy, (170.4470) Ophthalmology
1. Introduction
Microbial keratitis is an inflammation of the eye’s cornea and its causes could be bacterial, fungal, viral, or protozoal. Accurate diagnosis by determining correct etiology is critical for successful therapy [1, 2]. Microscopic examination of cultured specimens is the gold standard for etiologic diagnosis. However, this microbiologic method takes some time in definitive identification of the causative agent and this may delay the diagnosis [3, 4]. Optical microscopy based diagnosis methods may overcome the limitations of the current microbiologic method by providing rapid and non-invasive visualization of detailed structures within the cornea. Microscopic techniques applied to corneal studies include reflectance confocal microscopy (RCM) and two-photon and second harmonic generation microscopy (TPSHGM). These methods allow in vivo visualization of detailed structures at the cellular level for identification of the causasive agent, and can be used to make repeated observations for follow-up.
RCM is a 3D optical microscopic technique based on light reflection which provides information of micro-structures at the cellular level within tissue [5]. RCM has been applied to various pre-clinical and clinical studies of corneal infection and was reported to be useful as a non-invasive diagnosis method of acanthamoeba and fungal keratitis [6,7]. However, RCM has some difficulty in imaging infected turbid corneas due to increased background and does not detect structural alterations in the stroma of infected corneas [8–10]. TPSHGM is another 3D microscopic technique based on nonlinear two-photon excitation of fluorophores and second harmonic generation, and it visualizes cells and collagen in the cornea based on autofluorescence (AF) and second harmonic generation (SHG), respectively [11–14]. TPSHGM has been applied to pre-clinical studies of mouse eyes, porcine eyes and human infected corneas ex vivo [15–18]. Pathogens were detected with relatively high autofluorescence in the regions of disorganized stroma visualized by SHG signal of collagen [16]. A multimodal method combining RCM and TPSHGM was developed [19]. Comparison between the two imaging modalities would be useful for performance characterization. There have been comparison studies using human pathologic samples ex vivo and a mouse suture model in vivo [8, 20].
In this study, both RCM and TPSHGM were applied to a fungal keratitis rabbit model ex vivo. Two representative fungal strains, aspergillus fumigatus and candida albicans, were used as infecting pathogens. Infected rabbit corneas were imaged ex vivo by both modalities sequentially, and their images were analyzed and compared with histology.
2. Materials and methods
2.1 Sample preparation
Two strains of fungi, aspergillus fumigatus and candida albicans, were used in this study. Both fungal cells in acqueous media and infected rabbit corneas with these fungal cells were imaged. For fungal cell samples in acqueous media, fungal specimens in solid buffer state were received from Asan Medical Center (AMC). Part of the solid buffer was transferred to an Eppendorf tube with 500 μl distilled water, centrifuged under 4,000 x g for approximately 10 min at 4 °C, and mixed by pipetting. 50 μl of the solution was placed into a well-slide glass, coverslipped, and sealed with nail polish. These fungal cell samples were used for testing autofluorsecence (AF)–based TPM imaging.
The experimental procedures were approved by Institutional Animal Care and Use Committee (IACUC, approval number 2015-13-096) of Asan Medical Center (AMC). Four New Zealand white rabbits, weighing 1.5-2.5 kg, were used for the fungal keratitis model: two for aspergillus fumigatus infection model and two for candida albicans infection model. In order to show the consistency of the infection features, image sets of all four prepared samples were shown. Intrastromal infection method was used to establish fungal corneal keratitis [21]. The rabbits were anesthetized by intramuscular (IM) injection of a mixture of ketamine (40 mg/kg body weight) and xylazine (10 mg/kg body weight). The central part of the cornea was gently scraped with a 15-0-0 surgical blade until the stromal layer was exposed. After the removal of the epithelium layer, a surgical needle (30 gauge) containing fungal pathogen paste was directly applied to the corneal stromal layer by intrastromal injection. After 5 days, the rabbit eyes were examined for infection by a slit-lamp microscope. If rabbit corneas developed haziness and corneal scars, then the eyeballs were enucleated and imaged by microscopic system. A customized acylic holder was used to hold the eyeball upward and secure their position during imaging. The eyeballs were immersed in phosphate-buffered saline (PBS) during imaging to prevent dehydration. All the eye samples were imaged within 12 hours after enucleation in order to conduct imaging in fresh condition. After imaging, the rabbit eyeballs were immediately fixed in 4% formalin solution at 4 °C for at least 12 hours. After fixation, the infected corneas were torn off from the eye globes and were isolated and washed in PBS solution, followed by embedding in paraffin block. The paraffin block samples were sectioned with thickness of 10 µm and then stained using Periodic acid–Schiff stain for histological analysis of infiltrating leukocytes and fungus.
2.2 Imaging system
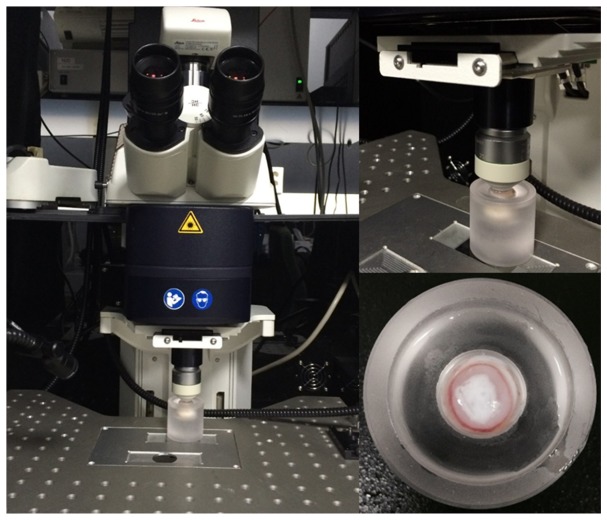
All imaging was performend using a Leica SP5 scanning microscope system which has both RCM and TPSHGM functionalities. The system had continuous-wave (CW) lasers of various wavelengths for RCM and a Titanium Sapphire laser (Chameleon vision, Coherent) for TPSHGM. RCM used a 633 nm He-Ne laser for the light source. TPSHGM used 790 nm wavelength for AF and SHG imaging. Emission light was collected by non-descanned mode (NDD) and spectrally separated to 2 channels by using a combination of two dichroic mirrors (455LP, 560LP, Chroma Tehcnology). SHG signal was collected by using a bandpass filter (HQ400/20, Chroma Technology). AF signal was collected between 455 nm and 560 nm without emission filter. A 25X objective lens (HCX IRAPO L 25X 0.95 NA water immersion, Leica) was used for both RCM and TPSHGM imaging. Images in the x-y plane consisting of 512 x 512 pixels were typically acquired, and the field of view (FOV) was 310 µm x 310 µm. Input laser power was 7.5 mW and 24.3 mW for RCM and TPSHGM, respectively. The excitation power was measured by power meter (s144C, Thorlabs) at the sample. We did not observe noticeable structural damage to the imaged rabbit corneal tissues. The imaging speed was 0.2 frames/s for both cases. 3D imaging was performed by acquiring multiple x-y plane images with stepwise increment of 1 µm in the z direction. Average imaging time was 10 - 15min. PBS solution was used as immersion media between the sample and objective lens.
3. Results
3.1 TPM imaging of fungal cells in acqueous media
In order to test TPM imaging of fungal cells based on AF, two fungal cell samples in aqueous media were imaged and results are shown in Fig. 1. TPM images of aspergillus fumigatus and candida albicans are shown in (a) and (b), respectively. These are maximum projection images (MPI) from 3D TPM data. TPM image of aspergillus fumigatus in Fig. 1(a) shows branched filamentous structures with 2-10 µm width, in hyphae form. TPM image of candida albicans in Fig. 1(b) shows round yeast-like structures with 5-10 µm diameter. TPM could visualize both fungal strains based on AF, and these fungal strains had distinctive morphologies.
Fig. 1.
Leica SP5 scanning microscope system and acrylic eye holder.
3.2 Aspergillus fumigatus infected corneas ex vivo
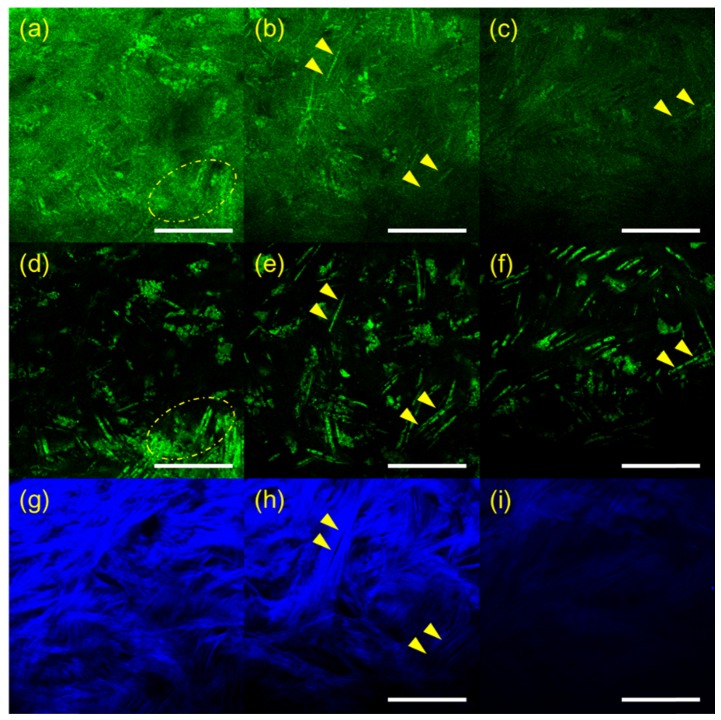
RCM and TPSHGM experiments of aspergillus fumigatus-infected rabbit corneas were conducted twice, and representative results of the two experiments are shown in Fig. 2 and Fig. 3, respectively. Figure 2 shows 3D RCM and TPSHGM images of an aspergillus fumigatus-infected cornea in the first experiment. RCM, TPSHGM AF, and TPSHGM SHG images are shown in different rows from top to bottom, and three x-y plane images at different depths of 60 µm, 120 µm, and 250 µm from the surface are shown in each row. RCM, TPSHGM AF, and TPSHGM SHG images are shown in Fig. 2(a)-2(c), 2(d)-2(f), and 2(g)-2(i), respectively. RCM and TPSHGM AF images visualized almost the same cellular structures in the cornea, as marked by dashed circles and arrowheads. RCM and TPSHGM AF images at 60 µm from the surface in Fig. 2(a) and 2(d) show filamentous structures and cell clusters across the imaging field of view (FOV). Corresponding TPSHGM SHG image in Fig. 2(g) shows collagen fiber bundles in the stroma. The filamentous structures in RCM and TPSHGM AF images are approximately 5 µm in width, and they are similar to those identified as aspergillus fumigatus cells in Fig. 1(a) and literature [6, 7]. Cell clusters in the images are probably inflammatory cells. TPSHGM SHG image shows the collagen fiber bundles clearly including their orientations, which might be due to structural disruption of the stroma. RCM, TPSHGM AF and TPSHGM SHG images at different depths show similar structures as the ones on the surface. RCM and TPSHGM AF images at 120 µm deep from the surface in Fig. 2(b) and 2(e) show several single filamentous structures marked by yellow arrow heads. Corresponding TPSHGM SHG image in Fig. 2(h) shows that these filamentous structures are aligned with collagen fiber bundles in the stroma. RCM images show some additional background compared to corresponding TPSHGM AF images, and this background is due to increased reflection from the infected turbid cornea. RCM images show additional thin fibrous structures besides the relatively thick filamentous structures. These fibrous structures appear to be either the nerves in the cornea or reflection from collagen fiber bundles. RCM image at 250 µm deep from the surface in Fig. 2(c) shows not much structures due to decreased contrast. On the other hand, corresponding TPSHGM AF image in Fig. 2(f) shows filamentous structures due to much less background.
Fig. 2.
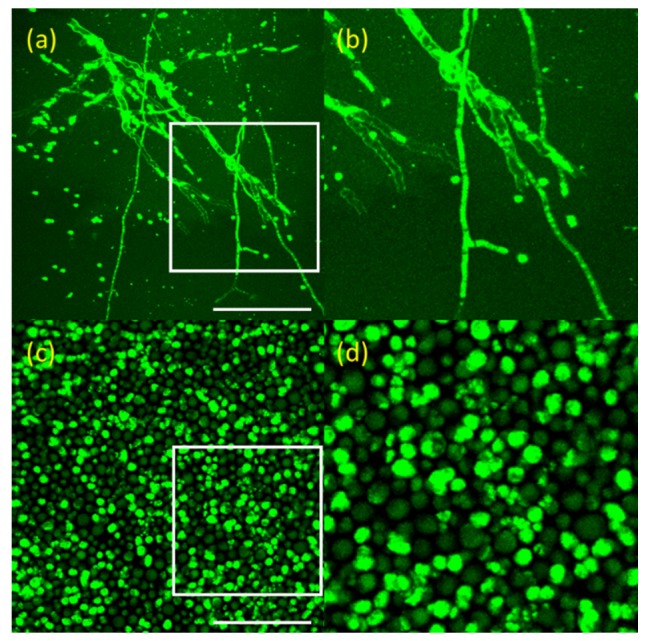
TPM images of fungal cells in aqueous media in the x-y plane. (a): aspergillus fumigatus (Visualization 1 (552.2KB, MOV) ) and (b): zoomed image of white box of (a). (c): candida ablicans (Visualization 2 (498.7KB, MOV) ) and (d): zoomed image of white box of (c). These images are maximum projection images (MPI) from 3D TPM data. Scale bar: 50 µm
Fig. 3.
RCM and TPSHGM images of the aspergillus fumigatus-infected rabbit cornea #1 at several depths. (a-c): RCM images at 60, 120, and 250 µm deep from the surface, respectively (Visualization 3 (1.7MB, MOV) ), (d-f) and (g-i): TPSHGM AF and SHG images at the same depths as RCM images (Visualization 4 (1.9MB, MOV) , green: autofluorescence, blue: SHG). Yellow dashed circle: cluster of aspergillus fumigatus, yellow arrow head: single aspergillus fumigatus cells. Scale bar: 100 µm
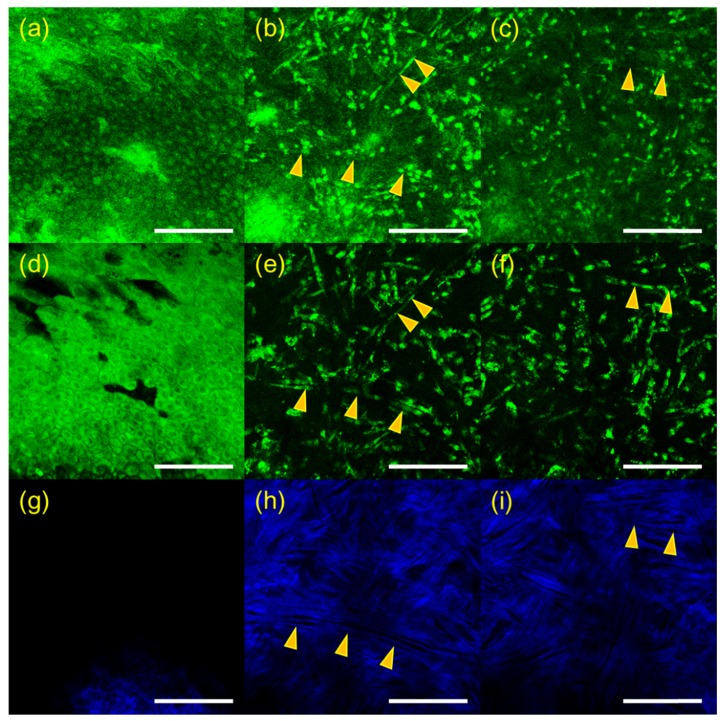
3D RCM and TPSHGM images of an aspergillus fumigatus-infected cornea in the second experiment are shown in Fig. 3, and these images are presented in a format similar to Fig. 2. RCM, TPSHGM AF, and TPSHGM SHG images in the x-y plane at three different depths of 16 µm, 56 µm, and 80 µm deep from the surface are shown in Fig. 2(a)-2(c), 2(d)-2(f), and 2(g)-2(i), respectively. RCM and TPSHGM AF images 16 µm deep from the surface show the epithelial cells. RCM and TPSHGM AF images at deeper layers show filamentous structures and cells, and the corresponding TPSHGM SHG images show collagen fiber bundles clearly indicating structural disruption due to infection. Some filamentous structures, marked with two arrow heads in the images, are aligned with collagen fiber bundles. Some of filamentous structures do not appear clearly in RCM images, while they do in TPSHGM AF images. This may be due to differences in contrast mechanism: RCM is based on light reflection and there may be variation of reflection depending on cell morphology and surrounding structures. Since TPSHGM is based on AF and SHG, TPSHGM is less dependent on morphology and structure compared to RCM.
3.3 Candida albicans infected corneas ex vivo
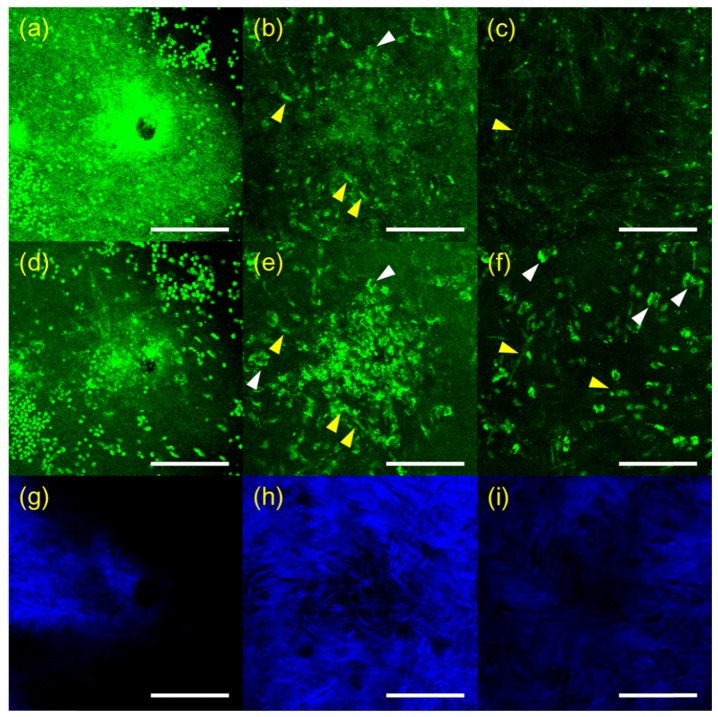
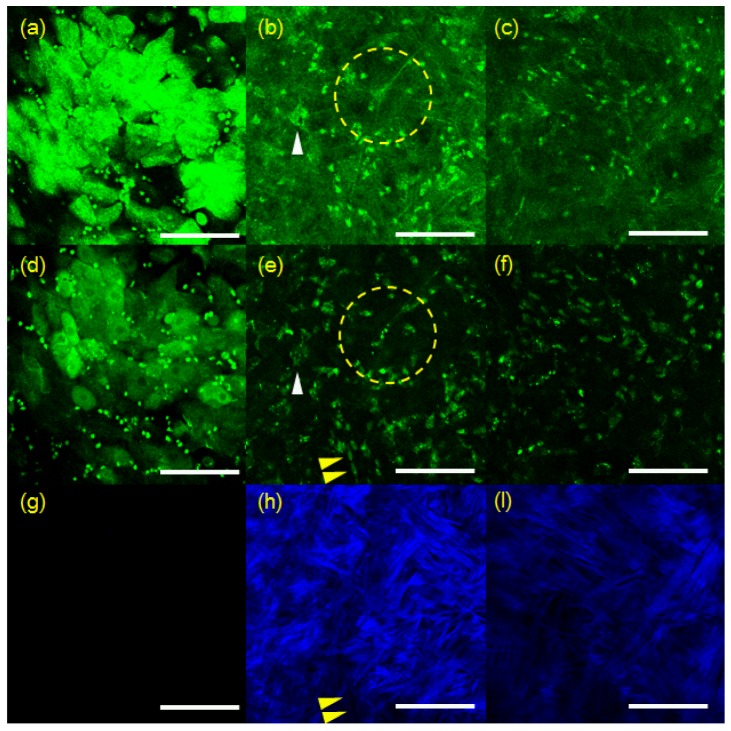
RCM and TPSHGM imaging of candida albicans-infected rabbit corneas was conducted twice, and representative results of the two experiments are shown in Figs. 4 and 5, respectively. In Fig. 4, RCM and TPSHGM images of a candida-infected rabbit cornea ex vivo in the first experiment are presented in a format similar to the ones in Figs. 2 and 3. Images at three different depths of the surface, 25 µm, and 60 µm deep are shown in each row from left to right. RCM and TPSHGM AF images on the surface show many round structures and a hole in the middle. The round structures on the surface are similar to the candida albicans cells in the aqueous medium shown in Fig. 1(b). Therefore, these round structures could be candida albicans. The hole might have been generated during the infection process. TPSHGM SHG image on the surface shows collagen fiber bundles clearly indicating loss of the epithelium and disruption of the stroma. RCM and TPSHGM AF images at 25 µm deep from the surface show aggregated cells around the hole. These cells may be a mixture of fungal and inflammatory cells due to inflammation response to the fungal infection. In the hole periphery, RCM and TPSHGM AF images show some elongated cell structures and irregular cell structures, as marked by yellow and white arrow heads, respectively. These elongated cells could be candida albicans cells in hyphae form, based on morphology described by previous studies [6, 7, 22]. The irregular shaped cells appear to have nuclei in both RCM and TPSHGM AF images. Corresponding TPSHGM SHG image shows less collagen fiber bundles in the cell cluster. RCM and TPSHGM AF images at 60 um deep from the surface show relatively sparse cell distribution. RCM images resolved morphologies of individual cells less clearly than TPSHGM AF images, due to partly increased background and variation of reflection.
Fig. 4.
3D RCM and TPSHGM images of the aspergillus fumigatus-infected rabbit cornea # 2 in the x-y plane at several depths. (a-c): RCM images (Visualization 5 (1.1MB, MOV) ) at 16, 56, and 80 µm deep from the surface, (d-f) and (g-i): corresponding TPSHGM AF and SHG images (Visualization 6 (1.3MB, MOV) , green: autofluorescence, blue: SHG). Yellow arrow head: aspergiilus fumigatus cells. Scale bar: 100 µm
Fig. 5.
3D RCM and TPSHGM images of candida albicans-infected rabbit cornea # 1 in the x-y plane at three depths. (a-c): RCM images at surface, 25, and 60 µm deep from the surface (Visualization 7 (1.3MB, MOV) ), (d-f) and (g-i): corresponding TPSHGM AF and SHG images to the RCM images (Visualization 8 (1.4MB, MOV) , green: autofluorescence, blue: SHG). Scale bar: 100 µm
3D RCM and TPSHGM images of a candida-infected rabbit cornea in the second experiment are shown in Fig. 5. RCM, TPSHGM AF and SHG images at three different depths of surface, 60 µm, and 100 µm from the surface are shown in (a-c), (d-f), and (g-i), respectively. RCM and TPSHGM AF image of the surface shows the epithelial cells at the base of the epithelium. Round shaped structures distributed evenly in the FOV. RCM and TPSHGM AF images at 60 µm from the surface show several cellular structures: ones marked with a dashed circle and a white arrow head appear to be neuron and inflammatory cells, respectively, based on morphology. Other cells are relatively densely distributed probably due to immune response. There are some elongated cells, arranged in order as marked by yellow arrow heads. Cellular structures in RCM and TPSHGM AF images do not exactly match each other due to difference in contrast mechanism. Corresponding TPSHGM SHG images show collagen fiber bundles which are aligned with elongated structures in the other images. RCM and TPSHGM images at 100 µm from the surface show similar cells distribution. Individual cells are less clearly resolvable at this depth.
3.4 Histology of aspergillus and candida infected rabbit cornea
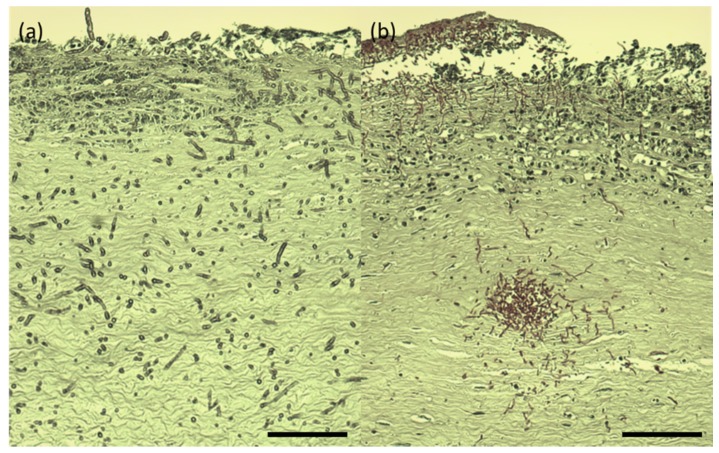
The infected rabbit corneas, which were imaged by both RCM and TPSHGM, were prepared for histology. Histological images of the aspergillus fumigatus and candida albicans-infected corneas, whose RCM and TPSHGM images were shown in Fig. 2 and 3, are shown in Fig. 6(a) and 6(b), respectively. Both histological images show severe infection throughout the corneas. Histological image of the aspergillus-infected cornea shows filamentous structures distributed in the cornea, indentified as aspergillus cells. They are distributed densely in the superficial region and relatively sparsely in the deep region of stroma. Both RCM and TPSHGM showed similar filamentous structures in the infected corneas in Figs. 1 and 2. Therefore, RCM and TPSHGM of aspergillus aspergillus-infected corneas show good correlation with histology. Histological image of the candida albicans-infected cornea shows densely distributed round and filamentous structures in the superficial region and around a hole located in the middle of the stroma. The hole might be generated by the infection process. The density of these fungal cells in this histological image are much higher than that of the aspergillus infection, in agreement with the imaging results using RCM and TPSHGM (Fig. 7).
Fig. 6.
3D RCM and TPSHGM images of candida albicans-infected rabbit cornea # 2 in the x-y plane at three different depths. (a-c): RCM images at surface, 60, and 100 µm deep from the surface (Visualization 9 (731.2KB, MOV) ), (d-f) and (g-i): corresponding TPSHGM AF and SHG images as the RCM images (Visualization 10 (1.3MB, MOV) , green: AF, blue: SHG). Yellow arrow head: candida albicans cells, white arrow head: inflammatory cells, yellow dashed circle: neuron. Scale bar: 100 µm
Fig. 7.
Histology images of aspergillus fumigatus and candida albicans-infected rabbit corneas. (a) and (b): aspergillus and candida-infected corneas. Scale bar: 100 µm
4. Discussion and conclusion
RCM and TPSHGM, which are 3D microscopic imaging techniques that provide cellular information of tissue, were applied to visualization and characterization of fungal pathogens in the rabbit cornea infection model. Two fungal strains, aspergillus fumigatus and candida albicans, were used as representative fungal pathogens. Infected rabbit corneas were sequentially imaged ex vivo in fresh condition by both modalities, and their images were compared side-by-side. Both RCM and TPSHGM visualized and detected fungal cells within the cornea based on their morphology: aspergillus fumigatus had filamentous structures and candida albicans had round and elongated sturctures. Since RCM and TPSHGM are based on different contrasts of reflection and fluorescence along with SHG, they provide different information in principle. Fungal cells and other cells appeared in both modalities because they both reflect light and express autofluorescence. However, their images had different characteristics as well. RCM visualized cellular structures including fungal cells in the infected corneas based on reflection. RCM was susceptible to variations in reflection so that cell morphology in RCM images was different from the one in TPSHGM images. RCM of infected turbid cornea had decreased contrast due to increase of background signal and had shallow imaging depth compared to TPSHGM. TPSHGM visualized cellular structures including fungal cells based on AF and collagen fiber bundles in the stroma based on SHG. However, TPSHGM suffered from weak AF signal and required more excitation laser power for compensation. RCM usually has higher imaging speed due to usage of light reflection. Therefore, RCM and TPSHGM have their own advantages which may compensate for the limitations of other. For example, RCM could be used for high speed screening of the cornea noninvasively, but it cannot resolve enough to visualize structure and cells in detail under turbid condition due to corneal infection. When the suspected part are discovered during RCM screening, TPSHGM system is used for visualizing cells and any pathogens in detail in minimal required area of cornea. However, photodamage problem of TPSHGM imaging laser power should be considered in the use of clinical translation and in vivo animal study. The problem risen due to the use of high laser power could be overcome by using high-sensitivity detector or fluorescent labeling agent.
In conclusion, both RCM and TPSHGM were applied to rabbit fungal keratitis models ex vivo for performance characterization and comparison in detection of fungal pathogens. Both RCM and TPSHGM could detect both aspergillus fumigatus and candida albicans based on their characteristic morphologies. Comparison between RCM and TPSHGM showed differences in their images and limitations. Combination of RCM and TPSHGM will be useful for screening of fungal keratitis by providing complementary.
Acknowledgments
This research was supported by the Engineering Research Center (No. 2011-0030075) and the Korea-Sweden Research Cooperation Program (No. NRF-2014R1A2A1A12067510) of the National Research Foundation (NRF) funded by the Koera Government (MEST) and the Industrial Technology Innovation Program (No. 10048358) funded by the Ministry Of Trade, Industry and Energy (MI, Korea), and a grant (2014-7202) from the Asan Institute for Life Sciences, Asan Medical Center, Korea.
References and links
- 1.Whitcher J. P., Srinivasan M., Upadhyay M. P., “Corneal blindness: a global perspective,” Bull. World Health Organ. 79(3), 214–221 (2001). [PMC free article] [PubMed] [Google Scholar]
- 2.Mantopoulos D., Cruzat A., Hamrah P., “In vivo imaging of corneal inflammation: new tools for clinical practice and research,” Semin. Ophthalmol. 25(5-6), 178–185 (2010). 10.3109/08820538.2010.518542 [DOI] [PMC free article] [PubMed] [Google Scholar]
- 3.Thomas P. A., Geraldine P., “Infectious keratitis,” Curr. Opin. Infect. Dis. 20(2), 129–141 (2007). 10.1097/QCO.0b013e328017f878 [DOI] [PubMed] [Google Scholar]
- 4.Jurkunas U., Behlau I., Colby K., “Fungal keratitis: changing pathogens and risk factors,” Cornea 28(6), 638–643 (2009). 10.1097/ICO.0b013e318191695b [DOI] [PubMed] [Google Scholar]
- 5.Niederer R. L., McGhee C. N., “Clinical in vivo confocal microscopy of the human cornea in health and disease,” Prog. Retin. Eye Res. 29(1), 30–58 (2010). 10.1016/j.preteyeres.2009.11.001 [DOI] [PubMed] [Google Scholar]
- 6.Brasnu E., Bourcier T., Dupas B., Degorge S., Rodallec T., Laroche L., Borderie V., Baudouin C., “In vivo confocal microscopy in fungal keratitis,” Br. J. Ophthalmol. 91(5), 588–591 (2007). 10.1136/bjo.2006.107243 [DOI] [PMC free article] [PubMed] [Google Scholar]
- 7.Ledbetter E. C., Irby N. L., Kim S. G., “In vivo confocal microscopy of equine fungal keratitis,” Vet. Ophthalmol. 14(1), 1–9 (2011). 10.1111/j.1463-5224.2010.00822.x [DOI] [PubMed] [Google Scholar]
- 8.Steven P., Müller M., Koop N., Rose C., Hüttmann G., “Comparison of Cornea Module and DermaInspect for noninvasive imaging of ocular surface pathologies,” J. Biomed. Opt. 14(6), 064040 (2009). 10.1117/1.3275475 [DOI] [PubMed] [Google Scholar]
- 9.Morishige N., Wahlert A. J., Kenney M. C., Brown D. J., Kawamoto K., Chikama T., Nishida T., Jester J. V., “Second-harmonic imaging microscopy of normal human and keratoconus cornea,” Invest. Ophthalmol. Vis. Sci. 48(3), 1087–1094 (2007). 10.1167/iovs.06-1177 [DOI] [PMC free article] [PubMed] [Google Scholar]
- 10.Morishige N., Shin-Gyou-Uchi R., Azumi H., Ohta H., Morita Y., Yamada N., Kimura K., Takahara A., Sonoda K. H., “Quantitative analysis of collagen lamellae in the normal and keratoconic human cornea by second harmonic generation imaging microscopy,” Invest. Ophthalmol. Vis. Sci. 55(12), 8377–8385 (2014). 10.1167/iovs.14-15348 [DOI] [PubMed] [Google Scholar]
- 11.Denk W., Strickler J. H., Webb W. W., “Two-photon laser scanning fluorescence microscopy,” Science 248(4951), 73–76 (1990). 10.1126/science.2321027 [DOI] [PubMed] [Google Scholar]
- 12.Zipfel W. R., Williams R. M., Webb W. W., “Nonlinear magic: multiphoton microscopy in the biosciences,” Nat. Biotechnol. 21(11), 1369–1377 (2003). 10.1038/nbt899 [DOI] [PubMed] [Google Scholar]
- 13.Gibson E. A., Masihzadeh O., Lei T. C., Ammar D. A., Kahook M. Y., “Multiphoton microscopy for ophthalmic imaging,” J. Ophthalmol. 2011, 870879 (2011). 10.1155/2011/870879 [DOI] [PMC free article] [PubMed] [Google Scholar]
- 14.König K., “Multiphoton microscopy in life sciences,” J. Microsc. 200(2), 83–104 (2000). 10.1046/j.1365-2818.2000.00738.x [DOI] [PubMed] [Google Scholar]
- 15.Teng S. W., Tan H. Y., Peng J. L., Lin H. H., Kim K. H., Lo W., Sun Y., Lin W. C., Lin S. J., Jee S. H., So P. T., Dong C. Y., “Multiphoton autofluorescence and second-harmonic generation imaging of the ex vivo porcine eye,” Invest. Ophthalmol. Vis. Sci. 47(3), 1216–1224 (2006). 10.1167/iovs.04-1520 [DOI] [PubMed] [Google Scholar]
- 16.Tan H. Y., Sun Y., Lo W., Teng S. W., Wu R. J., Jee S. H., Lin W. C., Hsiao C. H., Lin H. C., Chen Y. F., Ma D. H., Huang S. C., Lin S. J., Dong C. Y., “Multiphoton fluorescence and second harmonic generation microscopy for imaging infectious keratitis,” J. Biomed. Opt. 12(2), 024013 (2007). 10.1117/1.2717133 [DOI] [PubMed] [Google Scholar]
- 17.Sharma R., Yin L., Geng Y., Merigan W. H., Palczewska G., Palczewski K., Williams D. R., Hunter J. J., “In vivo two-photon imaging of the mouse retina,” Biomed. Opt. Express 4(8), 1285–1293 (2013). 10.1364/BOE.4.001285 [DOI] [PMC free article] [PubMed] [Google Scholar]
- 18.Steven P., Bock F., Hüttmann G., Cursiefen C., “Intravital two-photon microscopy of immune cell dynamics in corneal lymphatic vessels,” PLoS One 6(10), e26253 (2011). 10.1371/journal.pone.0026253 [DOI] [PMC free article] [PubMed] [Google Scholar]
- 19.Chen W. L., Sun Y., Lo W., Tan H. Y., Dong C. Y., “Combination of multiphoton and reflective confocal imaging of cornea,” Microsc. Res. Tech. 71(2), 83–85 (2008). 10.1002/jemt.20528 [DOI] [PubMed] [Google Scholar]
- 20.Lee J. H., Lee S., Gho Y. S., Song I. S., Tchah H., Kim M. J., Kim K. H., “Comparison of confocal microscopy and two-photon microscopy in mouse cornea in vivo,” Exp. Eye Res. 132, 101–108 (2015). 10.1016/j.exer.2015.01.013 [DOI] [PubMed] [Google Scholar]
- 21.Avunduk A. M., Beuerman R. W., Varnell E. D., Kaufman H. E., “Confocal microscopy of Aspergillus fumigatus keratitis,” Br. J. Ophthalmol. 87(4), 409–410 (2003). 10.1136/bjo.87.4.409 [DOI] [PMC free article] [PubMed] [Google Scholar]
- 22.Villani E., Baudouin C., Efron N., Hamrah P., Kojima T., Patel S. V., Pflugfelder S. C., Zhivov A., Dogru M., “In vivo confocal microscopy of the ocular surface: from bench to bedside,” Curr. Eye Res. 39(3), 213–231 (2014). 10.3109/02713683.2013.842592 [DOI] [PMC free article] [PubMed] [Google Scholar]


