

Abstract
Key points
Hypoxia is a major cause of fetal growth restriction, particularly at high altitude, although little is known about its effects on placental phenotype and resource allocation to fetal growth.
In the present study, maternal hypoxia induced morphological and functional changes in the mouse placenta, which depended on the timing and severity of hypoxia, as well as the degree of maternal hypophagia.
Hypoxia at 13% inspired oxygen induced beneficial changes in placental morphology, nutrient transport and metabolic signalling pathways associated with little or no change in fetal growth, irrespective of gestational age.
Hypoxia at 10% inspired oxygen adversely affected placental phenotype and resulted in severe fetal growth restriction, which was due partly to maternal hypophagia.
There is a threshold between 13% and 10% inspired oxygen, corresponding to altitudes of ∼3700 m and 5800 m, respectively, at which the mouse placenta no longer adapts to support fetal resource allocation. This has implications for high altitude human pregnancies.
Abstract
The placenta adapts its transport capacity to nutritional cues developmentally, although relatively little is known about placental transport phenotype in response to hypoxia, a major cause of fetal growth restriction. The present study determined the effects of both moderate hypoxia (13% inspired O2) between days (D)11 and D16 or D14 and D19 of pregnancy and severe hypoxia (10% inspired O2) from D14 to D19 on placental morphology, transport capacity and fetal growth on D16 and D19 (term∼D20.5), relative to normoxic mice in 21% O2. Placental morphology adapted beneficially to 13% O2; fetal capillary volume increased at both ages, exchange area increased at D16 and exchange barrier thickness reduced at D19. Exposure to 13% O2 had no effect on placental nutrient transport on D16 but increased placental uptake and clearance of 3H‐methyl‐d‐glucose at D19. By contrast, 10% O2 impaired fetal vascularity, increased barrier thickness and reduced placental 14C‐methylaminoisobutyric acid clearance at D19. Consequently, fetal growth was only marginally affected in 13% O2 (unchanged at D16 and −5% at D19) but was severely restricted in 10% O2 (−21% at D19). The hypoxia‐induced changes in placental phenotype were accompanied by altered placental insulin‐like growth factor (IGF)‐2 expression and insulin/IGF signalling, as well as by maternal hypophagia depending on the timing and severity of the hypoxia. Overall, the present study shows that the mouse placenta can integrate signals of oxygen and nutrient availability, possibly through the insulin‐IGF pathway, to adapt its phenotype and optimize maternal resource allocation to fetal growth during late pregnancy. It also suggests that there is a threshold between 13% and 10% inspired O2 at which these adaptations no longer occur.
Key points
Hypoxia is a major cause of fetal growth restriction, particularly at high altitude, although little is known about its effects on placental phenotype and resource allocation to fetal growth.
In the present study, maternal hypoxia induced morphological and functional changes in the mouse placenta, which depended on the timing and severity of hypoxia, as well as the degree of maternal hypophagia.
Hypoxia at 13% inspired oxygen induced beneficial changes in placental morphology, nutrient transport and metabolic signalling pathways associated with little or no change in fetal growth, irrespective of gestational age.
Hypoxia at 10% inspired oxygen adversely affected placental phenotype and resulted in severe fetal growth restriction, which was due partly to maternal hypophagia.
There is a threshold between 13% and 10% inspired oxygen, corresponding to altitudes of ∼3700 m and 5800 m, respectively, at which the mouse placenta no longer adapts to support fetal resource allocation. This has implications for high altitude human pregnancies.
Abbreviations
- Akt
protein kinase B
- AMPK
adenosine monophosphate‐activated protein kinase
- D
day of pregnancy
- Db
decidua basalis
- FC
fetal capillaries
- H
hypoxia
- IGF
insulin‐like growth factor
- IGF1R
IGF receptor‐β
- IR
insulin receptor
- Jz
junctional zone
- Lz
labyrinthine zone
- MBS
maternal blood space
- MeAIB
14C‐methyl‐aminoisobutyric acid
- MeGlu
3H‐methyl‐d‐glucose
- N
normoxic
- PF
pair‐fed
- PI3K
phosphatidylinositol3‐kinase
Introduction
Hypoxia is a common complication of pregnancy, occurring in 9–10% of pregnancies at sea level as a result of smoking, anaemia, cord occlusion or poor placental vascularity (Hutter et al., 2010), as well as in all pregnancies at high altitude (Zamudio, 2003; Tissot van Patot et al., 2010). It is often associated with intrauterine growth restriction, which has immediate adverse consequences for the neonate and also increases adult rates of morbidity and mortality (McMillen & Robinson, 2005; Myatt, 2006; Giussani & Davidge, 2013; Zhang et al. 2015). In human populations, birth weight decreases on average by ∼100 g for every 1000 m above sea level, suggesting that fetal growth is highly sensitive to alterations in atmospheric oxygen content (Moore et al. 2011). However, the decrement is birth weight is less in multigenerational inhabitants of the elevated climes, such as the Tibetans and Andeans, than in more recent settlers, such as the Han Chinese and Europeans (Giussani et al. 2001; Postigo et al. 2009; Moore et al. 2011; Soria et al. 2013). Decrements in fetal growth have also been observed in mice and rats exposed to hypoxic conditions during late pregnancy (Zhou et al. 2013; Cuffe et al. 2014). By contrast, hypoxia in sheep and guinea pig pregnancies does not necessarily reduce birth weight, even during chronic maternal exposure, although the severity of the hypoxia and the gestational age at onset are both critical (Bacon et al. 1984; Jacobs et al. 1988; Krebs et al. 1996; Penninga & Longo, 1998; Parraguez et al. 2005). Taken together, these observations suggest that there are adaptations in materno‐fetal resource allocation during chronic hypoxia that help to maintain fetal growth, although the mechanisms operating in vivo remain unknown.
The main determinant of fetal growth is the placental supply of oxygen and nutrients (Burton & Fowden, 2015). Previous studies in rodents and other experimental animals have shown that the placenta responds to environmental cues such as maternal stress, energy intake and dietary composition by adapting its morphological and functional phenotype to optimize fetal growth with respect to the available resource (Fowden et al. 2009; Vaughan et al. 2012 a; Sferruzzi‐Perri et al. 2013 a). In rodents, there are changes in placental vascularity, barrier thickness, passive diffusion, nutrient transport and nutrient transporter expression in response to maternal dietary perturbations during pregnancy, particularly when placental growth is compromised (Jansson et al. 2006; Jones et al. 2008; Coan et al. 2010, 2011; Rosario et al. 2011; Sferruzzi‐Perri et al. 2011, 2013 b). At high altitude, the human and ovine placenta can adapt morphologically to improve the oxygen diffusion capacity by increasing fetal vascularity and thinning the diffusion barrier between the maternal and fetal circulations (Ali et al. 1996; Krebs et al. 1996; Mayhew, 1998; Tissot van Patot et al. 2003; Parraguez et al. 2006). Similar increases in placental vascularity and diffusion capacity have been observed in guinea pigs exposed to hypoxia for most of pregnancy (Bacon et al. 1984). In rodents, maternal hypoxia in late pregnancy can either decrease or increase placental vascularity, particularly in the labyrinthine zone (Lz) responsible for nutrient transfer, depending on the severity of the hypoxic insult (Gheorghe et al. 2007; Hvizdosova‐Klescova et al. 2013; Zhou et al. 2013; Cuffe et al. 2014). Compared to these morphological changes, however, little is known about any functional adaptations in placental phenotype in vivo, notably its nutrient transport capacity, during hypoxic conditions in any species.
One mechanism by which maternal hypoxia may modify placental transport phenotype is by modulating the growth regulatory gene, insulin‐like growth factor (IGF)(i.e. Igf2) and the insulin/IGF signalling pathway. In mice, deletion of the placental specific P0 transcript of the Igf2 gene prevents the beneficial adaptations in placental morphology and nutrient transport in response to maternal undernutrition (Sferruzzi‐Perri et al. 2011; Diaz et al. 2014) and deletion of all Igf2 transcripts impairs passive diffusion of solutes and active amino acid transport across the mouse placenta (Coan et al. 2008, 2010, 2011; King et al. 2013). In addition, there are placental changes in the insulin/IGF signalling pathway downstream of the receptors that involve phosphatidylinositol 3‐kinase (PI3K) in response to maternal undernutrition or feeding obesogenic diets during pregnancy in mice, sheep and non‐human primates (Zhu et al. 2007, 2009; Ma et al. 2011; Sferruzzi‐Perri et al. 2011, 2013 b; Kavitha et al. 2014; Lager et al. 2014). Hypoxia also regulates the expression of Igf2 in tissues, including those of the fetus (Feldser et al. 1999); however, nothing is known about placental Igf2 expression or insulin/IGF signalling during hypoxic conditions. Alternatively, hypoxia‐induced adaptation of placental transport phenotype may involve changes in maternal circulating leptin because leptin production is modified by hypoxia, affects the tissue expression of IGF system components and modulates nutrient transport activity in the placenta (Jansson et al. 2003; Sferruzzi‐Perri et al. 2011; Sferruzzi‐Perri et al. 2013 a, b ). Accordingly, in the present study, we tested the hypothesis that maternal hypoxia alters placental transport phenotype in association with changes in maternal leptin and placental insulin/IGF signalling with consequences for fetal growth during late mouse pregnancy. In particular, we investigated the morphological and transport adaptations of the placenta in response to 13% and 10% oxygen in the inspired air for 5 days during the second half of pregnancy relative to normoxic controls in 21% oxygen. This degree of hypoxia is equivalent to altitudes between ∼3700 m and 5800 m at which rodent and human populations live but where habitation becomes progressively sparse (West, 2002; Storz et al. 2007).
Methods
Animals
All procedures were carried out under the UK Animal (Scientific Procedures) Act 1986. Eighty‐eight virgin C57BL/6 J female mice, aged 6–8 weeks, were housed in groups of two to five per cage under a 12:12 h light:dark cycle at 22°C and were mated overnight with C57BL/6 J males. The presence of a copulatory plug was designated as day (D)1 of pregnancy (term ∼D20.5). All animals had ad libitum access to water and food [RM3, energy from fat 11%, protein 26%, carbohydrate 62% (simple sugar 7%), 15.3 MJ kg−1, diet code 801066; Special Diet Services, Witham, Essex, UK]. Mated females were weighed daily and the daily consumption of food and water was measured per cage to calculate intake per mouse per day. Pregnant mice were exposed to chronic, normobaric hypoxia for 5 day periods by placing their cages into an isolated PVC chamber (PFI Plastics Ltd, Milton Keynes, UK) in which the oxygen content was reduced to either 13% or 10% by displaced oxygen with nitrogen using a nitrogen generator (N2MID60; Domnick Hunter Ltd, Warwick, UK). The experimental protocol is shown in Fig. 1. Specifically, dams were either exposed to moderate hypoxia (13% O2) from D11 to D16 or from D14 to D19 or they were exposed to more severe hypoxia (10% O2) from D14 to D19 only (Fig. 1). Exposure to 10% O2 from D11 to D16 was not compatible with a viable pregnancy. Control mice remained normoxic at an atmospheric oxygen content of 21% throughout their pregnancies but were housed in the same room as the hypoxic chambers for the corresponding D11 to D16 or D14 to D19 periods of pregnancy (Fig. 1). Relative to the normoxic (N) controls (D16N and D19N), food intake was voluntarily reduced during the 5 day period of hypoxia (H) in dams exposed to 10% O2 from D14 to D19 (10% H, 2.2 ± 0.5 g mouse day−1, n = 8 cages; N, 4.0 ± 0.1 g mouse day−1, n = 9 cages, P < 0.05) and to 13% O2 from D11 to D16 (13% H, 3.0 ± 0.3 g mouse day−1, n = 5 cages; N, 3.9 ± 0.2 g mouse day−1, n = 5 cages, P < 0.05) but not from D14 to D19 (P > 0.05). Consequently, pregnant mice were kept in normoxic conditions and pair‐fed (PF) to the intakes of the 13% H and 10% H mice over the corresponding periods of pregnancy as additional normoxic pair‐fed controls (Fig. 1). Pair‐fed mice were housed in the room containing the hypoxia chambers from D11 to D16 or D14 to D19.
Figure 1. Schematic diagram of the experimental protocol .

Schematic diagram of the experimental protocol and the allocation of pregnant mice between the different treatments, together with the group abbreviations for the treatments used.
Experimental procedures
Between 08.00 h and 10.00 h on either D16 or D19, dams were anaesthetized with an i.p. injection of fentanyl‐fluanisone and midazolan in sterile water (1:1:2; 10 μg ml−1; Janssen Animal Health, High Wycombe, UK). A blood sample was taken from the tail vein to measure haematocrit. As described previously (Sibley et al. 2004), unidirectional materno‐fetal clearance of the non‐metabolizable radiolabelled analogues of glucose and an amino acid, 3H‐methyl‐d‐glucose (MeGlu, NEN NEC‐377, 2.1 GBq mmol−1; Perkin Elmer, Waltham, MA, USA) and 14C‐methylaminoisobutyric acid (MeAIB, NEN NEC‐671, 1.86 GBq mmol−1; Perkin Elmer), respectively was then measured in vivo (D16N, n = 7; D16 13% PF, n = 7; D16 13% H, n = 10; D19N, n = 13; D19 13% H, n = 14; D19 10% PF, n = 12; D19 10% H, n = 14). One to four minutes after tracer injection, a cardiac blood sample was collected immediately before killing the anaesthetized dam by cervical dislocation. The average time from tracer administration to cardiac sampling was ∼2 min and did not differ between groups. The blood sample was placed into an EDTA‐coated tube kept at 4°C after measurement of the blood glucose concentration using a hand‐held glucometer (One Touch Ultra; Lifescan, Tunbridge Wells, UK). The uterus was removed from each dam and the numbers of viable and resorbing conceptuses were counted before the fetuses were decapitated. The maternal carcass and individual organs plus each fetus and corresponding placenta were weighed. The placenta with the weight closest to the litter mean was bisected mid‐sagitally and each half was weighed. One half was placed in 4% paraformaldehyde and the other in 4% gluteraldehyde for histological analyses. The second lightest placenta was snap frozen whole and stored at −80°C for subsequent analysis of tracer uptake. The Lz of the second and third heaviest placentae were separated from the endocrine junctional zone (Jz) and snap frozen in liquid nitrogen and stored at −80°C for subsequent analysis of protein and gene expression, respectively. The maternal blood was centrifuged and the plasma stored at −20°C for subsequent biochemical analyses.
Placental morphometry
Paraformaldehyde‐fixed placental halves were embedded in paraffin wax, exhaustively sectioned at 7 μm and stained with hematoxylin and eosin (D16N, n = 7; D16 13% PF, n = 5; D16 13% H, n = 8; D19N, n = 7; D19 13% H, n = 7; D19 10% PF, n = 7; D19 10% H, n = 9). The absolute and percentage volumes of the placental Jz, Lz and the maternal portion of the placenta, the decidua basalis (Db), were determined by point counting with a 10× objective lens using the Computer Assisted Stereological Toolbox (CAST, version 2.0; Olympus, Ballerup, Denmark), as described previously (Coan et al. 2004). Gluteraldehyde‐fixed placental halves were embedded in Spurr's epoxy resin and a single, 1 μm mid‐line section was cut and then stained with toluidine blue (D16 all groups n = 5, D19N, n = 6; D19 13% H, n = 4; D19 10% PF, n = 6; D19 10% H, n = 6). The absolute and percentage volumes of maternal blood spaces (MBS), fetal capillaries (FC) and trophoblast in the Lz, the absolute surface areas of MBS and FC, the total surface area for exchange (averaged surface area of MBS and FC) and the thickness of the interhemal membrane were determined with a 10× objective lens using CAST, as described previously (Coan et al. 2004).
Biochemical analysis
Maternal hormone concentration
The concentrations of circulating insulin, IGF‐1 and leptin in maternal plasma were measured in duplicate by an enzyme‐linked immunoabsorbant assay in accordance with the manufacturers’ instructions (Crystal Chem Inc., Downers Grove, IL, USA; R&D Systems, Minneapolis, MN, USA, respectively) from all the groups (D16 all groups, n = 5; D19N, n = 7; D19 13% H, n = 6; D19 10% PF, n = 5; D19 10% H, n = 7). The intra‐assay coefficients of variation were 11.6%, 3.9% and 4.3% for the insulin, IGF‐1 and leptin assays, respectively.
Placental content and transport of MeGlu and MeAIB
Whole placentas and minced fetuses were digested in Biosol (National Diagnostics, Hull, UK) for ≥ 1 week at 55°C. Beta emissions of maternal plasma and of fetal and placental digestates were measured using a 300 SL Liquid Scintillation Counter (LabLogic, Sheffield, UK). Radioactivity in the fetuses, placentas and maternal plasma was used to calculate either placental clearance of MeGlu and MeAIB (μl min–1 g–1 of placenta) or tracer accumulation expressed (g–1 of fetus or placenta), as described previously (Sibley et al. 2004).
Placental gene expression
Real‐time PCR was used to determine the Lz expression of glucose transporter isoforms (Slc2a1 and 3), System A amino acid transporters (Slc38a1, 2 and 4), all Igf2 transcripts and the Lz‐specific Igf2 transcript, Igf2P0. RNA was extracted from each placental Lz using the RNeasy Plus Mini Kit (Qiagen, Crawley, UK: D16N, n = 6; D16 13% PF, n = 5; D16 13% H, n = 7; D19N, n = 7; D19 13% H, n = 7; D19 10% PF, n = 7; D19 10% H, n = 6). Extracted RNA (2.5 μg) was reverse transcribed to cDNA on a DNA Engine Thermal Cycler (MyCycler; Bio‐Rad, Hercules, CA, USA) using Multiscribe Reverse Transcriptase (Applied Biosystems, Warrington, UK). Samples were analysed in duplicate on a 7500 Fast Real‐Time PCR instrument (Applied Biosystems) using TaqMan assays for Slc2a1 (Mm00441473_m1), Slc2a3 (Mm00441483_m1), Slc38a1 (Mm00506391_m1), Slc38a2 (Mm00628416_m1), Slc38a4 (Mm00459056_m1), Igf2 (Mm00439564_m1)and Igf2p0 (forward primer CCGAGGCCTGTACCACCTA, reverse primer CCTCGGCTCAGACCTCAGTA, FAM CCGAGGCCTCTGCCACC), as reported previously (Coan et al. 2010). Using the ΔΔCt method (Schmittgen & Livak, 2008), the expression of the genes of interest in each sample was normalized to the expression of Tbp (Mm01277045_m1), which did not vary between experimental groups, and then expressed relative to the normoxic, ad libitum fed, controls (N group) at each age. The Taqman primers/probes for all genes, including the housekeeper were of similar efficiency at ∼100%.
Placental protein expression
Proteins were extracted from the Lz (all groups, n = 5) in lysis buffer containing 20 mm Tris (pH 7.5), 150 mm NaCl, 1 mm Na2EDTA, 1 mm EGTA, 1% Triton X‐100, 2.5 mm sodium pyrophosphate, 1 mm β‐glycerolphosphate, 1 mm Na3VO4 and complete miniproteases inhibitor cocktail (Roche Diagnostics, Burgess Hill, UK). Lysate protein concentrations were determined using a Bicinchoninic acid assay (Sigma‐Aldrich, St Louis, MO, USA). Equivalent lysate protein concentrations (50 μg) were resolved by SDS‐PAGE and transferred onto nitrocellulose membranes. Ponceau‐S staining of membranes confirmed equal protein loading between samples. Membranes were probed with antibodies against insulin receptor‐β (IR; Santa Cruz Biotechnology, Dallas, TX, USA), type 1 IGF receptor‐β (IGF1R; Santa Cruz Biotechnology), p85α (Millipore, Billerica, MA, USA), p110α, p110β, Akt‐T308‐P, Akt‐S473‐P and total Akt (Cell Signaling Technology, Beverly, MA, USA) and bands depicting antibody‐bound proteins were visualized on photographic film. Band intensities were assessed by densitometry using ImageJ (NIH, Bethesda, MD, USA).
Statistical analysis
All data are presented as the mean ± SEM and were analysed using SPSS, version 21.0 (IBM Corp., Armonk, NY, USA). P < 0.05 was considered statistically significant. Separate statistical comparisons were made at the two stages of pregnancy and with the degree of hypoxia exposure. At D16 of pregnancy, the three experimental groups were compared by one‐way ANOVA with Bonferroni post hoc tests (D16N, D16 13% H and D16 13% PF). On D19, normoxic (N) and 13% H groups were compared using Student's unpaired t test, whereas normoxic (N), 10% PF and 10% H groups were compared by one‐way ANOVA with Bonferroni post hoc tests. For fetal and placental biometry, placental clearance and accumulation of MeGlu and MeAIB and fetal accumulation of these tracers, statistical tests were performed using litter means.
Results
Biometry
13% O2
Maternal exposure to 13% O2 for 5 days had little effect on total body weight, hysterectomized weight, non‐uterine weight gain or on the weight of the individual maternal organs compared to normoxic ad libitum fed controls at either stage of pregnancy (see Supporting information, Table S1). However, hysterectomized weight was greater in mice exposed to 13% O2 from D11 to D16 than in D16 normoxic dams pair‐fed to the intake of 13% H dams (see Supporting information, Table S1). Moreover, non‐uterine weight gain was reduced in 13% PF dams, relative to the D16N controls (see Supporting information, Table S1). Exposure to 13% O2 did not affect fetal or placental weights at D16, relative to both ab libitum and pair‐fed controls (Table 1). On D19, fetal weight was ∼5% less in 13% H than normoxic dams, with no significant difference in placental weight (Table 1).
Table 1.
Conceptus biometry and morphology of the placenta on D16 and D19 of pregnancy in normoxic dams (21% atmospheric O2 content); hypoxic dams exposed for 5 days either to 13% O2 from D11 to D16 or D14 to D19 or to 10% O2 from D14 to D19; and normoxic dams pair‐fed to the food intake of the 13% H dams from D11 to D16 or of the 10% H dams from D14 to D19
| D16 | D19 | ||||||
|---|---|---|---|---|---|---|---|
| Normoxia | 13% PF | 13% H | 13% H | Normoxia | 10% PF | 10% H | |
| Conceptus weight (mg) | |||||||
| Fetus | 402 ± 19 | 403 ± 9 | 409 ± 17 | 1111 ± 16* | 1173 ± 11a | 1068 ± 21b | 930 ± 23c |
| Placenta | 100.3 ± 3.3 | 100.3 ± 4.3 | 103.5 ± 2.1 | 90.0 ± 1.8 | 87.5 ± 2.6 | 84.5 ± 2.6 | 91.3 ± 1.8 |
| F:P | 4.0 ± 0.1 | 4.1 ± 0.2 | 3.9 ± 0.2 | 12.5 ± 0.3* | 13.6 ± 0.3a | 12.9 ± 0.5a | 10.3 ± 0.3b |
| Volume (mm3) | |||||||
| Lz | 39.9 ± 1.9a | 44.0 ± 2.0ab | 47.0 ± 1.8b | 43.7 ± 1.2 | 43.5 ± 1.7 | 46.4 ± 0.1 | 44.3 ± 0.7 |
| Jz | 47.0 ± 3.0 | 39.7 ± 4.4 | 44.9 ± 2.7 | 33.4 ± 1.7 | 31.5 ± 1.9ab | 25.9 ± 1.9a | 37.1 ± 1.8b |
| Db | 13.9 ± 0.7 | 17.3 ± 2.7 | 13.2 ± 2.2 | 9.7 ± 1.2 | 11.2 ± 1.7 | 10.5 ± 0.1 | 9.2 ± 0.7 |
| MBS | 8.1 ± 0.6a | 11.8 ± 0.7b | 10.5 ± 0.4b | 10.3 ± 1.1 | 10.5 ± 1.0ab | 12.5 ± 0.8a | 9.6 ± 0.6b |
| FC | 5.5 ± 1.0 | 5.1 ± 0.4 | 5.5 ± 0.3 | 14.2 ± 1.0* | 10.1 ± 0.7 | 10.4 ± 0.9 | 8.3 ± 1.1 |
| Trophoblast | 26.2 ± 1.5 | 28.5 ± 1.8 | 32.6 ± 1.7 | 21.7 ± 1.1 | 23.1 ± 0.7 | 24.6 ± 1.9 | 26.8 ± 2.4 |
| Volume (%) | |||||||
| Lz | 39.7 ± 1.6 | 44.0 ± 3.0 | 44.8 ± 1.7 | 50.3 ± 1.3 | 50.5 ± 1.8ab | 56.0 1.3a | 48.9 ± 0.8b |
| Jz | 46.5 ± 1.6 | 39.1 ± 2.3 | 42.7 ± 2.5 | 38.5 ± 1.4 | 36.5 ± 1.5ab | 31.3 ± 2.1a | 40.9 ± 1.6b |
| Db | 13.9 ± 0.9 | 16.9 ± 1.8 | 12.5 ± 2.0 | 11.2 ± 1.3 | 13.0 ± 1.8 | 12.7 ± 1.3 | 10.3 ± 0.8 |
| MBS | 20.5 ± 1.5 | 23.7 ± 1.9 | 20.6 ± 1.2 | 22.3 ± 1.4 | 23.8 ± 1.1 | 26.5 ± 2.0 | 22.5 ± 1.7 |
| FC | 13. 6 ± 1.7 | 12.2 ± 1.3 | 11.1 ± 0.6 | 30.6 ± 1.8* | 23.1 ± 0.6a | 21.8 ± 1.0ab | 17.5 ± 1.8b |
| Trophoblast | 66.0 ± 1.0 | 64.1 ± 2.0 | 68. 3 ± 1.5 | 47.2 ± 1.6* | 53.1 ± 1.6ab | 51.7 ± 1.9a | 60.0 ± 2.5b |
| Surface area (cm2) | |||||||
| MBS | 25.7 ± 1.7 | 31.8 ± 1.5 | 34.5 ± 4.2 | 29.7 ± 1.0 | 27.1 ± 1.0a | 33.4 ± 1.9b | 23.6 ± 2.0a |
| FC | 24.0 ± 1.3 | 35.2 ± 4.0 | 32.8 ± 3.2 | 26.5 ± 2.0 | 24.9 ± 2.3 | 26.2 ± 2.1 | 19.8 ± 2.0 |
| Total SA for exchange | 24.9 ± 1.5a | 33.5 ± 1.9b | 33.7 ± 1.4b | 28.1 ± 2.1 | 26.0 ± 1.6ab | 29.8 ± 1.7a | 21.7 ± 1.8b |
| Th (μm) | 3.27 ± 0.14 | 2.92 ± 0.13 | 3.12 ± 0.19 | 2.57 ± 0.07* | 2.85 ± 0.07a | 2.53 ± 0.03b | 3.08 ± 0.06c |
Data are the mean ± SEM. For biometry: D16N, n = 10; D16 13% H, n = 13; D16 13% PF, n = 7: D19N, n = 16; D19 13% H, n = 15; D19 10% H, n = 14; D19 10% PF, n = 13. For placental morphology: D16N, n = 5–7; D16 13% H, n = 5–8; D16 13% PF, n = 5: D19N, n = 6–7; D19 13% H, n = 4–7; D19 10% H, n = 6–9; D19 10% PF, n = 6–7. Significant differences between groups are indicated in bold. On D16, values with different superscript letters are significantly different from each other by one‐way ANOVA (P < 0.05) and the Bonferroni post hoc test (P < 0.05). On D19, an asterisk (*) indicates that 13% H is significantly different from D19N by Student's t test (P < 0.04), whereas values for the D19N, D19 10% H and D19 10% PF groups with different superscript letters are significantly different from each other by one‐way ANOVA (P < 0.05) and the Bonferroni post hoc test (P < 0.05). F:P, fetal weight to placental weight ratio; SA, surface area; Th, harmonic mean thickness; Total SA for exchange, average of MBS and FC surface areas.
10% O2
Maternal exposure to the more severe hypoxia of 10% inspired O2 from D14 to D19 reduced total body weight, hysterectomized weight and non‐uterine weight gain at D19 compared to D19N controls only, with intermediate values in D19 10% PF group (see Supporting information, Table S1). Weights of the maternal liver and retroperitoneal fat were reduced in 10% hypoxic mice relative to the D19N controls, although these values were similar to the pair‐fed group (see Supporting information, Table S1). Exposure to 10% O2 also reduced fetal weight by 21%, compared to the D19N group (Table 1). Pair‐feeding also reduced fetal weight by 10%, compared to the D19N group (Table 1). Placental weight was similar in the 10% H, D19N and 10% PF groups (Table 1).
Maternal metabolite and hormone concentrations
13% O2
Maternal exposure to 13% O2 reduced maternal blood glucose concentration on D16 but not D19 of pregnancy, relative to their corresponding normoxic ad libitum and pair‐fed control groups (see Supporting information, Table S1). Maternal plasma concentrations of insulin, IGF‐1 and leptin were not affected by maternal exposure to 13% O2 at either stage of pregnancy (see Supporting information, Table S1). However, D16 13% PF mice had significantly lower plasma leptin concentrations than the D16N or D16 13% H dams (see Supporting information, Table S1). Maternal haematocrit was significantly higher in hypoxic than normoxic dams at both stages of pregnancy (see Supporting information, Table S1).
10% O2
Maternal exposure to 10% O2 also significantly increased maternal haematocrit on D19, relative to normoxic dams (see Supporting information, Table S1). On D19, maternal concentrations of blood glucose and of plasma IGF‐1 and insulin were similar in the three groups (see Supporting information, Table S1). Consistent with maternal body fat content, the plasma leptin concentration in D19 10% H dams was half that measured in D19N dams and similar to the D19 10% PF dams (see Supporting information, Table S1).
Placental morphology
13% O2
On D16, the absolute volume of the maternal blood spaces and the total Lz surface area for exchange in 13% H dams were significantly greater than D16N but similar to D16 13% PF dams (Table 1). The absolute volume of the Lz was also greater in 13% H than D16N dams, with intermediate values in the 13% PF mice (Table 1). There was also an overall effect of treatment on the absolute volume of the trophoblast and the surface area of the fetal capillaries in the Lz on D16 (Table 1). On D19, both the absolute and percentage volume of the fetal capillaries were greater in 13% H than normoxic dams (Table 1). In addition, maternal exposure to 13% O2 from D14 to D19 significantly reduced the harmonic mean thickness of the interhemal membrane (Table 1), which is inversely related to the ease with which oxygen crosses the placental barrier. None of the other morphological parameters measured were affected by maternal exposure to 13% O2 or pair‐feeding on D16 or D19 (Table 1).
10% O2
On D19, the majority of the significant differences in placental morphology were seen between the hypoxic and pair‐fed dams, with intermediate values in the D19N group (Table 1). Although not different compared to the D19N group, the absolute and percentage volume of the Jz were greater, whereas the percentage Lz volume, absolute volume and surface area of the maternal blood spaces and the total surface area for exchange were less in the D19 10% H than the D19 10% PF group (Table 1). However, the percentage volume of the Lz occupied by fetal capillaries was significantly less in D19 10% H than D19N dams, whereas the harmonic mean thickness of the interhemal membrane was significantly more in D19 10% H dams than in both D19N and D19 10% PF groups (Table 1).
Placental glucose and amino acid transport
13% O2
Maternal exposure to 13% O2 from D11 to 16 did not affect placental accumulation, unidirectional materno‐fetal clearance or fetal accumulation of either MeGlu or MeAIB on D16, relative to the D16N and D16 13% PF dams (Fig. 2 A–F). There were also no differences in gene expression of the glucose (Slc2a1 and Slc2a3) and System A amino acid transporters (Slc38a1, Slc38a2 and Slc38a4) in the placental Lz between the three groups of dams at D16 (Fig. 2 G and H). By contrast, maternal exposure to 13% O2 later in pregnancy significantly increased placental uptake, unidirectional materno‐fetal clearance and fetal accumulation of MeGlu, relative to the D19N controls (Fig. 2 A, C and E). This occurred in the absence of any significant change in Slc2a1 or Slc2a3 expression in the placental Lz (Fig. 2 G). Placental accumulation, unidirectional materno‐fetal clearance and fetal accumulation of MeAIB on D19 were unaffected by maternal exposure to 13% O2 from D14 to D19 (Fig. 2 B, D and F), although Slc38a1 expression was greater in the placental Lz of 13% H than D19N dams (Fig. 2 H).
Figure 2. Placental transport following exposure to 13% maternal inhalation hypoxia .

Materno‐fetal transport of MeGlu and MeAIB and Lz gene expression of glucose (Slc2a1 and Slc2a3) and System A amino acid transporters (Slc38a1, Slc38a2 and Slc38a4) on D16 and D19 of pregnancy following exposure to 13% O2 inspired air for 5 days from D11 to D16 or D14 to D19 or pair‐feeding normoxic animals to the food intake of mice in 13% O2 from D11 to D14. Data are the mean ± SEM of placental accumulation of MeGlu (A) and MeAIB (B), placental clearance of MeGlu (C) and MeAIB (D), fetal accumulation of MeGlu (E) and MeAIB (F) and Lz gene expression of glucose transporters (G) and System A amino acid amino acid transporters (H). Normoxic ad libitum fed, white columns, D16N, n = 6–7, D19N, n = 7–13; pair‐fed normoxic animals, striped columns, D16 13% PF, n = 5–7; 13% O2 hypoxic, D16 13% H, n = 7–10 and D19 13% H, n = 7–13, grey columns. An asterisk denotes significant difference from the normoxic ad libitum fed (N) group at the same age. *P < 0.05 (Student's t test).
10% O2
Maternal exposure to 10% O2 from D14 to D19 did not affect placental accumulation, unidirectional materno‐fetal clearance or fetal accumulation of MeGlu on D19, relative to both the D19N and D19 10% PF groups (Fig. 3 A, C and E). There were also no significant differences in Slc2a1 or Slc2a3 expression in the placental Lz between the three groups of dams at D19 (Fig. 3 G). By contrast, placental MeAIB clearance was 30–40% less in hypoxic dams than in the normoxic ad libitum fed group at D19, with intermediate values in the pair‐fed group (Fig 3 D). Maternal exposure to 10% O2 from D14 to D19 did not alter placental Lz expression of the Slc38a genes (Fig. 3 H).
Figure 3. Placental transport following exposure to 10% maternal inhalation hypoxia .

Materno‐fetal transport of MeGlu and and MeAIB and Lz gene expression of glucose (Slc2a1 and Slc2a3) and System A amino acid transporters (Slc38a1, Slc38a2 and Slc38a4) on D19 of pregnancy following exposure to 10% O2 inspired air for 5 days from D14 to D19 or pair‐feeding normoxic dams to the food intake of the hypoxic animals from D14 to D19. Data are the mean ± SEM of placental accumulation of MeGlu (A) and MeAIB (B), placental clearance of MeGlu (C) and MeAIB (D), fetal accumulation of MeGlu (E) and MeAIB (F) and Lz gene expression of glucose transporters (G) and System A amino acid transporters (H). Normoxic ad libitum fed, white columns, D19N, n = 7–13; pair‐fed normoxic animals, striped columns, D19 10% PF, n = 7–12; 10% O2 hypoxic, black columns, D19 10% H, n = 6–14. Columns with different superscript letters are significantly different from each other P < 0.05 (one‐way ANOVA with Bonferroni post hoc tests). The D19N values are identical to those shown in Fig. 2.
Igf2 gene expression and insulin‐IGF signalling in the Lz of the placenta
13% O2
Maternal exposure to 13% O2 from D11 to D16 did not affect Lz expression of either total Igf2 or the placental‐specific transcript, Igf2P0, on D16, relative to D16N controls (Fig. 4 A). However, total Igf2 expression in the Lz was less in the 13% H than 13% PF dams at D16 (Fig. 4 A). Maternal exposure to 13% O2 from D11 to D16 significantly increased Lz abundance of IR and Akt‐T308P relative to D16N dams, with intermediate values in the D16 13% PF group (Fig. 4 B and C). By contrast, Lz abundance of Akt‐S473‐P at D16 was reduced by hypoxia compared to ad libitum but not pair‐fed, normoxic animals (Fig. 4 C). Although the total Lz abundance of Akt in D16 13% H dams did not differ from either 13% N or 13% PF values, it was more abundant in the 13% PF group than in the D16N group (Fig. 4 C). The Lz abundances of IGF1R, p85α, p110α and p110β were similar in all groups at D16 (Fig. 4). By contrast to the findings on D16, maternal exposure to13% O2 from D14 to D19 increased Lz expression of both total Igf2 and Igf2P0 relative to the D19N (Fig. 4 A). These changes were accompanied by a significant increase in Akt‐S473‐P abundance and significant reductions in the abundances of IR, IGF1R, p85α, p110α and Akt total in the Lz of D19 13% H relative to normoxic dams (Fig. 4 B and C). The abundance of p110β and Akt‐T308‐P was unaffected by maternal hypoxia at D19 (Fig. 4).
Figure 4. Placental insulin/IGF signalling following exposure to 13% maternal inhalation hypoxia .
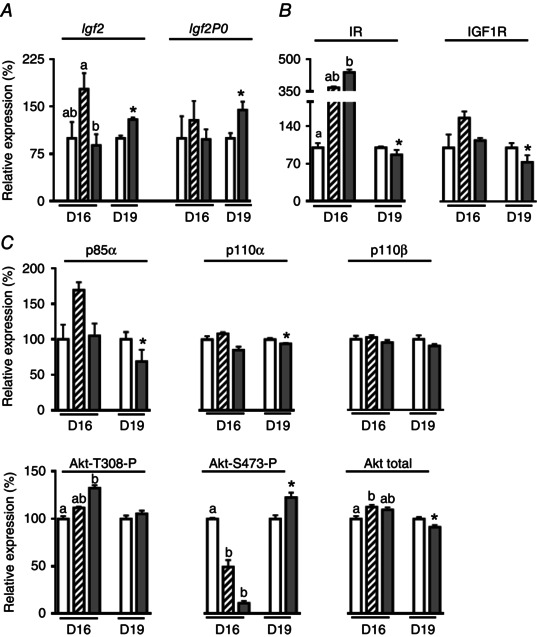
Labyrinthine expression of Igf2 (A) and components of the insulin‐IGF signalling pathway (B and C) on D16 and D19 of pregnancy following exposure to 13% inspired O2 for 5 days from D11 to D16 or D14 to D19 or pair‐feeding normoxic mice to the food intake of the hypoxic animals from D11 to D16. Data are the mean ± SEM. Normoxic ad libitum fed, white columns, D16N, n = 5–6, D19N, n = 5–9; pair‐fed animals, striped columns, D16 13% PF, n = 5–6; 13% O2 hypoxic, D16 13% H, n = 5–6 and D19 13% H, n = 5–6, grey columns. On D16, columns with different superscript letters are significantly different from each other P < 0.05 (one‐way ANOVA with Bonferroni post hoc tests). On D19, an asterisk denotes a significant difference from the normoxic ad libitum fed (N) group at the same age. *P < 0.05 (Student's t test).
10% O2
On D19, the expression of total Igf2 and Igf2P0 in the placental Lz was unaffected by maternal exposure to 10% O2 or pair‐feeding (Fig. 5 A). Maternal exposure to 10% O2 from D14 to D19 significantly decreased Lz abundance of IGF1R, p110α and Akt‐S473‐P relative to D19N but not D19 10% PF dams (Fig. 5 B and C). In addition, IR abundance was less in D19 10% H than D19 10% PF dams, although neither of these values differed significantly from that seen in the D19N group (Fig. 5B). The Lz abundance of p85α, p110β, Akt‐T308‐P and Akt total was similar in the three D19 groups (Fig. 5).
Figure 5. Placental insulin/IGF signalling following exposure to 10% maternal inhalation hypoxia .

Labyrinthine expression of Igf2 (A) and components of the insulin‐IGF signalling pathway (B and C) on D19 of pregnancy following exposure to 10% inspired O2 for 5 days from D14 to D19 or pair‐feeding normoxic mice to the food intake of the hypoxic animals from D14 to D19. Data are the mean ± SEM. Normoxic ad libitum fed, white columns, D19N, n = 5–9; pair‐fed animals, striped columns, D19 10% PF, n = 5–8; 10% hypoxic, black columns, D19 10% H, n = 5–9. Columns with different superscript letters are significantly different from each other P < 0.05 (one‐way ANOVA with Bonferroni post hoc tests).
Discussion
The present study demonstrates that maternal inhalation hypoxia modifies placental phenotype and maternal resource allocation to fetal growth. The placental changes were both morphological and functional in origin and occurred without any change in placental weight. They also were accompanied by altered expression of the Igf2 gene and proteins in the insulin‐IGF signalling pathway in the Lz of the placenta. The specific nature of these phenotypical changes and their effect on fetal growth depended on the timing and severity of the hypoxic insult and also, in some instances, reflected the concomitant maternal hypophagia. With exposure to 13% O2, the placental adaptations in morphology and transfer of glucose and amino acid were largely beneficial to fetal nutrient acquisition and were associated with only a small (5%) restriction in fetal growth at D19. By contrast, maternal exposure to 10% O2 during late gestation had detrimental consequences for placental amino acid transfer and materno‐fetal resource allocation, with the result that fetal growth at D19 was reduced by 21%. Taken together, these findings indicate that there is a threshold between 13% and 10% maternal inspired oxygen at which the hypoxic mouse dam and placenta can no longer adapt to support growth of the fetus.
The lack of effect of hypoxia on placental weight in the present study is consistent with previous findings in rats and mice exposed to short periods of hypoxia in late pregnancy (Lueder et al. 1995; Saker et al. 1999; Cuffe et al. 2014). Amongst species, more consistent reductions in placental weight are seen in response to undernutrition, particularly when this occurs throughout most of pregnancy (Rosso, 1977; Dwyer & Stickland,
1992), (Malandro et al. 1996; Woodall et al. 1996; Fernandez‐Twinn et al. 2003; Jansson et al. 2006; Mogami et al. 2009; Coan et al. 2010, 2011; Sferruzzi‐Perri et al. 2011). However, in the present study, the relatively short period of undernutrition induced by pair‐feeding in late pregnancy did not affect placental weight. Overall, the observations of the present study suggest that gross growth of the mouse placenta exhibits a degree of resilience to short‐term hypoxic and nutritional insults once it has formed. However, there were ultrastructural changes in the placenta in response to both hypoxia and the undernutrition of pair‐feeding with impacts on placental transport of specific nutrients and, hence, fetal growth.
In dams exposed to 13% O2, the Lz volume was increased on D16 in association with expansion of the maternal blood spaces, the fetal capillary surface area and the total surface area for exchange, although there was no change in the thickness of the placental interhaemel membrane at this age. Similar ultrastructural changes were seen in the dams pair‐fed to the reduced intake of the 13% H dams, which suggests that the adaptations in placental morphology at D16 were driven largely by maternal undernutrition. By contrast, exposure to 13% O2 in late pregnancy increased fetal vascularity rather than maternal blood space volumes and reduced the thickness of the interhemal membrane at D19, consistent with morphological changes seen in the term placenta of other species exposed to equivalent degrees of hypoxia (Bacon et al. 1984; Jacobs et al. 1988; Krebs et al. 1996; Mayhew, 1998; Parraguez et al. 2006). Although the specific morphological adaptations of the 13% H mouse placenta differed at the two stages of pregnancy, their net outcome was similar with respect to increasing the placental capacity for transport of nutrients and O2 to the fetus (Fowden et al. 2006, 2009). This may explain, in part, the lack of effect of moderate hypoxia at 13% O2 on feto‐placental growth at D16 and its relatively minor effect on fetal body weight at D19. In comparison, exposure to 10% O2 had detrimental effects on placental morphology, with decreased fetal vascularity and increased barrier thickness at D19, consistent with the more severe degree of fetal growth restriction in this group. These morphological changes appear to have been a result of hypoxia alone because they were not seen in dams pair‐fed to the reduced food intake of the D19 10% H group. Indeed, in contrast to more prolonged maternal undernutrition (Coan et al. 2010), the short period of nutrient restriction induced by pair‐feeding caused changes in placental morphology that are probably more beneficial than detrimental to fetal nutrient delivery. As a result, the degree of fetal growth restriction in the hypophagic dams exposed to 10% O2 was more than twice that seen in the normoxic pair‐fed dams at D19.
In addition to the changes in placental morphology induced by maternal hypoxia, there were also functional and metabolic adaptations in the placenta with consequences for resource allocation, particularly at D19. Exposure to 13% O2 from D14 to D19 increased placental uptake and clearance of MeGlu and its accumulation in the fetus, which suggests that glucose becomes a more important metabolic substrate in feto‐placental tissues when oxygen availability is limited near term. Indeed, increased glycolytic use of glucose by the placenta would spare O2 for onward passage to the fetus, in line with suggestions made previously for the high altitude human placenta (Illsley et al. 2010). As well as reducing the placental O2 requirement, increasing placental glycolysis during hypoxia would help to maintain an ATP supply for the active transport of amino acids, which is consistent with the finding in the present study that placental MeAIB clearance at D19 was unaffected by maternal exposure to 13% O2. In addition, the increased transplacental supply of glucose in the D19 13% H group may have promoted glycolytic metabolism in the fetuses and hence maintained a supply of ATP for fetal growth and metabolism in the face of a limited capacity for oxidative metabolism. Certainly, previous studies in pregnant rats have shown increased glucose uptake and lactate production by the fetuses during hypoxic conditions, in association with normal growth of key fetal tissues, such as the heart and brain (Lueder et al. 1995). Because fetal growth in rodents is dependent on placental System A amino acid transport and is more closely correlated to placental amino acid than glucose delivery in late gestation (Cramer et al. 2002; Coan et al. 2011), the adaptations in the transport and metabolic characteristics of the D19 13% H placenta will also help to minimize the degree of fetal growth restriction near term.
By contrast, the more severe insult of 10% O2 had no effect on placental glucose uptake or clearance but reduced placental MeAIB clearance in line with the compromised placental morphology and more severe fetal growth restriction. Similar reductions in placental System A activity have been reported in human placental cells cultured in vitro under severe hypoxic conditions (Nelson et al. 2003; Kleppa et al. 2014) and in human placental samples from compromised pregnancies with fetal growth restriction (Glazier et al. 1997; Jansson et al. 1998, 2002; Cetin, 2003). Comparison with the D19 10% PF group suggests that hypoxia and undernutrition contributed equally to the reduced placental MeAIB clearance in the hypophagic D19 10% H group. In previous studies on mice, placental MeAIB transport was increased near term in response to longer term maternal undernutrition and reduced by mild protein restriction throughout pregnancy (Coan et al. 2010, 2011; Sferruzzi‐Perri et al. 2011; Ganguly et al. 2012). This suggests that adaptation of the placental System A amino acid transport system depends on the specific maternal environment and the timing of the environmental challenge. In the present study, both exposure to 10% O2 and pair‐feeding altered maternal body composition and reduced maternal adiposity and circulating leptin concentrations at D19. This hypoleptinaemia may have accounted for the nutritional contribution to reduced placental MeAIB clearance because leptin is known to stimulate amino acid uptake in the human placenta (Jansson et al. 2003). Other maternal hormones, such as corticosterone, may be involved in the hypoxic contribution to placental MeAIB transport because corticosterone reduced System A activity and was elevated in concentration by short term maternal exposure to 12% O2, without hypophagia, in mice during late pregnancy (Vaughan et al. 2012 b; Cuffe et al. 2014). Alternatively, O2 levels may be sufficiently limited at 10% O2 to compromise ATP availability for the active transport of amino acids across the placenta via System A transporters. Consistent with this, recent work has shown increased activation of the energy sensor, adenosine monophosphate‐activated protein kinase (AMPK), in the placenta and uterine vessels of mouse dams exposed to 10% O2 hypoxia for the same period in pregnancy (Skeffington et al. 2016). Enhanced AMPK activation may prevent further energy depletion and optimize utero‐placental blood flow in the prevailing hypoxic environment. However, the restriction in fetal growth as a result of both reduced maternal O2 supply and placental amino acid delivery may have reduced the fetal signals of nutrient demand that are assumed to contribute to environmental regulation of placental transport when O2 is not so severely limited (Burton & Fowden, 2012). Whatever the cause, the reduced amino acid supply to fetuses of D19 10% H dams will have spared amino acids for maternal use with potential benefits to maternal fitness, given the hypophagia and reduced accumulation of maternal mass during late pregnancy.
The changes in placental phenotype induced by maternal hypoxia may be partly a result of alterations in Igf2 gene expression and changes in insulin‐IGF signalling in the Lz, even though maternal concentrations of insulin and IGF‐I were unaffected by hypoxia. Previous studies have shown that the Igf2 gene is essential for placental adaptation to undernutrition in late gestation and influences placental vascularity, barrier thickness and nutrient transport during normal development (Constancia et al. 2005; Coan et al. 2008, 2010; Sferruzzi‐Perri et al. 2011). The disparity of the placental response to moderate and severe hypoxia at D19 may therefore relate to the finding that Lz abundance of the total and placental specific Igf2 transcripts was increased in the D19 13% H dams but not in the D19 10% H group. At D16, the changes in placental Lz morphology in 13% O2 were not associated specifically with altered Igf2 gene expression but were accompanied by increased IR abundance, which may reflect an attempt to increase Lz sensitivity to the anabolic actions of insulin and IGF (Sferruzzi‐Perri et al. 2010, 2013 a). This is consistent with the greater Lz volume and total exchange area in these D16 13% H placentas, together with an increased Lz abundance of Akt‐T308‐P, the residue on Akt that is phosphorylated in response to insulin via PI3K (Vadlakonda et al. 2013). By contrast, there were decreases in Lz abundance of IR, IGF1R and specific PI3K subunits on D19, in response to 13% O2 in late gestation. Because these changes were also seen in the D19 10% H dams, they suggest that anabolic activity mediated by PI3K and the upstream elements of the insulin‐IGF signalling pathway were down‐regulated by oxygen deprivation, irrespective of its severity. However, the effect on the Lz insulin‐IGF pathway downstream of PI3K differed with the degree of hypoxia, with increased Akt‐S473‐P in the D19 13% H group but decreased phosphorylation of this site in both the D19 10% H and D19 10% PF dams. Because Lz abundance of Akt‐S473‐P was also decreased in the D16 13% H and D16 13% PF groups, phosphorylation of Akt‐S473 in the Lz appears to be decreased by undernutrition and increased by hypoxia alone. Consequently, there were changes in the ratio of Akt‐S473‐P to Akt‐T308‐P in all the hypoxic and pair‐fed dams relative to their respective normoxic ad libitum fed controls, irrespective of the stage of pregnancy. Because the two Akt phosphorylation sites are regulated independently and may control different cellular processes downstream of PI3K (Vadlakonda et al. 2013), the observations made in the present study suggest that Akt phosphorylation may be a key process in the environmental regulation of placental phenotype, particularly because genetic deletion of Akt is also known to affect the vascularity and thickness of the exchange barrier in the mouse placenta (Yang et al. 2003). Indeed, changes in the Akt‐S473‐P to Akt‐T308‐P ratio have been observed previously in the mouse placenta in response to maternal dietary and endocrine manipulations, as well as in human placenta at high altitude and in human placental cell lines cultured under hypoxic conditions (Yung et al. 2008; Zhu et al. 2009; Sferruzzi‐Perri et al. 2011; Yung et al. 2012; Sferruzzi‐Perri et al. 2013 b; Vaughan et al. 2015). Further work is required to determine the contribution of other environmental sensing pathways in the hypoxia/hypophagic‐induced alterations in placental transport phenotype (including the mechanistic target of rapamycin, general control non‐repressed 2, glucokinase, G‐protein coupled‐receptors 40 and 120, hypoxia‐inducible factors and AMPK) (Efeyan et al. 2015).
In summary, the mouse placenta adapts to help maintain fetal growth in response to moderate but not severe hypoxia. With moderate hypoxia at 13% O2, there were several morphological adaptations in the placenta beneficial to fetal growth, irrespective of the stage of pregnancy, which were related to changes in Igf2 gene expression and insulin‐IGF signalling proteins in the Lz. Functionally, there were changes in placental transport and metabolism of glucose in response to moderate hypoxia at D19, which may have spared oxygen for fetal use and provided additional substrate for glycolytic production of energy in the feto‐placental tissues when the capacity for oxidative metabolism was limited. With the more severe hypoxia at 10% O2, there were no beneficial adaptations in placental morphology, transport or Igf2 gene expression. Indeed, all the changes in placental phenotype at this degree of hypoxia were detrimental to nutrient and oxygen transfer to the fetus which, together with the maternal hypophagia, resulted in severe fetal growth restriction that was four‐fold greater than seen with moderate hypoxia. Taken together, these observations suggest that the adaptations in placental phenotype induced by maternal hypoxia are influenced by a wide range of factors, including maternal nutrition, fuel reserves, endocrine status, actual oxygen availability and feto‐placental nutrient demands related to gestational age and conceptus mass. The placenta therefore integrates these multiple signals to optimize maternal resource allocation to the fetus with respect to the prevailing environment. However, further studies are required to establish the importance of other signalling pathways and differential regulation of Akt phosphorylation at its two phosphorylation sites with respect to environmental sensing and adaptation of the placenta.
Additional information
Competing interests
The authors declare that they have no competing interests.
Author contributions
ANS‐P and ALF conceived the project. All authors helped carry out the experiments and analysed the results. JSH, ANS‐P and ALF wrote the manuscript, which was subsequently commented on by ORV and EFdeL. All authors have approved the final version of the manuscript and agree to be accountable for all aspects of the work. All persons designated as authors qualify for authorship, and all those who qualify for authorship are listed.
Funding
This work was funded by BBSRC studentship and in vivo skills award to JSH and by a NHMRC CJ Martin Fellowship and a Centre for Trophoblast Research Next Generation Fellowship to ANS‐P.
Supporting information
Table S1. Maternal biometry, haematocrit and concentrations of blood glucose and plasma hormones Maternal biometry, haematocrit and concentrations of blood glucose and plasma hormones on D16 and D19 of pregnancy in normoxic dams (21% atmospheric O2 content); hypoxic dams exposed for 5 days either to 13% O2 from D11 to D16 or D14 to D19 or to 10% O2 from D14 to D19; and normoxic dams pair‐fed to the food intake of the 13% H dams from D11 to D16 or of the 10% H dams from D14 to D19.
Acknowledgements
The authors would like to thank all the staff of the animal facility for their care of the mice, as well as Nuala Daw, Melanie Monk and Emma Eastwood for their assistance with the biochemical analyses. We would also like to thank Gavin Jarvis for his statistical advice.
References
- Ali KZM, Burton GJ, Morad N & Ali ME (1996). Does hypercapillarization influence the branching pattern of terminal villi in the human placenta at high altitude? Placenta 17, 677–682. [DOI] [PubMed] [Google Scholar]
- Bacon BJ, Gilbert RD, Kaufmann P, Smith AD, Trevino FT & Longo LD (1984). Placental anatomy and diffusing capacity in guinea pigs following long‐term maternal hypoxia. Placenta 5, 475–487. [DOI] [PubMed] [Google Scholar]
- Burton GJ & Fowden AL (2012). Review: the placenta and developmental programming: balancing fetal nutrient demands with maternal resource allocation. Placenta 33, S23–S27. [DOI] [PubMed] [Google Scholar]
- Burton GJ & Fowden AL (2015). The placenta: a multifaceted, transient organ. Philos Trans R Soc Lond B Biol Sci 370, 20140066. [DOI] [PMC free article] [PubMed] [Google Scholar]
- Cetin I (2003). Placental transport of amino acids in normal and growth‐restricted pregnancies. Eur J Obstet Gynecol Reprod Biol 110 (Suppl 1), S50–S54. [DOI] [PubMed] [Google Scholar]
- Coan PM, Ferguson‐Smith AC & Burton GJ (2004). Developmental dynamics of the definitive mouse placenta assessed by stereology. Biol Reprod 70, 1806–1813. [DOI] [PubMed] [Google Scholar]
- Coan PM, Fowden AL, Constancia M, Ferguson‐Smith AC, Burton GJ & Sibley CP (2008). Disproportional effects of Igf2 knockout on placental morphology and diffusional exchange characteristics in the mouse. J Physiol 586, 5023–5032. [DOI] [PMC free article] [PubMed] [Google Scholar]
- Coan PM, Vaughan OR, McCarthy J, Mactier C, Burton GJ, Constancia M & Fowden AL (2011). Dietary composition programmes placental phenotype in mice. J Physiol 589, 3659–3670. [DOI] [PMC free article] [PubMed] [Google Scholar]
- Coan PM, Vaughan OR, Sekita Y, Finn SL, Constancia M, Burton GJ & Fowden AL (2010). Adaptations in placental phenotype support fetal growth during undernutrition of pregnant mice. J Physiol 588, 527–538. [DOI] [PMC free article] [PubMed] [Google Scholar]
- Constancia M, Angiolini E, Sandovici I, Smith P, Smith R, Kelsey G, Dean W, Ferguson‐Smith A, Sibley CP, Reik W & Fowden A (2005). Adaptation of nutrient supply to fetal demand in the mouse involves interaction between the Igf2 gene and placental transporter systems. Proc Natl Acad Sci USA 102, 19219–19224. [DOI] [PMC free article] [PubMed] [Google Scholar]
- Cramer S, Beveridge M, Kilberg M & Novak D (2002). Physiological importance of system A‐mediated amino acid transport to rat fetal development. Am J Physiol Cell Physiol 282, C153–C160. [DOI] [PubMed] [Google Scholar]
- Cuffe JS, Walton SL, Singh RR, Spiers JG, Bielefeldt‐Ohmann H, Wilkinson L, Little MH & Moritz KM (2014). Mid‐ to late term hypoxia in the mouse alters placental morphology, glucocorticoid regulatory pathways and nutrient transporters in a sex‐specific manner. J Physiol 592, 3127–3141. [DOI] [PMC free article] [PubMed] [Google Scholar]
- Diaz P, Powell TL & Jansson T (2014). The role of placental nutrient sensing in maternal‐fetal resource allocation. Biol Reprod 91, 82. [DOI] [PMC free article] [PubMed] [Google Scholar]
- Dwyer CM & Stickland NC (1992). The effects of maternal undernutrition on maternal and fetal serum insulin‐like growth factors, thyroid hormones and cortisol in the guinea pig. J Dev Physiol 18, 303–313. [PubMed] [Google Scholar]
- Efeyan A, Comb WC & Sabatini DM (2015). Nutrient‐sensing mechanisms and pathways. Nature 517, 302–310. [DOI] [PMC free article] [PubMed] [Google Scholar]
- Feldser D, Agani F, Iyer NV, Pak B, Ferreira G & Semenza GL (1999). Reciprocal positive regulation of hypoxia‐inducible factor 1alpha and insulin‐like growth factor 2. Cancer Res 59, 3915–3918. [PubMed] [Google Scholar]
- Fernandez‐Twinn DS, Ozanne SE, Ekizoglou S, Doherty C, James L, Gusterson B & Hales CN (2003). The maternal endocrine environment in the low‐protein model of intra‐uterine growth restriction.Br J Nutr 90, 815–822. [DOI] [PubMed] [Google Scholar]
- Fowden AL, Sferruzzi‐Perri AN, Coan PM, Constancia M & Burton GJ (2009). Placental efficiency and adaptation: endocrine regulation. Journal of Physiology 587, 3459–3472. [DOI] [PMC free article] [PubMed] [Google Scholar]
- Fowden AL, Ward JW, Wooding FP, Forhead AJ & Constancia M (2006). Programming placental nutrient transport capacity. J Physiol 572, 5–15. [DOI] [PMC free article] [PubMed] [Google Scholar]
- Ganguly A, Collis L & Devaskar SU (2012). Placental glucose and amino acid transport in calorie‐restricted wild‐type and Glut3 null heterozygous mice. Endocrinology 153, 3995–4007. [DOI] [PMC free article] [PubMed] [Google Scholar]
- Gheorghe CP, Mohan S, Oberg KC & Longo LD (2007). Gene expression patterns in the hypoxic murine placenta: a role in epigenesis? Reprod Sci 14, 223–233. [DOI] [PubMed] [Google Scholar]
- Giussani DA & Davidge ST (2013). Developmental programming of cardiovascular disease by prenatal hypoxia. J Dev Orig Hlth Dis 4, 328–337. [DOI] [PubMed] [Google Scholar]
- Giussani DA, Phillips PS, Anstee S & Barker DJ (2001). Effects of altitude versus economic status on birth weight and body shape at birth. Pediatr Res 49, 490–494. [DOI] [PubMed] [Google Scholar]
- Glazier JD, Cetin I, Perugino G, Ronzoni S, Grey AM, Mahendran D, Marconi AM, Pardi G & Sibley CP (1997). Association between the activity of the system A amino acid transporter in the microvillous plasma membrane of the human placenta and severity of fetal compromise in intrauterine growth restriction. Pediatr Res 42, 514–519. [DOI] [PubMed] [Google Scholar]
- Hutter D, Kingdom J & Jaeggi E (2010). Causes and mechanisms of intrauterine hypoxia and its impact on the fetal cardiovascular system: a review. Int J Pediatr 401323, 19. [DOI] [PMC free article] [PubMed] [Google Scholar]
- Hvizdosova‐Klescova A, Uhlik J, Malina M, Vulterinova H, Novotny T & Vajner L (2013). Remodeling of fetoplacental arteries in rats due to chronic hypoxia. Exp Toxicol Pathol 65, 97–103. [DOI] [PubMed] [Google Scholar]
- Illsley NP, Caniggia I & Zamudio S (2010). Placental metabolic reprogramming: do changes in the mix of energy‐generating substrates modulate fetal growth? Int J Dev Biol 54, 409–419. [DOI] [PMC free article] [PubMed] [Google Scholar]
- Jacobs R, Robinson JS, Owens JA, Falconer J & Webster ME (1988). The effect of prolonged hypobaric hypoxia on growth of fetal sheep. J Dev Physiol 10, 97–112. [PubMed] [Google Scholar]
- Jansson N, Greenwood SL, Johansson BR, Powell TL & Jansson T (2003). Leptin stimulates the activity of the system A amino acid transporter in human placental villous fragments. J Clin Endocrinol Metab 88, 1205–1211. [DOI] [PubMed] [Google Scholar]
- Jansson N, Pettersson J, Haafiz A, Ericsson A, Palmberg I, Tranberg M, Ganapathy V, Powell TL & Jansson T (2006). Down‐regulation of placental transport of amino acids precede the development of intrauterine growth restriction in rats fed a low protein diet. J Physiol 576, 935–946. [DOI] [PMC free article] [PubMed] [Google Scholar]
- Jansson T, Scholtbach V & Powell TL (1998). Placental transport of leucine and lysine is reduced in intrauterine growth restriction. Pediatr Res 44, 532–537. [DOI] [PubMed] [Google Scholar]
- Jansson T, Ylven K, Wennergren M & Powell TL (2002). Glucose transport and system A activity in syncytiotrophoblast microvillous and basal plasma membranes in intrauterine growth restriction. Placenta 23, 392–399. [DOI] [PubMed] [Google Scholar]
- Jones HN, Woollett LA, Barbour N, Prasad PD, Powell TL & Jansson T (2008). High‐fat diet before and during pregnancy causes marked up‐regulation of placental nutrient transport and fetal overgrowth in C57/BL6 mice. FASEB J 23, 271–278. [DOI] [PMC free article] [PubMed] [Google Scholar]
- Kavitha JV, Rosario FJ, Nijland MJ, McDonald TJ, Wu G, Kanai Y, Powell TL, Nathanielsz PW & Jansson T (2014). Down‐regulation of placental mTOR, insulin/IGF‐I signaling, and nutrient transporters in response to maternal nutrient restriction in the baboon. FASEB J 28, 1294–1305. [DOI] [PMC free article] [PubMed] [Google Scholar]
- King V, Hibbert N, Seckl JR, Norman JE & Drake AJ (2013). The effects of an obesogenic diet during pregnancy on fetal growth and placental gene expression are gestation dependent. Placenta 34, 1087–1090. [DOI] [PubMed] [Google Scholar]
- Kleppa MJ, Erlenwein SV, Darashchonak N, von Kaisenberg CS & von Versen‐Hoynck F (2014). Hypoxia and the anticoagulants dalteparin and acetylsalicylic acid affect human placental amino acid transport. PLoS ONE 9, e99217. [DOI] [PMC free article] [PubMed] [Google Scholar]
- Krebs C, Macara LM, Leiser R, Bowman AW, Greer IA & Kingdom JC (1996). Intrauterine growth restriction with absent end‐diastolic flow velocity in the umbilical artery is associated with maldevelopment of the placental terminal villous tree. Am J Obstet Gynecol 175, 1534–1542. [DOI] [PubMed] [Google Scholar]
- Lager S, Samulesson AM, Taylor PD, Poston L, Powell TL & Jansson T (2014). Diet‐induced obesity in mice reduces placental efficiency and inhibits placental mTOR signaling. Physiol Rep 2, e00242. [DOI] [PMC free article] [PubMed] [Google Scholar]
- Lueder FL, Kim SB, Buroker CA, Bangalore SA & Ogata ES (1995). Chronic maternal hypoxia retards fetal growth and increases glucose utilization of select fetal tissues in the rat. Metabolism 44, 532–537. [DOI] [PubMed] [Google Scholar]
- Ma Y, Zhu MJ, Uthlaut AB, Nijland MJ, Nathanielsz PW, Hess BW & Ford SP (2011). Upregulation of growth signaling and nutrient transporters in cotyledons of early to mid‐gestational nutrient restricted ewes. Placenta 32, 255–263. [DOI] [PMC free article] [PubMed] [Google Scholar]
- Malandro MS, Beveridge MJ, Kilberg MS & Novak DA (1996). Effect of low‐protein diet‐induced intrauterine growth retardation on rat placental amino acid transport. Am J Physiol Cell Physiol 271, C295–C303. [DOI] [PubMed] [Google Scholar]
- Mayhew TM (1998). Thinning of the intervascular tissue layers of the human placenta is an adaptive response to passive diffusion in vivo and may help to predict the origins of fetal hypoxia. Eur J Obstet Gynecol Reprod Biol 81, 101–109. [DOI] [PubMed] [Google Scholar]
- McMillen IC & Robinson JS. (2005). Developmental origins of the metabolic syndrome: prediction, plasticity, and programming. Physiol Rev 85, 571–633. [DOI] [PubMed] [Google Scholar]
- Mogami H, Yura S, Itoh H, Kawamura M, Fujii T, Suzuki A, Aoe S, Ogawa Y, Sagawa N, Konishi I & Fujii S (2009). Isocaloric high‐protein diet as well as branched‐chain amino acids supplemented diet partially alleviates adverse consequences of maternal undernutrition on fetal growth. Growth HormIGF Res 19, 478–485. [DOI] [PubMed] [Google Scholar]
- Moore LG, Charles SM & Julian CG (2011). Humans at high altitude: hypoxia and fetal growth. Respir Physiol Neurobiol 178, 181–190. [DOI] [PMC free article] [PubMed] [Google Scholar]
- Myatt L (2006). Placental adaptive responses and fetal programming. J Physiol 572, 25–30. [DOI] [PMC free article] [PubMed] [Google Scholar]
- Nelson DM, Smith SD, Furesz TC, Sadovsky Y, Ganapathy V, Parvin CA & Smith CH (2003). Hypoxia reduces expression and function of system A amino acid transporters in cultured term human trophoblasts. Am J Physiol Cell Physiol 284, C310–C315. [DOI] [PubMed] [Google Scholar]
- Parraguez VH, Atlagich M, Diaz R, Bruzzone ME, Behn C & Raggi LA (2005). Effect of hypobaric hypoxia on lamb intrauterine growth: comparison between high‐ and low‐altitude native ewes. Reprod Fert Develop 17, 497–505. [DOI] [PubMed] [Google Scholar]
- Parraguez VH, Atlagich M, Diaz R, Cepeda R, Gonzalez C, De los Reyes M, Bruzzone ME, Behn C & Raggi LA (2006). Ovine placenta at high altitudes: comparison of animals with different times of adaptation to hypoxic environment. Anim Reprod Sci 95, 151–157. [DOI] [PubMed] [Google Scholar]
- Penninga L & Longo LD (1998). Ovine placentome morphology: effect of high altitude, long‐term hypoxia. Placenta 19, 187–193. [DOI] [PubMed] [Google Scholar]
- Postigo L, Heredia G, Illsley NP, Torricos T, Dolan C, Echalar L, Tellez W, Maldonado I, Brimacombe M, Balanza E, Vargas E & Zamudio S (2009). Where the O2 goes to: preservation of human fetal oxygen delivery and consumption at high altitude. J Physiol 587, 693–708. [DOI] [PMC free article] [PubMed] [Google Scholar]
- Rosario FJ, Jansson N, Kanai Y, Prasad PD, Powell TL & Jansson T (2011). Maternal protein restriction in the rat inhibits placental insulin, mTOR, and STAT3 signaling and down‐regulates placental amino acid transporters. Endocrinology 152, 1119–1129. [DOI] [PMC free article] [PubMed] [Google Scholar]
- Rosso P (1977). Maternal–fetal exchange during protein malnutrition in the rat. Placental transfer of glucose and a nonmetabolizable glucose analog. J Nutr 107, 20006–20010. [DOI] [PubMed] [Google Scholar]
- Saker F, Voora DM, Mahajan SD, Kilic I, Ismail‐Beigi F & Kalhan SC (1999). Effect of reduced inspired oxygen on fetal growth and maternal glucose metabolism in rat pregnancy. Metabolism 48, 738–744. [DOI] [PubMed] [Google Scholar]
- Schmittgen TD & Livak KJ (2008). Analyzing real‐time PCR data by the comparative C‐T method. Nat Protoc 3, 1101–1108. [DOI] [PubMed] [Google Scholar]
- Sferruzzi‐Perri AN, Owens JA, Pringle KG & Roberts CT (2010). The neglected role of insulin‐like growth factors in the maternal circulation regulating fetal growth. J Physiol 589, 7–20. [DOI] [PMC free article] [PubMed] [Google Scholar]
- Sferruzzi‐Perri AN, Vaughan OR, Coan PM, Suciu MC, Darbyshire R, Constancia M, Burton GJ & Fowden AL (2011). Placental‐specific Igf2 deficiency alters developmental adaptations to undernutrition in mice. Endocrinology 152, 3202–3212. [DOI] [PubMed] [Google Scholar]
- Sferruzzi‐Perri AN, Vaughan OR, Forhead AJ & Fowden AL (2013. a). Hormonal and nutritional drivers of intrauterine growth. Curr Opin Clin Nutr Metab Care 16, 298–309. [DOI] [PubMed] [Google Scholar]
- Sferruzzi‐Perri AN, Vaughan OR, Haro M, Cooper WN, Musial B, Charalambous M, Pestana D, Ayyar S, Ferguson‐Smith AC, Burton GJ, Constancia M & Fowden AL (2013. b). An obesogenic diet during mouse pregnancy modifies maternal nutrient partitioning and the fetal growth trajectory. FASEB 27, 3928–3937. [DOI] [PubMed] [Google Scholar]
- Sibley CP, Coan PM, Ferguson‐Smith AC, Dean W, Hughes J, Smith P, Reik W, Burton GJ, Fowden AL & Constância M (2004). Placental‐specific insulin‐like growth factor 2 (Igf2) regulates the diffusional exchange characteristics of the mouse placenta. Proc Natl Acad Sci USA 101, 8204–8208. [DOI] [PMC free article] [PubMed] [Google Scholar]
- Skeffington KL, Higgins JS, Mahmoud AD, Evans AM, Sferruzzi‐Perri AN, Fowden AL, Yung HW, Burton GJ, Giussani DA & Moore LG (2016). Hypoxia, AMPK activation and uterine artery vasoreactivity. J Physiol 594, 1357–1369. [DOI] [PMC free article] [PubMed] [Google Scholar]
- Soria R, Julian CG, Vargas E, Moore LG & Giussani DA (2013). Graduated effects of high‐altitude hypoxia and highland ancestry on birth size. Pediatr Res 74, 633–638. [DOI] [PubMed] [Google Scholar]
- Storz JF, Sabatino SJ, Hoffmann FG, Gering EJ, Moriyama H, Ferrand N, Monteiro B & Nachman MW (2007). The molecular basis of high‐altitude adaptation in deer mice. Plos Genet 3, e45. [DOI] [PMC free article] [PubMed] [Google Scholar]
- Tissot van Patot M, Grilli A, Chapman P, Broad E, Tyson W, Heller DS, Zwerdlinger L & Zamudio S (2003). Remodelling of uteroplacental arteries is decreased in high altitude placentae. Placenta 24, 326–335. [DOI] [PubMed] [Google Scholar]
- Tissot van Patot MC, Murray AJ, Beckey V, Cindrova‐Davies T, Johns J, Zwerdlinger L, Jauniaux E, Burton GJ & Serkova NJ (2010). Human placental metabolic adaptation to chronic hypoxia, high altitude: hypoxic preconditioning. Am J Physiol Regul Integr Comp Physiol 298, R166–R172. [DOI] [PMC free article] [PubMed] [Google Scholar]
- Vadlakonda L, Dash A, Pasupuleti M, Anil Kumar K & Reddanna P (2013). The paradox of Akt‐mTOR interactions. Front Oncol 3, 165. [DOI] [PMC free article] [PubMed] [Google Scholar]
- Vaughan OR, Fisher HM, Dionelis KN, Jefferies EC, Higgins JS, Musial B, Sferruzzi‐Perri AN & Fowden AL (2015). Corticosterone alters materno‐fetal glucose partitioning and insulin signalling in pregnant mice. J Physiol 593, 1307–1321. [DOI] [PMC free article] [PubMed] [Google Scholar]
- Vaughan OR, Sferruzzi‐Perri AN, Coan PM & Fowden AL (2012. a). Environmental regulation of placental phenotype: implications for fetal growth. Reprod Fertil Dev 24, 80–96. [DOI] [PubMed] [Google Scholar]
- Vaughan OR, Sferruzzi‐Perri AN & Fowden AL (2012. b). Maternal corticosterone regulates nutrient allocation to fetal growth in mice. J Physiol 590, 5529–5540. [DOI] [PMC free article] [PubMed] [Google Scholar]
- West JB (2002). Highest permanent human habitation. High Alt Med Biol 3, 401–407. [DOI] [PubMed] [Google Scholar]
- Woodall SM, Breier BH, Johnston BM & Gluckman PD (1996). A model of intrauterine growth retardation caused by chronic maternal undernutrition in the rat: effects on the somatotrophic axis and postnatal growth. J Neuroendocrinol 150, 231–242. [DOI] [PubMed] [Google Scholar]
- Yang Z‐Z, Tschopp O, Hemmings‐Mieszczak M, Feng J, Brodbeck D, Perentes E & Hemmings BA (2003). Protein kinase Balpha/Akt1 regulates placental development and fetal growth. J Biol Chem 278, 32124–32131. [DOI] [PubMed] [Google Scholar]
- Yung H‐w, Calabrese S, Hynx D, Hemmings BA, Cetin I, Charnock‐Jones DS & Burton GJ (2008). Evidence of placental translation inhibition and endoplasmic reticulum stress in the etiology of human intrauterine growth restriction. Am J Pathol 173, 451–462. [DOI] [PMC free article] [PubMed] [Google Scholar]
- Yung HW, Cox M, Tissot van Patot M & Burton GJ (2012). Evidence of endoplasmic reticulum stress and protein synthesis inhibition in the placenta of non‐native women at high altitude. FASEB J 26, 1970–1981. [DOI] [PMC free article] [PubMed] [Google Scholar]
- Zamudio S (2003). The placenta at high altitude. High Alt Med Biol 4, 171–191. [DOI] [PubMed] [Google Scholar]
- Zhang S, Regnault TR, Barker PL, Botting KJ, McMillen IC, McMillan CM, Roberts CT & Morrison JL (2015). Placental adaptations in growth restriction. Nutrients 7, 360–389. [DOI] [PMC free article] [PubMed] [Google Scholar]
- Zhou J, Xiao D, Hu Y, Wang Z, Paradis A, Mata‐Greenwood E & Zhang L (2013). Gestational hypoxia induces preeclampsia‐like symptoms via heightened endothelin‐1 signaling in pregnant rats. Hypertension 62, 599–607. [DOI] [PMC free article] [PubMed] [Google Scholar]
- Zhu MJ, Du M, Hess BW, Nathanielsz PW & Ford SP (2007). Periconceptional nutrient restriction in the ewe alters MAPK/ERK1/2 and PI3K/Akt growth signaling pathways and vascularity in the placentome. Placenta 28, 1192–1199. [DOI] [PubMed] [Google Scholar]
- Zhu MJ, Du M, Nijland MJ, Nathanielsz PW, Hess BW, Moss GE & Ford SP (2009). Down‐regulation of growth signaling pathways linked to a reduced cotyledonary vascularity in placentomes of over‐nourished, obese pregnant ewes. Placenta 30, 405–410. [DOI] [PMC free article] [PubMed] [Google Scholar]
Associated Data
This section collects any data citations, data availability statements, or supplementary materials included in this article.
Supplementary Materials
Table S1. Maternal biometry, haematocrit and concentrations of blood glucose and plasma hormones Maternal biometry, haematocrit and concentrations of blood glucose and plasma hormones on D16 and D19 of pregnancy in normoxic dams (21% atmospheric O2 content); hypoxic dams exposed for 5 days either to 13% O2 from D11 to D16 or D14 to D19 or to 10% O2 from D14 to D19; and normoxic dams pair‐fed to the food intake of the 13% H dams from D11 to D16 or of the 10% H dams from D14 to D19.