

Abstract
New genes contribute substantially to adaptive evolutionary innovation, but the functional evolution of new mammalian genes has been little explored at a broad scale. Previous work established mRNA-derived gene duplicates, known as retrocopies, as models for the study of new gene origination. Here we combine mammalian transcriptomic and epigenomic data to unveil the processes underlying the evolution of stripped-down retrocopies into complex new genes. We show that although some robustly expressed retrocopies are transcribed from preexisting promoters, most evolved new promoters from scratch or recruited proto-promoters in their genomic vicinity. In particular, many retrocopy promoters emerged from ancestral enhancers (or bivalent regulatory elements) or are located in CpG islands not associated with other genes. We detected 88–280 selectively preserved retrocopies per mammalian species, illustrating that these mechanisms facilitated the birth of many functional retrogenes during mammalian evolution. The regulatory evolution of originally monoexonic retrocopies was frequently accompanied by exon gain, which facilitated co-option of distant promoters and allowed expression of alternative isoforms. While young retrogenes are often initially expressed in the testis, increased regulatory and structural complexities allowed retrogenes to functionally diversify and evolve somatic organ functions, sometimes as complex as those of their parents. Thus, some retrogenes evolved the capacity to temporarily substitute for their parents during the process of male meiotic X inactivation, while others rendered parental functions superfluous, allowing for parental gene loss. Overall, our reconstruction of the “life history” of mammalian retrogenes highlights retroposition as a general model for understanding new gene birth and functional evolution.
In addition to mutations that alter sequences or activities of preexisting genes (Necsulea and Kaessmann 2014), new genes with novel functions are thought to have substantially contributed to phenotypic evolution (Kaessmann 2010; Chen et al. 2013). Several paths toward the “birth” of new genes have been documented, including duplication of ancestral genes, de novo origination, transmutation of protein-coding genes into RNA genes, horizontal gene transfer, and domestication of transposable elements (Kaessmann 2010; Long et al. 2013). Overall, new genes have profoundly influenced the evolution of physiological, morphological, behavioral, and reproductive phenotypic traits (Zhang et al. 2002; Dai et al. 2008; Park et al. 2008; Parker et al. 2009).
A major mechanism providing raw material for new gene origination is gene duplication (Kaessmann et al. 2009; Kaessmann 2010). New gene copies can emerge through DNA-mediated mechanisms (duplication of chromosomal segments) but also through the process of retroposition (retroduplication), where RNAs are reverse-transcribed into DNA and inserted into the genome (Kaessmann et al. 2009). This process, which in mammals is accomplished by the LINE-1 retrotransposon machinery (Esnault et al. 2000), typically generates gene copies (retrocopies) devoid of introns and promoters, which were previously generally dismissed as nonfunctional “processed pseudogenes” (Mighell et al. 2000; Zhang et al. 2003). However, following early anecdotal findings of retrocopies that evolved into bona fide genes (retrogenes) (e.g., McCarrey and Thomas 1987), a surprisingly large number of retrogenes were discovered, especially in mammals and fruitflies (Betrán et al. 2002; Emerson et al. 2004; Vinckenbosch et al. 2006; Potrzebowski et al. 2008). These studies showed that retrogenes may serve as unique models for the analysis of new gene origination and evolution (Kaessmann et al. 2009).
First, given that retrocopies initially represent intronless versions of parental transcripts, any promoters and novel exons will evolve de novo or be recruited from the genomic environment of the insertion site. This implies that retrocopies are likely to evolve new functional roles and that the stepwise evolution toward a fully fledged new functional gene can be studied in detail. Second, the directionality of the retroduplication process (from intron-containing parent to intronless retrocopy) and the large numbers of retrocopies produced render the analysis of these loci straightforward. Furthermore, to illuminate signatures of selection and functionality of retrogenes, their sequences and expression patterns can be contrasted with those of their parents and their nonfunctional counterparts: retropseudogenes. Notably, other modes of new gene formation are not equally suited for studying the evolution of new complex genes. For example, segmental duplication regularly produces daughter copies that inherit all or most genetic features (exons, introns, and regulatory elements) of the ancestral gene, and there is no clear directionality in the duplication process (Kaessmann et al. 2009). The de novo emergence of genes from nonfunctional genomic sequences represents another intriguing mechanism of new gene origination, where all functional genic elements need to evolve from scratch (Kaessmann 2010; Tautz and Domazet-Lošo 2011). However, the detection of such genes is challenging, and the contribution of de novo origination to the emergence of new mammalian genes remains unclear (Guerzoni and McLysaght 2011).
Retrogene studies have unveiled several mechanisms that facilitate the birth of new genes. For example, they revealed potential sources of regulatory sequences (Bai et al. 2008; Okamura and Nakai 2008; Fablet et al. 2009; Sorourian et al. 2014), mechanisms underlying the evolution of novel gene structures (Fablet et al. 2009), and specific tissues that might facilitate the formation of new genes (Vinckenbosch et al. 2006). Previous work also unraveled novel mechanisms of how newly established genes evolve novel functional roles (e.g., subcellular relocalization of encoded proteins) (Marques et al. 2008; Rosso et al. 2008a,b). Moreover, retrogenes and retrocopies served as evolutionary markers and archives of chromosomal “gene movements” (Emerson et al. 2004), sex chromosome origins (Potrzebowski et al. 2008), transcript isoforms (Shemesh et al. 2006; Huang et al. 2008; Podlaha and Zhang 2009), and parental gene expression (Zhang et al. 2003; Abyzov et al. 2013). Nevertheless, due to the lack of suitable genome-scale functional data, the potential of retrogene analyses for understanding new gene origination has so far been rather poorly exploited, and many findings have remained anecdotal in nature.
In this study, we use extensive RNA sequencing (RNA-seq) data for representatives of the three major mammalian lineages in conjunction with other genome-scale functional genomics data to trace, for the first time at a broad scale, the evolution of simple retrocopies toward complex and functional genes. Our results reveal general rules and patterns governing the birth and functional evolution of new genes. They illuminate, in particular, the regulatory and structural requirements associated with the emergence of new gene functions.
Results
Annotation and transcriptional profiling of retrocopies in 10 species
To investigate the dynamics of retrogene origins and evolution, we annotated retrocopies in the genomes of nine mammals and one bird (human, chimpanzee, gorilla, orangutan, macaque, mouse, rat, opossum, platypus, chicken) by searching for gene duplicates devoid of the parental introns using a dedicated pipeline (Methods; Supplemental Methods). We identified several thousand retrocopies in each of the primate, rodent, and marsupial (collectively referred to as therian) genomes (Fig. 1A; Supplemental Table S1). Most of these show low divergence at synonymous sites compared with their parental gene (dS ∼ 0.1) (Supplemental Fig. S1; Supplemental Table S1), suggesting that they emerged relatively recently during mammalian evolution (Marques et al. 2005; Pan and Zhang 2009). In contrast, we found fewer retrocopies in the genomes of platypus and chicken, consistent with the lack of LINE-1 activity in these lineages (Hillier et al. 2004; Warren et al. 2008; Kaessmann et al. 2009). These retrocopies likely derive from ancient retroposition events, as indicated by their high synonymous divergence (dS > 2) (Supplemental Fig. S1).
Figure 1.

Expression profiles of mammalian retrocopies. (A, left) Phylogenetic relationships and divergence times (in million years) of the investigated species. (Right) Numbers of annotated retrocopies (gray bars), retrocopies with evidence of expression (one or more unique reads; light blue bars), and retrocopies with robust expression (≥1 FPKM; dark blue bars). (B) Proportions of robustly expressed retrocopies with tissue-specific (TSI ≥ 0.4) or broad (TSI < 0.4) expression. (C) Mean expression levels across six organs for robustly expressed retrocopies and annotated protein-coding genes. Human and mouse retrocopies were subdivided into two age classes based on their dS. As most platypus and chicken retrocopies have high dS values, no age distinction was performed. Significant differences (Mann-Whitney U test with Benjamini-Hochberg correction): (***) P < 0.001; (n.s.) P > 0.05. Whiskers up to 1.5 times the interquartile range; outliers removed for graphical purposes.
Gain of expression is the first step in the evolution of a recently inserted retrocopy into a functional retrogene. Based on RNA-seq data from six organs (Brawand et al. 2011; Cortez et al. 2014; Necsulea et al. 2014), we identified expressed retrocopies and carefully reconstructed their transcripts in each species (Methods). Most retrocopies show evidence of transcription (Fig. 1A; Supplemental Table S2), and a sizeable number allow for transcript reconstruction and show robust expression levels (FPKM > 1) (Methods; Fig. 1A; Supplemental Table S3). As previously observed (Vinckenbosch et al. 2006), the testis is characterized by the highest number of expressed retrocopies in all species (Supplemental Fig. S2), which is likely, at least partly, related to the transcriptional promiscuity in this organ (Soumillon et al. 2013). However, large numbers of retrocopies are expressed also in somatic organs (Fig. 1B; Supplemental Fig. S2). In therians, robustly expressed retrocopies show lower expression than protein-coding genes (Fig. 1C; Supplemental Fig. S3; Supplemental Data), while transcriptional profiles of platypus and chicken retrocopies are similar to those of protein-coding genes (Fig. 1C; Supplemental Fig. S3), likely due to their more ancient origin (Supplemental Fig. S1). Consistent with this notion, old therian retrocopies (dS > 2) have expression levels similar to those of annotated protein-coding genes (Fig. 1C).
Retrocopies with active promoters
Given that retrocopies are typically expected to lack the parental promoter, we next explored mechanisms underlying retrocopy transcription. We first assessed to what extent retrocopy expression stems from active regulation rather than spurious transcription, based on mouse chromatin immunoprecipitation sequencing (ChIP-seq) data (Shen et al. 2012) for trimethylation of histone H3 at lysine 4 (H3K4me3), a chromatin mark characteristic of active promoters (Methods; Supplemental Data; Heintzman et al. 2007). While only 0.9% of nonexpressed (no unique reads) and 5.4% of lowly expressed (FPKM < 1) mouse retrocopies were associated with an H3K4me3 peak at their transcriptional starts sites (TSSs), we found evidence of active promoters for 51.4% of robustly expressed retrocopies (FPKM > 1; P < 10−16; χ2 test) (Supplemental Table S4), as well as a significant association between expression profiles and the presence of H3K4me3 peaks across tissues (Benjamini-Hochberg-corrected P < 10−11 in all organs, χ2 test). These analyses strongly suggest that the transcription of robustly expressed retrocopies is actively regulated, while low-level retrocopy expression may represent transcriptional noise.
Sources of retrocopy promoters: recruitment from parents or other genes
Several genomic sources could contribute promoters that regulate retrocopy expression (Kaessmann et al. 2009). To investigate the extent to which retrocopy promoters are inherited from the parent (contrary to the common expectation), are acquired from neighboring genes, or evolve as novel promoters, we compiled a set of high-confidence upstream regions by defining the precise TSS of 230 human and 243 mouse robustly expressed retrocopies based on cap analysis of gene expression (CAGE) data (Supplemental Table S4; The FANTOM Consortium and the RIKEN PMI and CLST (DGT) 2014).
We first identified cases where the region upstream of the retrocopy TSS could be aligned to the parental locus (Methods; Supplemental Methods), as would be expected if the retroposed parental mRNA was transcribed from an upstream alternative promoter, leading to the inclusion of downstream regulatory elements in the retrocopy (Fig. 2A,B; Okamura and Nakai 2008; Shiao et al. 2008; Kaessmann et al. 2009). We detected parent-derived upstream sequences for six human and seven mouse retrocopies (Fig. 2I; Supplemental Table S4). These retrocopies have a wide age distribution (dS between 0.08 and 0.39), suggesting that the rapid decrease in sequence similarity for noncoding regions did not substantially hamper our ability to recognize these events, although highly diverged cases may nevertheless have escaped detection. Our analysis therefore indicates that a relatively small fraction (∼3%) of expressed retrocopies inherited a promoter from their parental gene.
Figure 2.

Mechanisms of retrocopy promoter acquisition. Schematic representations (A,C,E,G) and examples (B,D,F,H) of retrocopy promoter gain mechanisms. In A,C,E,G, the gene structures are depicted as thick boxes (coding exons/exon parts), thin boxes (UTRs), and connecting lines (introns). In A,C,E,G, the upper part shows the genomic locus before (A,C,E) or upon (G) the retrocopy integration; the lower part shows the locus after the gain/recruitment of the retrocopy promoter. B,D,F,H show (from top to bottom) the RNA-seq coverage (all reads from all samples); the location of CAGE peaks; the assembled retrocopy transcript(s), with exons defined by blue boxes and introns as blue lines; and the original retrocopy locus (coding part). (A) A parental gene transcript generated from an upstream promoter carries an alternative downstream promoter from which the retrocopy will be expressed. (B) The hsa_retrop24247 human retrocopy promoter corresponds to a parentally inherited sequence (thin black box), suggesting that an alternative parental promoter was present in the retrotransposed mRNA. (C) Retrocopy integration into a host gene and generation of a chimeric transcript through splicing. (D) The mus_retrop52885 mouse retrocopy (Taf9) expresses three alternative chimeric transcripts containing exons of its host gene Ak6. The three isoforms are generated by alternative transcription start sites as indicated by the presence of multiple CAGE peaks. (E) Retrocopy expression driven by the bidirectional promoter of an upstream gene. (F) The hsa_retrop09498 (HTR7P1) human retrocopy promoter has been recruited from the neighboring gene HEBP1. (G) Retrocopy integration in proximity to a proto-promoter sequence, which will evolve as a novel retrocopy promoter. (H) The hsa_retrom15096 (SEPHS2) human retrocopy promoter overlaps a CpG island (purple box) not associated to any other gene, indicating that this sequence has been recruited or evolved as a putative novel promoter. (I) Relative contribution of promoter acquisition mechanisms in human and mouse retrocopies.
Next, we assessed to which extent retrocopies “piggyback” on the promoters of neighboring genes (Fablet et al. 2009; Gotea et al. 2013; Ghanbarian and Hurst 2015). We identified 13 human and 14 mouse retrocopies that integrated within the introns of another gene and became expressed as new chimeric transcripts together with the upstream exons of the host gene (Fig. 2C,D; Supplemental Table S4). Additionally, 11 human- and 12 mouse-expressed retrocopies were located within 2 kb of another protein-coding gene in a head-to-head orientation (Fig. 2E,F; Supplemental Table S4), suggesting that preexisting bidirectional promoters have facilitated their expression. The sharing of the same proximal promoter between these retrocopies and their upstream genes is further confirmed by their higher levels of coexpression (Pearson's r = 0.59 in human, 0.61 in mouse) compared with those measured between randomly chosen gene pairs (−0.10 human, −0.14 in mouse; Mann-Whitney U test, P < 0.05 in both species). Thus, we find evidence of promoter piggybacking for ∼11% of the expressed retrocopies in human and mouse.
Sources of retrocopy promoters: de novo evolution and origination from proto-regulatory elements
After subtracting the cases where promoters were inherited from the parental gene or shared with neighboring genes, ∼86% of all retrocopy promoters remained, suggesting that the majority of retrocopies gain expression through the evolution and/or recruitment of novel regulatory elements (Fig. 2G–I; Supplemental Table S4). Many of these novel promoter regions overlap with CpG islands (Illingworth et al. 2010) that were not associated to other protein-coding genes or long noncoding RNAs (Methods). We could associate 51.5% of novel retrocopy promoters with CpG islands in human (103/200; 5.7-fold enrichment relative to nonexpressed or lowly expressed retrocopies, P < 10−15, χ2 test) (Supplemental Table S4) and 34.8% in mouse (73/210; 3.9-fold enrichment, P < 10−15). The role of CpG islands as active promoters is further supported by the enrichment of H3K4me3 marks at mouse retrocopy-associated CpG islands relative to other CpG islands not associated to other genes (1.7-fold enrichment, P < 10−10, Fisher's exact test) (Supplemental Table S4), as well as the enrichment of CpG island–associated transcription factor binding sites (e.g., Sp1, NRF1 and E2 motifs) (Deaton and Bird 2011) in the promoter regions of expressed retrocopies in both species (Supplemental Table S5). Promoters associated with CpG islands tend to drive broader expression patterns compared with other promoter types (Supplemental Fig. S4), in agreement with previous observations (Fablet et al. 2009). Together, our results suggest a substantial contribution of CpG islands to retrocopy expression regulation. These elements may have been present as proto-promoter elements with regulatory capacities in the genome prior to retrocopy insertion or may have evolved de novo in concert with retrocopies and their functions. Interestingly, CpG islands contributed differently to retrocopy expression in human and mouse (51.5% vs. 34.8%, P < 10−3, χ2 test) despite the similar numbers of CpG islands detected in these genomes (Illingworth et al. 2010), highlighting that the mechanisms through which retrocopies gain expression can vary between species.
We next explored to what extent retrocopy promoters may have been derived from other proto-promoters (sequences displaying promoter-like characteristics prior to retrocopy insertion). It has recently become apparent that enhancers and promoters share many key properties (Core et al. 2014; Andersson et al. 2015). We therefore speculated that enhancers, or enhancer-like elements (see Discussion), might have been co-opted as retrocopy promoters during evolution.
To test our hypothesis, we analyzed ChIP-seq data from matched mouse tissues for two enhancer-associated chromatin marks, monomethylation of histone H3 at lysine K4 (H3K4me1) (Heintzman et al. 2007) and acetylation of histone H3 at lysine 27 (H3K27ac) (Creyghton et al. 2010). We reasoned that if some enhancers serve as proto-promoters and if these enhancers are relatively stable over evolutionary time, we should see an enrichment of H3K4me1 and H3K27ac marks in putative mouse proto-promoters, namely, those regions of the mouse genome that correspond to the current promoters of rat-specific retrocopies (Fig. 3A; Supplemental Data).
Figure 3.

Enhancer-derived retrocopy promoters. (A, top) The integration loci of rat-specific robustly expressed (dark blue box) and not expressed (light blue box) retrocopies are mapped on the mouse genome (dotted lines). Mouse ChIP-seq reads are extracted from the regions surrounding the orthologous integration sites, indicated in yellow. (Bottom) Mouse H3K4me1 and H3K27ac mean per-base ChIP-seq coverage measured at the orthologous integration sites of rat-specific retrocopies. Significant differences (Mann-Whitney U test with Benjamini-Hochberg correction): (***) P < 0.001. Whiskers up to 1.5 times the interquartile range; outliers removed for graphical purposes. (B) Co-option of the rat-specific retrocopy rno_retrom02909 promoter from an enhancer element. (Top) H3K4me1 (red) and H3K4me3 (purple) ChIP-seq profiles from mouse heart. (Middle) Representation of the rat rno_retrom02909 retrocopy locus and its syntenic mouse region. The original integration locus is indicated by dotted lines. The blue box represents the assembled transcript. The red box, indicating the heart-specific mouse enhancer, is found upstream of the integration locus of the retrocopy and corresponds to its actual promoter region, shown in purple. Both the mouse enhancer and the rat promoter regions correspond to ChIP-seq peaks defined in this study (enhancer) or obtained from Rintisch et al. (2014). (Bottom) H3K4me3 ChIP-seq (purple) and RNA-seq (blue) profiles from rat heart. H3K4me3 coverage obtained from the sample “lv-H3K4me3-BXH06-male-bio1-tech1” from Rintisch et al. (2014).
Indeed, we found that both enhancer marks were preferentially associated with putative mouse proto-promoter regions compared with mouse sequences corresponding to the integration regions of nonexpressed rat-specific retrocopies (Benjamini-Hochberg-corrected Mann-Whitney U test, P < 10−3) (Fig. 3A). The enrichment remained after accounting for the input read count (P < 10−10, χ2 test) (Methods; Supplemental Fig. S5). Notably, putative mouse proto-promoters are not enriched for H3K4me3 or RNA polymerase II (Pol II) marks after input normalization (Supplemental Fig. S5), suggesting a lack of promoter activity prior to the retroposition event. To estimate the number of rat-specific retrocopies with promoters derived from enhancer-like sequences, we evaluated the presence of H3K4me1 and H3K27ac ChIP-seq peaks at putative mouse proto-promoters (Methods; Supplemental Data). We found that 12% of the mouse proto-promoter regions overlapped H3K4me1 or H3K27ac peaks, in contrast to the 3% (H3K4me1) and 4% (H3K27ac) overlap found at mouse loci orthologous to the integration sites of nonexpressed rat-specific retrocopies (Benjamini-Hochberg-corrected Fisher's exact test, P = 0.012 for H3K4me1; P = 0.047 for H3K27ac), suggesting that at least 8%–9% of rat-specific retrocopy promoters evolved from enhancers or their evolutionary precursors (Discussion). Strikingly, by using H3K4me3 data for rat heart (Rintisch et al. 2014), we identified a rat heart-specific retrocopy with a clear H3K4me3 promoter signal whose corresponding mouse sequence is enriched for the H3K4me1 enhancer mark but lacks an H3K4me3 signal (Fig. 3B). This demonstrates that one type of regulatory element can transform into the other, or, alternatively, that the two different types can evolve from a common evolutionary (potentially bivalent) precursor sequence. Overall, these results support our hypothesis that preexisting enhancer-like elements can promote the expression of newly integrated retrocopies in their vicinity.
The emergence of functional retrogenes
While expression is a prerequisite in the transition from nonfunctional retrocopy to functional retrogene, it is not in itself evidence of functionality. Next, we therefore identified putative retrogenes in our sets of retrocopies by searching for signatures of purifying selection in their coding sequences, indicative of protein functionality. To this end, we clustered the set of retrocopies into 3900 orthologous families, of which 613 represent intact families (11–502 per species), meaning that the parentally inherited coding sequences of the included retrocopies were not disrupted through frameshift or nonsense mutations (Methods; Supplemental Table S6). To test marsupial-specific retrocopy families, we also annotated retrocopies from wallaby and Tasmanian devil (Supplemental Table S1) and used them together with our annotations from opossum to define a set of 52 marsupial-specific intact retrocopy families (Supplemental Table S6).
For the 665 intact retrocopy families, we assessed signals of purifying selection based on nonsynonymous and synonymous substitution rates (Yang 2007), as well as probabilities of conservation of intact open reading frames (Methods; Dupanloup and Kaessmann 2006). We thus identified 271 putatively functional protein-coding retrogene families (Fig. 4A). In addition, we screened for signatures of purifying selection in retrocopies that are species specific or that were not included in orthologous clusters (Methods). In total, we identified between 194 and 280 selectively preserved retrogenes in each therian species, 88 in platypus, and 36 in chicken (Supplemental Table S7). These numbers represent lower bounds, since our analyses have limited statistical power to detect young retrogenes and do not allow the retrieval of noncoding retrogenes. Even so, our results show that retroposition makes a sizeable contribution to genomic innovation across mammals.
Figure 4.

“Out of testis” and “out of X” patterns. (A) Number of retrogene families specific of each clade indicated on the respective branch. (PRM) Retrogenes specific to primates (excluding great ape–specific ones), rodents, or marsupials. (B) Tissue specificity index (TSI) distribution of retrogene families (median TSI of each family) from different evolutionary age categories. Significant differences (Kolmogorov-Smirnov test with Benjamini-Hochberg correction): (***) P < 0.001; (*) P < 0.05. (C) Proportions of retrogenes with tissue-specific (TSI ≥ 0.5) or broad (TSI < 0.5) expression for different age categories. (D) Expression levels of chicken orthologs of parental genes of “out of X” retrogenes (yellow), “out of X” parental genes (orange), and combined expression of “out of X” retrogenes and parental genes (blue) in human (19 retrogenes) and mouse (23 retrogenes). Retrogenes compensate for the significant decrease in parental gene expression only in testis. Significant differences (Wilcoxon signed-rank test with Benjamini-Hochberg correction): (***) P < 0.001; (**) P < 0.01; (n.s.) P > 0.05. (E) dN/dS ratios between “out of X” and “autosome to autosome” (“A to A”) retrogenes in human and mouse. Significant differences (Mann-Whitney U test with Benjamini-Hochberg correction): (*) P < 0.05. Whiskers up to 1.5 times the interquartile range; outliers are removed for graphical purposes.
Novel support for the ‘out of testis’ scenario of new gene origination
The “out of testis” hypothesis (for review, see Kaessmann et al. 2009) suggests that most retrogenes initially evolve functional roles in testis, facilitated by a permissive chromatin environment that promotes transcription (Soumillon et al. 2013), and later evolve broader expression patterns (Vinckenbosch et al. 2006). Previously, only sparse expression data were available to test this hypothesis, and we therefore used our extensive expression data to analyze retrogene families of different ages, with the aim to detect potential evolutionary expression shifts. We found that the proportions of broadly expressed retrogene families increase with increasing family age (Fig. 4B,C), while proportions of testis-specific genes decrease (testis- vs. nontestis-specific expression P < 10−3, Fisher's exact test) (Fig. 4C).
We also considered an alternative scenario in which the overall enrichment of young testis-specific retrogenes is explained by the specific loss of such genes during evolution or by the selective preservation of young retrogenes with broad expression patterns. However, we could not detect any lineage-specific loss of retrogenes from testis-specific retrogene families (Supplemental Methods). Overall, our data lend new support for the original “out of testis” hypothesis, although it remains possible that other forces contributed to some degree to the observed pattern.
Refinement of the ‘out of X’ hypothesis of new gene emergence
The “out of X” pattern, where genes on the X Chromosome are especially prone to give rise to autosomal retrogenes (Emerson et al. 2004; Potrzebowski et al. 2008), is clearly visible in our data (e.g., for human, 34 vs. about eight expected, P < 10−20, χ2 goodness-of-fit test) (Methods; Supplemental Table S8). It was previously suggested that the “out of X” effect stems from selection on autosomal retrogenes to functionally replace their X-linked parents (Bradley et al. 2004; Potrzebowski et al. 2008), which are silenced during male meiosis due to male meiotic sex chromosome inactivation (MSCI) (Turner 2007) and its post-meiotic aftermath (McCarrey and Thomas 1987; Emerson et al. 2004). However, contrary to previous observations based on microarray data (Potrzebowski et al. 2008), our analysis of testicular RNA-seq data (Soumillon et al. 2013) shows that X-derived retrogenes do not have higher spermatocyte/spermatid expression than retrogenes derived from autosomes (Supplemental Figs. S6, S7).
We thus sought to obtain new global support for the MSCI-driven scenario. We reasoned that if the role of “out of X” retrogenes was to compensate for the meiotic silencing of their parents, these copies should restore expression of their parents in meiotic and post-meiotic cells to the same level as before the evolutionary emergence of MSCI. We thus inferred ancestral expression levels for therian X-linked genes based on their autosomal orthologs in chicken, which has a different sex chromosome system (Methods; Julien et al. 2012; Cortez et al. 2014). Whole-testis expression levels were used as a proxy for spermatocyte/spermatid expression (Soumillon et al. 2013). We found that the current combined testis expression output of retrogenes and their parents is statistically indistinguishable from the inferred ancestral expression, demonstrating that retrogenes can fully compensate for silencing due to MSCI (Fig. 4D; Supplemental Fig. S8; Supplemental Table S9). Notably, this trend is not observed in autosome-derived retrogenes located on autosomes, which, instead, tend to overcompensate the parental output in this organ (Supplemental Fig. S9).
We further reasoned that if X-derived retrogenes functionally replace their parents during MSCI, they should be subject to stronger purifying selection compared with autosome-derived retrogenes, which would be more prone to evolve novel protein functions. Indeed, coding sequences of “out of X” retrogenes are generally more conserved than those of other retrogenes (Fig. 4E; Supplemental Fig. S10; Supplemental Table S10), in agreement with our hypothesis. Overall, these observations lend strong novel support to the hypothesis that MSCI represents the major driving force underlying the “out of X” retroduplication pattern.
The rapid and frequent origination of new gene structures
Although retrogenes originate as monoexonic copies of their parental gene, some retrogenes that evolved new multiexonic structures have been reported (Wang et al. 2002; Fablet et al. 2009). Retrogenes thus represent an excellent model system to study the origin of new, potentially functional gene structures. Remarkably, we recovered multiexonic transcripts for 25%–53% of all expressed retrogenes (Methods; Table 1; Fig. 5A; Supplemental Table S11). While some retrogenes became multiexonic due to intronization (gain of splice sites within a parentally derived exon), most multiexonic retrogenes instead gained new exons from their upstream (75%–93% in all species) or downstream (18%–40%) flanking sequences (Table 1). The overrepresentation of novel 5′ exons suggests that they served to place retrocopies under the control of a distal promoter, favoring their evolution into functional retrogenes (Fablet et al. 2009), but might also reflect selection against novel 3′ UTR exons that may elicit nonsense-mediated RNA decay (Isken and Maquat 2008).
Table 1.
Features of vertebrate retrogenes
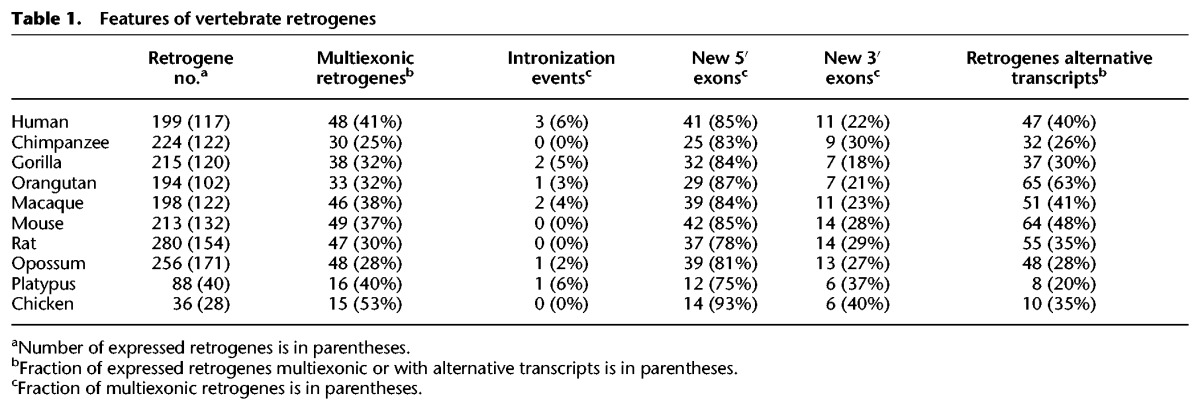
Figure 5.

Structural evolution of retrogenes. (A) Transcript structure of the human retrogene hsa_retrop25503 (NXT1) shows the emergence of a new 5′ exon. Black box depicts the original retrocopy locus (coding part). (B) Fractions of human monoexonic and multiexonic (only new 5′ exons) retrogene families from different evolutionary age categories. Significant differences (Fisher's exact test with Benjamini-Hochberg correction): (***) P < 0.001; (n.s.) P > 0.05. (C) Tissue specificity of human monoexonic and multiexonic (only new 5′ exons) retrogenes. The violin plots indicate retrogene TSI distribution; TSI of each retrogene is indicated by colored (when TSI ≥ 0.4, representing tissue with highest expression) or gray (TSI < 0.4) dots. (D, top) Fraction of unique read counts (normalized by the number of reads mapped on the whole gene) from each organ mapping on the human HNRNPF. Exon 1 is significantly more highly transcribed in testis (DEXSeq analysis, Benjamini-Hochberg-corrected P < 0.01). Color code as in C. (Bottom) exon structure (black) and alternative transcripts (gray) of the HNRNPF gene.
Around 20% of young human retrogenes have a nonparental 5′ exon, suggesting that such exons can be rapidly acquired (Fig. 5B), but there is also an ongoing accumulation of complex gene structures, resulting in >80% of ancient retrogenes being multiexonic (Fig. 5B). Multiexonic retrogenes have substantially broader expression patterns than monoexonic ones in therian species (Fig. 5C; Supplemental Fig. S11), while monoexonic retrogenes tend to be more testis specific (Fig. 5C), consistent with previous work (Fablet et al. 2009). Together with the finding that retrogene expression patterns broaden during evolution (Fig. 4B,C), this suggests that both novel gene structures and evolutionary time contribute to the “out of testis” pattern by allowing for the evolution of increased regulatory complexity (Discussion).
The emergence of alternative isoforms
Alternative processing of retrogenes has so far been reported only occasionally (Lahn and Page 1999; Szcześniak et al. 2011). Remarkably, we observed alternative isoforms for 20%–63% of all robustly expressed retrogenes (Methods; Table 1). We detected distinct isoforms, generated by alternative splicing or usage of alternative transcription start/termination sites, for both mono- and multiexonic retrogenes (Supplemental Table S12). Notably, we identified about 24 retrogenes per therian species where isoform usage was differentially regulated across organs (Methods; Supplemental Table S12; Anders et al. 2012). One of these, the eutherian-specific retrogene HNRNPF, encodes one broadly expressed and one testis-specific isoform, as a result of alternative promoter usage in human (Fig. 5D), macaque, and mouse (Supplemental Fig. S12). Thus, retrogenes are not only processed in a more complex fashion than previously thought but may also have evolved functionally distinct isoforms.
Orphan retrogenes functionally replace their parents
As most retrogenes acquire novel regulatory elements, it is not surprising that they differ significantly from their parental genes in terms of gene expression (mean expression across six organs, Benjamini-Hochberg-corrected P < 0.001 in all species, Wilcoxon signed-rank test). This also implies that, in general, retrogenes and parental genes are not functionally equivalent. Nonetheless, we found 10 “orphan” retrogene families (Table 2) that lack functional parental genes in the same lineage (Methods) and may therefore be expected to carry out functions of extinct parental genes (Fig. 6A; Ciomborowska et al. 2013).
Table 2.
Orphan retrogenes
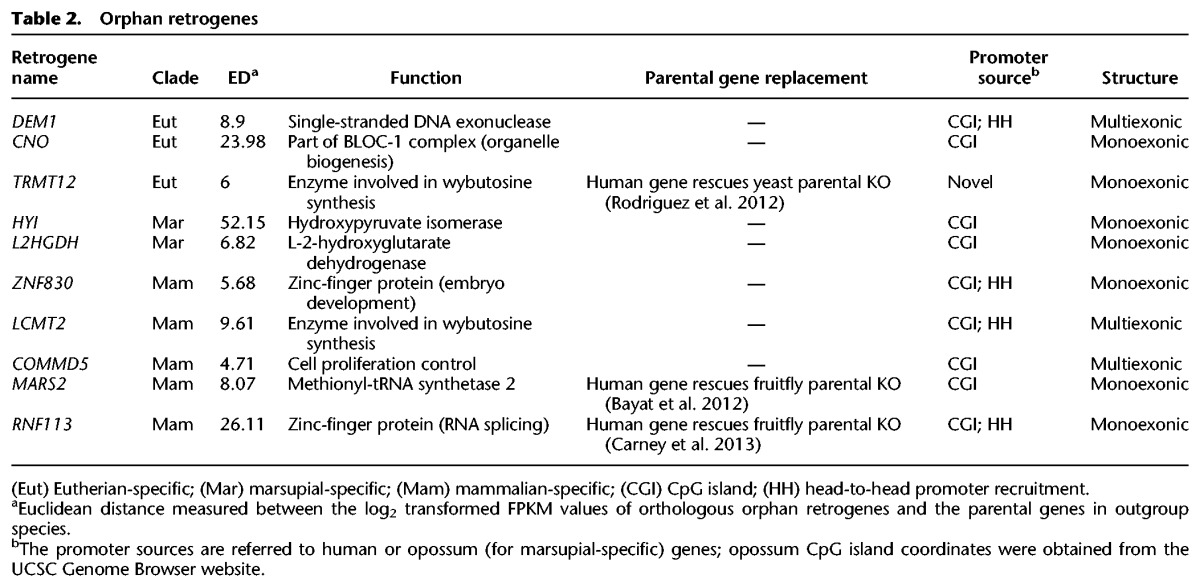
Figure 6.

Evolution of orphan retrogenes. (A) Orphan retrogenes are derived from a retroposition event followed by the pseudogenization of the parental gene. (B) Expression divergence between retrogenes and their parental genes, calculated as the Euclidean distance (ED) between the median expression levels across species for each of the six organs. Benjamini-Hochberg-corrected P-values obtained comparing EDs of orphan and other retrogenes with a Mann-Whitney U test. (C, top) Expression profile of the orphan retrogene RNF113 in different clades. For primates and rodents, the expression profiles represent median values across different species. Dark and light green bars indicate the expression levels from two independently originated RNF113 duplicates in primates and rodents, respectively. (B) brain; (C) cerebellum; (H) heart; (K) kidney; (L) liver; (T) testis. (Bottom) Reconstruction of the RNF113 retrogene evolution. Tree nodes indicated by squares correspond to gene duplication events (blue, retroposition; green, duplication mechanism not determined); other nodes correspond to speciation events. (D) Expression profile (median expression across species) of parental genes of orphan and nonorphan retrogenes and annotated protein-coding genes. Significant differences (Mann-Whitney U test with Benjamini-Hochberg correction): (**) P < 0.01; (*) P < 0.05; (n.s.) P > 0.05. Whiskers up to 1.5 times the interquartile range; outliers removed for graphical purposes.
To investigate the functions of orphan retrogenes, we contrasted their transcriptional profiles with those of outgroup orthologs of the lost parental genes (Supplemental Fig. S13; Supplemental Table S13). Compared with regular retrogenes, orphan retrogenes show less divergence relative to their parents (Fig. 6B), suggesting that orphans might indeed be functionally equivalent and thus carry out functions of extinct parents. Furthermore, we hypothesized that it might be easier for retrogenes to replace more lowly expressed parental genes, given that retrocopies need to acquire regulatory elements before achieving complex expression patterns. Consistent with this notion, we observed that parents of orphan retrogenes are more lowly expressed than parents of regular retrogenes (Fig. 6D). Notably, the gain of the broad expression profiles by nine out of 10 orphan retrogenes seems to have been facilitated by the evolution or recruitment of CpG island–associated promoters (Table 2).
One interesting example of parental replacement concerns the RNF113 gene (Fig. 6C; Supplemental Fig. S14). In this case, the parental gene was replaced by a ubiquitously expressed retrogene in the common ancestor of all mammals. Subsequently, a duplicate copy of the RNF113 retrogene reached fixation before the radiation of placental mammals. Probably this autosomal copy became necessary to allow expression of the RNF113 protein in the testis, since the original RNF113 retrogene was located on the newly emerged therian X Chromosome (Cortez et al. 2014) and therefore silenced by MSCI (Turner 2007). Finally, a new RNF113 copy replaced the autosomal retrogene copy in rodents. In both primates and rodents, the two RNF113 copies apparently subfunctionalized (Force et al. 1999) and display joint expression patterns that are similar to the inferred ancestral pattern of the parent, thus illustrating how offspring retrogenes can recapitulate ancestral expression patterns (functions), thereby allowing for the loss of the original genes.
Strikingly, we were able to retrieve experimental support for the predicted functional equivalence between orphans and parents for three human orphan retrogenes (Table 2). Specifically, these retrogenes were able to completely rescue the phenotype of knockout mutants for 1:1 orthologs of their parental genes in Drosophila (MARS2 [Bayat et al. 2012] and RNF113A [Carney et al. 2013]) or perform the same enzymatic process as the endogenous copy in yeast (TRMT12) (Rodriguez et al. 2012). These studies support a substantial functional overlap between orphan and parent, suggesting that new retrogenes can evolve to carry out fundamental and ancient cellular functions. Notably, the rescue experiments for RNF113A (the original mammalian RNF113 orphan retrogene) support the parental replacement scenario outlined above (Fig. 6C). Altogether, our study of mammalian retrogenes therefore covers all steps in the evolution of newly inserted retrocopies into fully fledged retrogenes that are functionally equipped to assume the role of regular protein-coding genes.
Discussion
Retroposition generates gene duplicates that have been stripped of their introns and regulatory elements. As a result, retrocopies are ideally suited to study how new genes evolve complex structures and regulatory features. Here, we have analyzed genomic, transcriptomic, and chromatin modification data to trace the life histories of mammalian retrogenes, thereby substantially advancing our understanding of the functional evolution of new genes.
To gain function, new retrocopies must first become expressed. We found that only a fraction of mammalian retrocopies gained expression through the use of preexisting promoters, while the majority of retrocopy promoters (potentially up to 86%) appear to be novel. The emergence of novel promoters may be influenced by the genomic context, as illustrated by the differential contributions of CpG islands to the expression of retrocopies in human and mouse. Moreover, at least 8%–9% of expressed retrocopies apparently recruited nearby regulatory elements, which function as enhancers in outgroup species, as promoters. This observation is consistent with recent work highlighting common functional and structural features shared by enhancers and promoters (Core et al. 2014; Andersson et al. 2015). It also suggests that enhancers and promoters may evolve from the same ancestral regulatory elements and/or that enhancers may “metamorphose” into promoters. Our findings are especially noteworthy in light of the rapid evolution of mammalian enhancers (Villar et al. 2015), which likely caused us to underestimate the degree to which retrocopy promoters are derived from enhancers or their multivalent evolutionary precursors. In any event, the presence of genetic elements that serve as proto-promoters appears to play a prominent role in the expression evolution of mammalian retrocopies.
Our analysis of functional retrogenes surprisingly revealed that ∼30% of mammalian retrogenes are multiexonic, and the structural complexity of these genes is therefore considerably greater than previously suspected (Long and Langley 1993; Fablet et al. 2009). The majority of new exons are located upstream and may contribute to the gain of functionality by connecting the retrocopy to regulatory regions in its vicinity (Fablet et al. 2009). Moreover, we observed the expression of multiple transcripts from >40% of mammalian retrogenes. Although some isoforms may represent transcriptional noise, we found evidence of conserved alternative isoforms with similar spatial expression profiles in a eutherian-specific retrogene (HNRNPF), indicating that alternative transcripts may allow retrogenes to expand their functional repertoires.
Together, our expression, promoter origin, and gene structure analyses support and refine the out of testis hypothesis of new gene evolution (Vinckenbosch et al. 2006), where young genes are predominantly testis specific, whereas older genes have broader expression profiles and functions. Our observations suggest a scenario in which the initial expression (and functionality) of a retrogene is usually facilitated by the permissive transcriptional landscape of the testis (Soumillon et al. 2013). Robust and/or more refined expression (function) in testis as well as in additional organs requires the optimization of its original regulatory machinery, the evolution of new promoters (sometimes from proto-promoters in their vicinity), and/or the recruitment of preexisting promoters from other genes. These events seem to be frequently facilitated by the evolution of new exon–intron structures, which may, for example, allow for the recruitment of distant (proto) promoters or the evolution of intronic regulatory elements (Fablet et al. 2009). Occasionally, retrocopies may also inherit parental promoters or recruit nearby preexisting (proto) promoters immediately or soon after their emergence, affording expression in other tissues than testis during their early evolution.
Our work also provides strong novel support for the hypothesis that X-derived retrogenes are able to functionally compensate for the silencing of their parents during and after meiosis (McCarrey and Thomas 1987; Emerson et al. 2004; Potrzebowski et al. 2008), by showing that retrogenes restore the ancestral (pre-MSCI) testis expression levels of their parents and that proteins encoded by X-derived retrogenes are particularly conserved. Thus, MSCI likely represents the major driving force behind the “out of X” pattern of retroduplication, although it remains possible that the fixation of individual X-derived retrogenes is due to other forces, such as conflicts in sexually antagonistic X-linked genes (Connallon and Clark 2011; Gallach and Betrán 2011; Parsch and Ellegren 2013). In addition, we note that in many species the combined expression output of X-derived retrogenes and parents is more similar to the ancestral expression output than the parents-only expression output in somatic organs. Although this trend is, for the most part, not statistically significant, it agrees with the suggestion that sex chromosome–derived retrogenes might provide a mechanism for dosage compensation to counteract the loss of expression on the decaying Y Chromosome (Hughes et al. 2015).
While most retrogenes coexist with their respective parental gene, the small class of orphan retrogenes (Ciomborowska et al. 2013; Kim et al. 2014) is characterized by the loss of the parent following the retroposition event. We show that orphan retrogenes recapitulate the expression of their respective parental genes remarkably well, indicating that they functionally replace the parent. Experimental rescue of the parental gene in outgroup model species, using human orphan retrogenes (Bayat et al. 2012; Rodriguez et al. 2012; Carney et al. 2013), further supports the functional equivalency between orphan retrogenes and their lost parental genes. Orphan retrogenes therefore constitute a unique system to study fundamental processes characterizing new gene evolution. As an example, further dissection of the novel regulatory elements that promote orphan gene expression should contribute to our understanding of how independently evolved regulatory machineries can produce similar transcriptional profiles.
In this work, we have thus mapped the life history of mammalian retrogenes, from initial insertion, via gain of regulatory elements and structural complexity, to complete integration into the functional networks of the cell, sometimes at the expense of the parent gene. Our work highlights the utility of retroduplication as a general model for understanding the origination and functional evolution of new genes. In particular, this process unites aspects of other mechanisms of new gene formation, namely, segmental duplication and de novo origination, given that it involves duplication of the exons of a preexisting gene, while requiring complex regulation to evolve de novo. Thus, all major insights obtained in our study—ranging from the regulatory and structural requirements associated with the emergence of complex new gene functions to general rules governing new gene origination and functional evolution—allow for key predictions regarding these but also other new gene origination mechanisms, such as the domestication of transposable elements (Kaessmann 2010), which is expected to follow similar evolutionary trajectories (Kordiš 2011; Kokošar and Kordiš 2013). It is noteworthy that with respect to segmental duplication, our results may in particular inform analyses of events that produce partial copies, which may lack certain genic elements such as promoters or UTRs. Such partial duplicates have frequently emerged in recent human/great ape evolution (Marques-Bonet et al. 2009), and it may be interesting to study the potential emergence of new functional genes from such copies in light of our observations.
Investigations of the precise functional contributions and phenotypic implications of individual retrogenes should prove a stimulating area of future research. To this end, an exploration of retrogene expression in additional organs, as well as during organismal development, will be critical. In addition, we expect that techniques enabling assessments of higher layers of gene expression and regulation (such as ribosome profiling [Ingolia et al. 2009] or mass spectrometry-based proteomics approaches [Cravatt et al. 2007]) will help to further clarify the biological importance of retrogenes, especially with regard to young retrogenes with testis-specific expression, as well as mechanisms underlying their functional evolution. Such investigations not only are of interest in terms of retrogene biology but also will further increase the usefulness of retrogenes as models of new gene evolution.
Methods
Retrocopy detection
We detected retrocopies in the genomes of human, chimpanzee, gorilla, orangutan, macaque, mouse, rat, opossum, Tasmanian devil, wallaby, platypus, and chicken using a refined version of our published approach (Marques et al. 2005). We dated retroposition events both by calculating the fraction of synonymous substitutions per synonymous site (dS) between the retrocopy and its parental gene and by looking for presence/absence of orthologous retrocopies in the 10 species analyzed (for details, see Supplemental Methods).
RNA-seq data
RNA-seq data were generated in our group (Brawand et al. 2011; Soumillon et al. 2013; Cortez et al. 2014; Necsulea et al. 2014) and comprised samples of brain (cortex or whole brain without cerebellum), cerebellum, heart, kidney, liver, and testis from all species (Supplemental Table S14). We additionally generated paired-end strand-specific RNA-seq data from orangutan testis (two sequencing experiments performed from the same cDNA library). The library was prepared using NEBNext RNA first-strand synthesis module (using Actinomycin D) and NEBNext ultra directional RNA second-strand synthesis module, and we performed two sequencing runs on the Illumina MiSeq platform. Reads were preprocessed by removing the last nucleotide at their 3′-end (artificially included by the protocol), and adaptors were trimmed using Skewer (Jiang et al. 2014).
Reconstruction of retrocopy transcripts and expression estimation
We mapped RNA-seq reads using TopHat2 (version 2.0.9) (Trapnell et al. 2009) on the genome and cDNA sequences (including our retrocopy loci and the annotated Ensembl genes not overlapping the retrocopies) of their respective species using the setting –read-realign-edit-dist 0 to allow the proper mapping of reads spanning the splice junctions of the parental genes. As evolutionarily young retrocopies show high similarity with their parental gene, the expression level estimation of both paralogs might be biased by the lack of RNA-seq reads mapping uniquely to either copy. Therefore, we kept only retrocopies with at least three uniquely and perfectly mapped reads in at least one RNA-seq sample. We then performed a genome-wide transcriptome reconstruction using Cufflinks version 2.1.1 (Trapnell et al. 2010) with all reads from all samples, and we redefined the boundaries of the assembled transcripts overlapping the filtered retrocopies by trimming the 5′ and 3′ portions having an RNA-seq coverage (based on all reads from all samples) below 10% of the average transcript coverage. We also removed the first/last exon from all transcripts with unsupported first/last splice junctions at their acceptor/donor sites and excluded transcripts with unsupported internal junctions. Finally, transcripts were integrated with the gene annotations from Ensembl and used to estimate gene expression levels from each sample with Cufflinks (using the –multi-read-correct option). All expression data (measured in FPKM) were normalized across organs and species based on our published approach (Brawand et al. 2011). We defined retrocopies as “robustly expressed” when their normalized expression level was higher than 1 FPKM in at least one organ and “showing evidence of expression” when at least one unique read mapped perfectly on their locus.
Tissue specificity
We calculated tissue specificity of a gene by dividing its maximum expression in one tissue by the sum of the expression across all tissues. This value, called tissue specificity index (TSI), for a set of n tissues ranged between 1/n (indicating equal expression in all tissues) and 1 (indicating expression in only one tissue).
ChIP-seq data
We retrieved mouse ChIP-seq data for H3K4me3, H3K4me1, H3K27ac, and Pol II, as well as input sequencing data from Shen et al. (2012) from brain, cerebellum, heart, kidney, liver, and testis (two replicates per organ). We extracted genome coverage data from the provided .bam files using SAMtools (version 0.1.18) (Li et al. 2009) and the BEDTools suite (version 2.17.0) (Quinlan and Hall 2010). ChIP-seq peaks were called using MACS (version 1.4.2.1) (Zhang et al. 2008) with default settings and input sequences as control. We considered only peaks (with a P-value <10−5) found in both biological replicates and defined their boundaries by merging overlapping peaks. H3K4me3 ChIP-seq peak coordinates from rat heart samples were obtained from Rintisch et al. (2014).
Promoter origin analysis
We identified TSSs of retrocopies in human and mouse based on CAGE data from The FANTOM Consortium and the RIKEN PMI and CLST (DGT) (2014). We then investigated the inheritance/recruitment of pre-existing promoters by evaluating the presence of parental sequences upstream of the retrocopy TSS (parental promoter inheritance), the integration of the retrocopy into gene models annotated in outgroup species (integration into host gene), or the integration of the retrocopy upstream and in divergent orientation to an annotated gene (head-to-head integration).
Retrocopy promoters that did not fit any of the aforementioned categories were considered putatively novel. We determined to what extent novel promoters were derived from unmethylated CpG islands defined by CAP-seq (CXXC affinity purification followed by deep sequencing) (Illingworth et al. 2010) and tested the presence of known or novel sequence motifs in the predicted novel promoters using HOMER (Heinz et al. 2010). Finally we tested the co-option of mouse enhancer elements as novel rat-specific retrocopy promoters. We identified rat-specific retrocopies, mapped their integration sites in mouse, and extracted H3K4me1, H3K27ac, H3K4me3, and Pol II ChIP-seq coverage, as well as the input sequencing coverage from the mouse regions surrounding the integration sites. We then compared the H3K4me1 and H3K27ac read coverage and input-normalized read counts between the syntenic integration loci of expressed and nonexpressed rat retrocopies. Finally, we evaluated the presence of H3K4me1/H3K27ac peaks in these regions by overlapping their genomic coordinates. For further details regarding promoter origin analyses, see Supplemental Methods.
Testing retrocopies for sequence conservation
We tested all intact retrocopy families for purifying selection using two distinct approaches. We performed a branch-model test implemented in codeml (Yang 2007) on each retrocopy family and evaluated whether the dN/dS estimated for the whole retrocopy clade was significantly lower than one. We further defined primate-specific retrocopies under purifying selection as those characterized by a low probability of accumulating open reading frame–disabling mutation after simulating their neutral evolution 10000 times with ReEVOLVER (Dupanloup and Kaessmann 2006). We also used the branch-model test on all retrocopies not grouped into multispecies orthologous families and included those with a dN/dS significantly smaller than one in the list of retrogenes. For details, see Supplemental Methods.
‘Out of X’ analysis
The selective “out of X” export was tested as described by Emerson et al. (2004). Chicken orthologs, used to estimate the ancestral expression of X-linked parental genes (Julien et al. 2012), were obtained from Ensembl (only one-to-one orthologs), and tissue expression comparisons were tested with a Wilcoxon signed-rank test. To test for different evolutionary pressures acting on the “out of X” and “autosome-to-autosome” retrogenes, we extracted their dN/dS ratios calculated when testing each individual retrocopy for purifying selection (see above). In all “out of X” analyses, we removed genes potentially derived from Y-linked parental genes (Supplemental Table S1; Hughes et al. 2015).
Definition of multiple retrogene isoforms and DEXSeq analysis
We detected retrogenes expressing alternative isoforms using two complementary approaches: (1) by identifying copies with two or more Cufflinks-assembled transcripts and (2) by retrieving copies with significant differential exon usage (DEU) among organs. To assess DEU, we first merged our retrocopy transcripts annotation to the Ensembl gene set using the dexseq_prepare_annotation.py function from the DEXSeq package (Anders et al. 2012). This step collapsed overlapping transcript annotations in a set of nonoverlapping exonic parts, which were tested for DEU by applying the pipeline indicated in the DEXSeq package vignette. Test of DEU was performed on each species using all organs as different “conditions,” and retrogenes having at least one differentially used exon (Benjamini-Hochberg-corrected P < 0.05) were considered as expressing alternative isoforms.
Detection of orphan retrogenes
To detect orphan retrogenes, we analyzed retrocopies detected solely by using parental genes from other species. To verify the absence of the parental gene in the species of interest, we analyzed all tBLASTn hits of the outgroup parent not coinciding with the putative orphan retrogene. If none of these hits (when present) overlapped annotated protein-coding genes or transcribed genomic loci not annotated in Ensembl, we considered the parental gene lost and defined the retrocopy as an orphan retrogene. Since more relaxed criteria were used to detect orphan retrogenes (we did not require parental genes from more than one species in this case), most of them were not included in the retrocopy annotation. For the analysis of the nonannotated copies, we used (where available) their corresponding Ensembl annotation. The coding sequence of each orphan retrogene family was tested for purifying selection with codeml (using the approach described above). To estimate the expression divergence between the orphan retrogenes and their outgroup parents, we calculated the Euclidean distance between their expression profiles. Specifically, for each orphan and nonorphan retrogene families, we extracted the median expression in all organs (orphan expression profile) and compared it to the median expression in all organs of their parental gene in outgroup species (parental expression profile). The Euclidean distances measured for orphan and nonorphan retrogenes of the same evolutionary age were compared both with a Mann-Whitney U test and with a resampling approach (obtaining the same results; data not shown) to identify significant differences between the two groups.
Statistical analyses
All statistical analyses were performed using R (http://www.R-project.org/) (R Core Team 2014).
Data access
The orangutan testis RNA-seq data from this study have been submitted to the NCBI Gene Expression Omnibus (GEO; http://www.ncbi.nlm.nih.gov/geo/) under accession number GSE72236.
Acknowledgments
We thank K. Harshman and the Lausanne Genomics Technology Facility for high-throughput sequencing support, I. Xenarios and the Vital-IT computational facility for computational support, the Kyoto City Zoo for providing the orangutan testis sample, Margarida Cardoso Moreira and three anonymous reviewers for valuable comments on the manuscript, and the Kaessmann group in general for helpful discussions. This research was supported by grants from the European Research Council (Starting Grant 242597, SexGenTransEvolution) and Swiss National Science Foundation (grants 130287 and 146474).
Footnotes
[Supplemental material is available for this article.]
Article published online before print. Article, supplemental material, and publication date are at http://www.genome.org/cgi/doi/10.1101/gr.198473.115.
References
- Abyzov A, Iskow R, Gokcumen O, Radke DW, Balasubramanian S, Pei B, Habegger L, Lee C, Gerstein M. 2013. Analysis of variable retroduplications in human populations suggests coupling of retrotransposition to cell division. Genome Res 23: 2042–2052. [DOI] [PMC free article] [PubMed] [Google Scholar]
- Anders S, Reyes A, Huber W. 2012. Detecting differential usage of exons from RNA-seq data. Genome Res 22: 2008–2017. [DOI] [PMC free article] [PubMed] [Google Scholar]
- Andersson R, Sandelin A, Danko CG. 2015. A unified architecture of transcriptional regulatory elements. Trends Genet 31: 426–433. [DOI] [PubMed] [Google Scholar]
- Bai Y, Casola C, Betrán E. 2008. Evolutionary origin of regulatory regions of retrogenes in Drosophila. BMC Genomics 9: 241. [DOI] [PMC free article] [PubMed] [Google Scholar]
- Bayat V, Thiffault I, Jaiswal M, Tétreault M, Donti T, Sasarman F, Bernard G, Demers-Lamarche J, Dicaire MJ, Mathieu J, et al. 2012. Mutations in the mitochondrial methionyl-tRNA synthetase cause a neurodegenerative phenotype in flies and a recessive ataxia (ARSAL) in humans. PLoS Biol 10: e1001288. [DOI] [PMC free article] [PubMed] [Google Scholar]
- Betrán E, Thornton K, Long M. 2002. Retroposed new genes out of the X in Drosophila. Genome Res 12: 1854–1859. [DOI] [PMC free article] [PubMed] [Google Scholar]
- Bradley J, Baltus A, Skaletsky H, Royce-Tolland M, Dewar K, Page DC. 2004. An X-to-autosome retrogene is required for spermatogenesis in mice. Nat Genet 36: 872–876. [DOI] [PubMed] [Google Scholar]
- Brawand D, Soumillon M, Necsulea A, Julien P, Csárdi G, Harrigan P, Weier M, Liechti A, Aximu-Petri A, Kircher M, et al. 2011. The evolution of gene expression levels in mammalian organs. Nature 478: 343–348. [DOI] [PubMed] [Google Scholar]
- Carney TD, Struck AJ, Doe CQ. 2013. midlife crisis encodes a conserved zinc-finger protein required to maintain neuronal differentiation in Drosophila. Development 140: 4155–4164. [DOI] [PMC free article] [PubMed] [Google Scholar]
- Chen S, Krinsky BH, Long M. 2013. New genes as drivers of phenotypic evolution. Nat Rev Genet 14: 645–660. [DOI] [PMC free article] [PubMed] [Google Scholar]
- Ciomborowska J, Rosikiewicz W, Szklarczyk D, Makałowski W, Makałowska I. 2013. “Orphan” retrogenes in the human genome. Mol Biol Evol 30: 384–396. [DOI] [PMC free article] [PubMed] [Google Scholar]
- Connallon T, Clark AG. 2011. The resolution of sexual antagonism by gene duplication. Genetics 187: 919–937. [DOI] [PMC free article] [PubMed] [Google Scholar]
- Core LJ, Martins AL, Danko CG, Waters CT, Siepel A, Lis JT. 2014. Analysis of transcription start sites from nascent RNA supports a unified architecture of mammalian promoters and enhancers. Nat Genet 46: 1311–1320. [DOI] [PMC free article] [PubMed] [Google Scholar]
- Cortez D, Marin R, Toledo-Flores D, Froidevaux L, Liechti A, Waters PD, Grützner F, Kaessmann H. 2014. Origins and functional evolution of Y chromosomes across mammals. Nature 508: 488–493. [DOI] [PubMed] [Google Scholar]
- Cravatt BF, Simon GM, Yates JR. 2007. The biological impact of mass-spectrometry-based proteomics. Nature 450: 991–1000. [DOI] [PubMed] [Google Scholar]
- Creyghton MP, Cheng AW, Welstead GG, Kooistra T, Carey BW, Steine EJ, Hanna J, Lodato MA, Frampton GM, Sharp PA, et al. 2010. Histone H3K27ac separates active from poised enhancers and predicts developmental state. Proc Natl Acad Sci 107: 21931–21936. [DOI] [PMC free article] [PubMed] [Google Scholar]
- Dai H, Chen Y, Chen S, Mao Q, Kennedy D, Landback P, Eyre-Walker A, Du W, Long M. 2008. The evolution of courtship behaviors through the origination of a new gene in Drosophila. Proc Natl Acad Sci 105: 7478–7483. [DOI] [PMC free article] [PubMed] [Google Scholar]
- Deaton A, Bird A. 2011. CpG islands and the regulation of transcription. Genes Dev 25: 1010–1022. [DOI] [PMC free article] [PubMed] [Google Scholar]
- Dupanloup I, Kaessmann H. 2006. Evolutionary simulations to detect functional lineage-specific genes. Bioinformatics 22: 1815–1822. [DOI] [PubMed] [Google Scholar]
- Emerson JJ, Kaessmann H, Betrán E, Long M. 2004. Extensive gene traffic on the mammalian X chromosome. Science 303: 537–540. [DOI] [PubMed] [Google Scholar]
- Esnault C, Maestre J, Heidmann T. 2000. Human LINE retrotransposons generate processed pseudogenes. Nat Genet 24: 363–367. [DOI] [PubMed] [Google Scholar]
- Fablet M, Bueno M, Potrzebowski L, Kaessmann H. 2009. Evolutionary origin and functions of retrogene introns. Mol Biol Evol 26: 2147–2156. [DOI] [PubMed] [Google Scholar]
- The FANTOM Consortium and the RIKEN PMI and CLST (DGT). 2014. A promoter-level mammalian expression atlas. Nature 507: 462–470. [DOI] [PMC free article] [PubMed] [Google Scholar]
- Force A, Lynch M, Pickett FB, Amores A, Yan YL, Postlethwait J. 1999. Preservation of duplicate genes by complementary, degenerative mutations. Genetics 151: 1531–1545. [DOI] [PMC free article] [PubMed] [Google Scholar]
- Gallach M, Betrán E. 2011. Intralocus sexual conflict resolved through gene duplication. Trends Ecol Evol 26: 222–228. [DOI] [PMC free article] [PubMed] [Google Scholar]
- Ghanbarian AT, Hurst LD. 2015. Neighboring genes show correlated evolution in gene expression. Mol Biol Evol 32: 1748–1766. [DOI] [PMC free article] [PubMed] [Google Scholar]
- Gotea V, Petrykowska HM, Elnitski L. 2013. Bidirectional promoters as important drivers for the emergence of species-specific transcripts. PLoS One 8: e57323. [DOI] [PMC free article] [PubMed] [Google Scholar]
- Guerzoni D, McLysaght A. 2011. De novo origins of human genes. PLoS Genet 7: e1002381. [DOI] [PMC free article] [PubMed] [Google Scholar]
- Heintzman ND, Stuart RK, Hon G, Fu Y, Ching CW, Hawkins RD, Barrera LO, Van Calcar S, Qu C, Ching KA, et al. 2007. Distinct and predictive chromatin signatures of transcriptional promoters and enhancers in the human genome. Nat Genet 39: 311–318. [DOI] [PubMed] [Google Scholar]
- Heinz S, Benner C, Spann N, Bertolino E, Lin YC, Laslo P, Cheng JX, Murre C, Singh H, Glass CK. 2010. Simple combinations of lineage-determining transcription factors prime cis-regulatory elements required for macrophage and B cell identities. Mol Cell 38: 576–589. [DOI] [PMC free article] [PubMed] [Google Scholar]
- Hillier LW, Miller W, Birney E, Warren W, Hardison R, Ponting CP, Bork P, Burt D, Groenen MA, Delany ME, et al. 2004. Sequence and comparative analysis of the chicken genome provide unique perspectives on vertebrate evolution. Nature 432: 695–716. [DOI] [PubMed] [Google Scholar]
- Huang YT, Chen FC, Chen CJ, Chen HL, Chuang TJ. 2008. Identification and analysis of ancestral hominoid transcriptome inferred from cross-species transcript and processed pseudogene comparisons. Genome Res 18: 1163–1170. [DOI] [PMC free article] [PubMed] [Google Scholar]
- Hughes JF, Skaletsky H, Koutseva N, Pyntikova T, Page DC. 2015. Sex chromosome-to-autosome transposition events counter Y-chromosome gene loss in mammals. Genome Biol 16: 104. [DOI] [PMC free article] [PubMed] [Google Scholar]
- Illingworth RS, Gruenewald-Schneider U, Webb S, Kerr ARW, James KD, Turner DJ, Smith C, Harrison DJ, Andrews R, Bird AP. 2010. Orphan CpG islands identify numerous conserved promoters in the mammalian genome. PLoS Genet 6: e1001134. [DOI] [PMC free article] [PubMed] [Google Scholar]
- Ingolia NT, Ghaemmaghami S, Newman JRS, Weissman JS. 2009. Genome-wide analysis in vivo of translation with nucleotide resolution using ribosome profiling. Science 324: 218–223. [DOI] [PMC free article] [PubMed] [Google Scholar]
- Isken O, Maquat LE. 2008. The multiple lives of NMD factors: balancing roles in gene and genome regulation. Nat Rev Genet 9: 699–712. [DOI] [PMC free article] [PubMed] [Google Scholar]
- Jiang H, Lei R, Ding S-W, Zhu S. 2014. Skewer: a fast and accurate adapter trimmer for next-generation sequencing paired-end reads. BMC Bioinformatics 15: 182. [DOI] [PMC free article] [PubMed] [Google Scholar]
- Julien P, Brawand D, Soumillon M, Necsulea A, Liechti A, Schütz F, Daish T, Grützner F, Kaessmann H. 2012. Mechanisms and evolutionary patterns of mammalian and avian dosage compensation. PLoS Biol 10: e1001328. [DOI] [PMC free article] [PubMed] [Google Scholar]
- Kaessmann H. 2010. Origins, evolution, and phenotypic impact of new genes. Genome Res 20: 1313–1326. [DOI] [PMC free article] [PubMed] [Google Scholar]
- Kaessmann H, Vinckenbosch N, Long M. 2009. RNA-based gene duplication: mechanistic and evolutionary insights. Nat Rev Genet 10: 19–31. [DOI] [PMC free article] [PubMed] [Google Scholar]
- Kim DS, Wang Y, Oh HJ, Choi D, Lee K, Hahn Y. 2014. Retroduplication and loss of parental genes is a mechanism for the generation of intronless genes in Ciona intestinalis and Ciona savignyi. Dev Genes Evol 224: 255–260. [DOI] [PubMed] [Google Scholar]
- Kokošar J, Kordiš D. 2013. Genesis and regulatory wiring of retroelement-derived domesticated genes: a phylogenomic perspective. Mol Biol Evol 30: 1015–1031. [DOI] [PMC free article] [PubMed] [Google Scholar]
- Kordiš D. 2011. Extensive intron gain in the ancestor of placental mammals. Biol Direct 6: 59. [DOI] [PMC free article] [PubMed] [Google Scholar]
- Lahn BT, Page DC. 1999. Retroposition of autosomal mRNA yielded testis-specific gene family on human Y chromosome. Nat Genet 21: 429–433. [DOI] [PubMed] [Google Scholar]
- Li H, Handsaker B, Wysoker A, Fennell T, Ruan J, Homer N, Marth G, Abecasis G, Durbin R. 2009. The Sequence Alignment/Map format and SAMtools. Bioinformatics 25: 2078–2079. [DOI] [PMC free article] [PubMed] [Google Scholar]
- Long M, Langley CH. 1993. Natural selection and the origin of jingwei, a chimeric processed functional gene in Drosphila. Science 260: 91–95. [DOI] [PubMed] [Google Scholar]
- Long M, Vankuren N, Chen S, Vibranovski M. 2013. New gene evolution: Little did we know. Annu Rev Genet 47: 307–333. [DOI] [PMC free article] [PubMed] [Google Scholar]
- Marques AC, Dupanloup I, Vinckenbosch N, Reymond A, Kaessmann H. 2005. Emergence of young human genes after a burst of retroposition in primates. PLoS Biol 3: e357. [DOI] [PMC free article] [PubMed] [Google Scholar]
- Marques AC, Vinckenbosch N, Brawand D, Kaessmann H. 2008. Functional diversification of duplicate genes through subcellular adaptation of encoded proteins. Genome Biol 9: R54. [DOI] [PMC free article] [PubMed] [Google Scholar]
- Marques-Bonet T, Girirajan S, Eichler EE. 2009. The origins and impact of primate segmental duplications. Trends Genet 25: 443–454. [DOI] [PMC free article] [PubMed] [Google Scholar]
- McCarrey JR, Thomas K. 1987. Human testis-specific PGK gene lacks introns and possesses characteristics of a processed gene. Nature 326: 501–505. [DOI] [PubMed] [Google Scholar]
- Mighell AJ, Smith NR, Robinson PA, Markham AF. 2000. Vertebrate pseudogenes. FEBS Lett 468: 109–114. [DOI] [PubMed] [Google Scholar]
- Necsulea A, Kaessmann H. 2014. Evolutionary dynamics of coding and non-coding transcriptomes. Nat Rev Genet 15: 734–748. [DOI] [PubMed] [Google Scholar]
- Necsulea A, Soumillon M, Warnefors M, Liechti A, Daish T, Zeller U, Baker JC, Grützner F, Kaessmann H. 2014. The evolution of lncRNA repertoires and expression patterns in tetrapods. Nature 505: 635–640. [DOI] [PubMed] [Google Scholar]
- Okamura K, Nakai K. 2008. Retrotransposition as a source of new promoters. Mol Biol Evol 25: 1231–1238. [DOI] [PMC free article] [PubMed] [Google Scholar]
- Pan D, Zhang L. 2009. Burst of young retrogenes and independent retrogene formation in mammals. PLoS One 4: e5040. [DOI] [PMC free article] [PubMed] [Google Scholar]
- Park J II, Semyonov J, Chia LC, Yi W, Warren W, Hsu SYT. 2008. Origin of INSL3-mediated testicular descent in therian mammals. Genome Res 18: 974–985. [DOI] [PMC free article] [PubMed] [Google Scholar]
- Parker HG, VonHoldt BM, Quignon P, Margulies EH, Shao S, Mosher DS, Spady TC, Elkahloun A, Cargill M, Jones PG, et al. 2009. An expressed fgf4 retrogene is associated with breed-defining chondrodysplasia in domestic dogs. Science 325: 995–998. [DOI] [PMC free article] [PubMed] [Google Scholar]
- Parsch J, Ellegren H. 2013. The evolutionary causes and consequences of sex-biased gene expression. Nat Rev Genet 14: 83–87. [DOI] [PubMed] [Google Scholar]
- Podlaha O, Zhang J. 2009. Processed pseudogenes: the “fossilized footprints” of past gene expression. Trends Genet 25: 429–434. [DOI] [PMC free article] [PubMed] [Google Scholar]
- Potrzebowski L, Vinckenbosch N, Marques AC, Chalmel F, Jégou B, Kaessmann H. 2008. Chromosomal gene movements reflect the recent origin and biology of therian sex chromosomes. PLoS Biol 6: e80. [DOI] [PMC free article] [PubMed] [Google Scholar]
- Quinlan AR, Hall IM. 2010. BEDTools: a flexible suite of utilities for comparing genomic features. Bioinformatics 26: 841–842. [DOI] [PMC free article] [PubMed] [Google Scholar]
- R Core Team. 2014. R: a language and environment for statistical computing. R Foundation for Statistical Computing, Vienna, Austria: http://www.R-project.org/. [Google Scholar]
- Rintisch C, Heinig M, Bauerfeind A, Schafer S, Mieth C, Patone G, Hummel O, Chen W, Cook S, Cuppen E, et al. 2014. Natural variation of histone modification and its impact on gene expression in the rat genome. Genome Res 24: 942–953. [DOI] [PMC free article] [PubMed] [Google Scholar]
- Rodriguez V, Vasudevan S, Noma A, Carlson BA, Green JE, Suzuki T, Chandrasekharappa SC. 2012. Structure-function analysis of human TYW2 enzyme required for the biosynthesis of a highly modified wybutosine (yW) base in phenylalanine-tRNA. PLoS One 7: e39297. [DOI] [PMC free article] [PubMed] [Google Scholar]
- Rosso L, Marques AC, Reichert AS, Kaessmann H. 2008a. Mitochondrial targeting adaptation of the hominoid-specific glutamate dehydrogenase driven by positive Darwinian selection. PLoS Genet 4: e1000150. [DOI] [PMC free article] [PubMed] [Google Scholar]
- Rosso L, Marques AC, Weier M, Lambert N, Lambot M-A, Vanderhaeghen P, Kaessmann H. 2008b. Birth and rapid subcellular adaptation of a hominoid-specific CDC14 protein. PLoS Biol 6: e140. [DOI] [PMC free article] [PubMed] [Google Scholar]
- Shemesh R, Novik A, Edelheit S, Sorek R. 2006. Genomic fossils as a snapshot of the human transcriptome. Proc Natl Acad Sci 103: 1364–1369. [DOI] [PMC free article] [PubMed] [Google Scholar]
- Shen Y, Yue F, McCleary DF, Ye Z, Edsall L, Kuan S, Wagner U, Dixon J, Lee L, Lobanenkov VV, et al. 2012. A map of the cis-regulatory sequences in the mouse genome. Nature 488: 116–120. [DOI] [PMC free article] [PubMed] [Google Scholar]
- Shiao MS, Liao BY, Long M, Yu HT. 2008. Adaptive evolution of the insulin two-gene system in mouse. Genetics 178: 1683–1691. [DOI] [PMC free article] [PubMed] [Google Scholar]
- Sorourian M, Kunte MM, Domingues S, Gallach M, Özdil F, Río J, Betrán E. 2014. Relocation facilitates the acquisition of short cis-regulatory regions that drive the expression of retrogenes during spermatogenesis in Drosophila. Mol Biol Evol 31: 2170–2180. [DOI] [PMC free article] [PubMed] [Google Scholar]
- Soumillon M, Necsulea A, Weier M, Brawand D, Zhang X, Gu H, Barthès P, Kokkinaki M, Nef S, Gnirke A, et al. 2013. Cellular source and mechanisms of high transcriptome complexity in the mammalian testis. Cell Rep 3: 2179–2190. [DOI] [PubMed] [Google Scholar]
- Szcześniak MW, Ciomborowska J, Nowak W, Rogozin IB, Makałowska I. 2011. Primate and rodent specific intron gains and the origin of retrogenes with splice variants. Mol Biol Evol 28: 33–37. [DOI] [PMC free article] [PubMed] [Google Scholar]
- Tautz D, Domazet-Lošo T. 2011. The evolutionary origin of orphan genes. Nat Rev Genet 12: 692–702. [DOI] [PubMed] [Google Scholar]
- Trapnell C, Pachter L, Salzberg SL. 2009. TopHat: discovering splice junctions with RNA-Seq. Bioinformatics 25: 1105–1111. [DOI] [PMC free article] [PubMed] [Google Scholar]
- Trapnell C, Williams BA, Pertea G, Mortazavi A, Kwan G, van Baren MJ, Salzberg SL, Wold BJ, Pachter L. 2010. Transcript assembly and quantification by RNA-Seq reveals unannotated transcripts and isoform switching during cell differentiation. Nat Biotechnol 28: 511–515. [DOI] [PMC free article] [PubMed] [Google Scholar]
- Turner JMA. 2007. Meiotic sex chromosome inactivation. Development 134: 1823–1831. [DOI] [PubMed] [Google Scholar]
- Villar D, Berthelot C, Flicek P, Odom DT, Villar D, Berthelot C, Aldridge S, Rayner TF, Lukk M, Pignatelli M. 2015. Enhancer evolution across 20 mammalian species. Cell 160: 554–566. [DOI] [PMC free article] [PubMed] [Google Scholar]
- Vinckenbosch N, Dupanloup I, Kaessmann H. 2006. Evolutionary fate of retroposed gene copies in the human genome. Proc Natl Acad Sci 103: 3220–3225. [DOI] [PMC free article] [PubMed] [Google Scholar]
- Wang W, Brunet FG, Nevo E, Long M. 2002. Origin of sphinx, a young chimeric RNA gene in Drosophila melanogaster. Proc Natl Acad Sci 99: 4448–4453. [DOI] [PMC free article] [PubMed] [Google Scholar]
- Warren WC, Hillier LW, Marshall Graves JA, Birney E, Ponting CP, Grützner F, Belov K, Miller W, Clarke L, Chinwalla AT, et al. 2008. Genome analysis of the platypus reveals unique signatures of evolution. Nature 453: 175–183. [DOI] [PMC free article] [PubMed] [Google Scholar]
- Yang Z. 2007. PAML 4: phylogenetic analysis by maximum likelihood. Mol Biol Evol 24: 1586–1591. [DOI] [PubMed] [Google Scholar]
- Zhang J, Zhang Y, Rosenberg HF. 2002. Adaptive evolution of a duplicated pancreatic ribonuclease gene in a leaf-eating monkey. Nat Genet 30: 411–415. [DOI] [PubMed] [Google Scholar]
- Zhang Z, Harrison PM, Liu Y, Gerstein M. 2003. Millions of years of evolution preserved: a comprehensive catalog of the processed pseudogenes in the human genome. Genome Res 13: 2541–2558. [DOI] [PMC free article] [PubMed] [Google Scholar]
- Zhang Y, Liu T, Meyer CA, Eeckhoute J, Johnson DS, Bernstein BE, Nusbaum C, Myers RM, Brown M, Li W, et al. 2008. Model-based analysis of ChIP-Seq (MACS). Genome Biol 9: R137. [DOI] [PMC free article] [PubMed] [Google Scholar]