

Abstract
A small set of core transcription factors (TFs) dominates control of the gene expression program in embryonic stem cells and other well-studied cellular models. These core TFs collectively regulate their own gene expression, thus forming an interconnected auto-regulatory loop that can be considered the core transcriptional regulatory circuitry (CRC) for that cell type. There is limited knowledge of core TFs, and thus models of core regulatory circuitry, for most cell types. We recently discovered that genes encoding known core TFs forming CRCs are driven by super-enhancers, which provides an opportunity to systematically predict CRCs in poorly studied cell types through super-enhancer mapping. Here, we use super-enhancer maps to generate CRC models for 75 human cell and tissue types. These core circuitry models should prove valuable for further investigating cell-type–specific transcriptional regulation in healthy and diseased cells.
The pathways involved in complex biological processes such as metabolism have been mapped through the efforts of many laboratories over many years and have proven exceptionally valuable for basic and applied science (Krebs 1940; Kanehisa et al. 2012). Although we know much about the general mechanisms involved in control of gene transcription (Roeder 2005; Rajapakse et al. 2009; Bonasio et al. 2010; Conaway and Conaway 2011; Novershtern et al. 2011; Adelman and Lis 2012; Peter et al. 2012; Spitz and Furlong 2012; Zhou et al. 2012; de Wit et al. 2013; Gifford et al. 2013; Kumar et al. 2014; Levine et al. 2014; Ziller et al. 2014; Dixon et al. 2015; Tsankov et al. 2015), the complex pathways involved in the control of each cell's gene expression program have yet to be mapped in most cells. For some cell types, it is evident that core transcription factors (TFs) regulate their own genes and many others, forming the central core of a definable pathway. For most mammalian cell types, however, we have limited understanding of these pathways. These gene control pathways are important to decipher because they have the potential to define cell identity, enhance cellular reprogramming for regenerative medicine, and improve our understanding of transcriptional dysregulation in disease.
There is considerable evidence that the control of cell-type–specific gene expression programs in mammals is dominated by a small number of the many hundreds of TFs that are expressed in each cell type (Graf and Enver 2009; Buganim et al. 2013; Lee and Young 2013; Morris and Daley 2013). These core TFs are generally expressed in a cell-type–specific or lineage-specific manner and can reprogram cells from one cell type to another. In embryonic stem cells (ESCs), where transcriptional control has been most extensively studied, the core TFs POU5F1 (also known as OCT4), SOX2, and NANOG have been shown to be essential for establishment or maintenance of ESC identity and are among the factors capable of reprogramming cells into ESC-like induced pluripotent stem cells (iPSCs) (Young 2011). These core TFs bind to their own genes and those of the other core TFs, forming an interconnected auto-regulatory loop (Boyer et al. 2005), a property that is shared by the core TFs of other cell types (Odom et al. 2004, 2006; Sanda et al. 2012). The core TFs and the interconnected auto-regulatory loop they form have been termed “core regulatory circuitry” (CRC) (Boyer et al. 2005). Because the ESC core TFs also bind to a large portion of the genes that are expressed in an ESC-specific manner, we can posit that regulatory information flows from the CRC to this key portion of the cell's gene expression program, thus forming a map of information flow from CRC to cell-type–specific genes (Young 2011).
With limited knowledge of CRCs in most cell types, attempts to map the control of gene expression programs have thus far been dominated by efforts to integrate global information regarding gene-gene, protein-protein, gene-protein, and regulatory element interactions nested in these networks (Lefebvre et al. 2010; Gerstein et al. 2012; Neph et al. 2012; Yosef et al. 2013; Kemmeren et al. 2014; Rolland et al. 2014). These global studies have provided foundational resources and important insights into basic principles governing transcriptional regulatory networks. These include the identification of recurring motifs of regulatory interactions (Lee et al. 2002; Alon 2007; Davidson 2010; Stergachis et al. 2014) and of groups of genes that participate in common biological processes (Bar-Joseph et al. 2003; Dutkowski et al. 2013). However, these network maps do not generally capture the notion that key control information flows from a small number of core TFs. Recent studies have revealed that core TFs bind clusters of enhancers called super-enhancers and that the super-enhancer (SE)-associated genes include those encoding the core TFs themselves (Hnisz et al. 2013, 2015; Whyte et al. 2013). The ability to identify super-enhancer-associated TF genes, and thus candidate core TFs, should permit modeling of CRCs for all human cell types for which super-enhancer data are available.
Here we describe a method to reconstruct cell-type–specific CRCs based on the properties of core TFs identified in ESCs and several other cell types: They are encoded by genes whose expression is driven by super-enhancers, and they bind to each other's super-enhancers in an interconnected auto-regulatory loop. We report CRC models for 75 cell and tissue types throughout the human body. These models recapitulate and expand on previously described CRCs for well-studied cell types and provide core circuitry models for a broad range of human cell types that can serve as a first step to further mapping of cell-type–specific gene expression control pathways.
Results
Models of core regulatory circuitry
To construct core regulatory circuitry models of human cell types, we used the logic outlined in Figure 1. Detailed studies of the transcriptional control of cell identity in ESCs and a few other cell types have shown that core TFs have three properties. Core TFs are encoded by genes associated with super-enhancers (Hnisz et al. 2013; Whyte et al. 2013), bind the SEs associated with their own gene (Whyte et al. 2013), and form fully interconnected auto-regulatory loops with the other core TFs by binding enhancers together with the other core TFs (Fig. 1A; Odom et al. 2004, 2006; Boyer et al. 2005; Sanda et al. 2012). Candidate core TFs were predicted for multiple cell and tissue types using these three criteria, as described below.
Figure 1.

A method to build core regulatory circuitry. (A) Graphical description of the method used to create core regulatory circuitry (CRC) models. 1. Identification of SE-assigned expressed TFs. 2. Identification of the TFs that are predicted to bind their own SE, considered as auto-regulated. 3. CRCs are assembled as fully interconnected loops of auto-regulated TFs. (B) Cartoon showing: 1. TF-assigned SE constituents defined by H3K27ac ChIP-seq peak signals; 2. TFs having at least three DNA-binding sequence motif instances in their SE constituents are considered auto-regulated; 3. TFs with SEs having at least three DNA-binding sequence motif instances for each of the other predicted auto-regulated TFs together form an interconnected auto-regulatory loop. (C) Metagenes for the ChIP-seq signal for H3K27ac (left) and for the average ChIP-seq signal for POU5F1, SOX2, and NANOG (right) in H1 hESCs in the region ±5 kb around the center of the SE constituents. (D) Average percentage of DNA-binding motifs that are actually bound by the TFs from ChIP-seq data for POU5F1, SOX2, and NANOG in H1 hESCs, in either SE constituents or sets of random genomic sequences of the same size. (E) Venn diagram showing the average numbers, across 84 samples, of: 1. TFs having motifs that are expressed (445 TFs); 2. TFs having motifs that are expressed and assigned to a SE (61 TFs); 3. TFs having motifs that are expressed and assigned to a SE and that are predicted to bind their own SE (39 TFs); 4. TFs that are part of the CRC model (15 TFs).
For 75 human cell and tissue types, we first identified the set of active genes that encode TFs that are proximal to SEs (Fig. 1B, step 1). SEs have high levels of signal density for H3K27ac and were identified from H3K27ac ChIP-seq data compiled from multiple laboratories (Supplemental Table S1), as previously described (Hnisz et al. 2013). Recent chromatin conformation data indicate that SEs generally interact with the proximal active gene (Dowen et al. 2014), so the proximal active gene, identified through H3K27ac density at its TSS (see Methods), was assigned as the regulatory target of each SE.
Previous studies have shown that core TFs bind their own super-enhancers (Hnisz et al. 2013; Whyte et al. 2013), so we next identified the set of SE-assigned TF genes whose products are predicted to bind their own SEs (Fig. 1B, step 2). Binding was predicted by searching SE constituents for DNA sequence motifs corresponding to the TF product of the gene assigned to that SE. We compiled DNA-binding sequence motifs for 695 TFs from multiple published sources (Supplemental Table S2; Berger et al. 2008; Wei et al. 2010; Robasky and Bulyk 2011; Jolma et al. 2013; Mathelier et al. 2014) and scanned SE constituent sequences for the presence of the TF binding motifs, using the FIMO software package from the MEME suite (Grant et al. 2011). SE constituents were used for the motif search, as TF binding distributions peak on the SE constituent sequences defined by H3K27ac ChIP-seq peak signal (Fig. 1C). Furthermore, the presence of multiple DNA sequence motifs at SE constituents is predictive of the binding of a TF, whereas this is not the case, on average, across the genome (Fig. 1D). This confirms previous observations of better TF binding prediction in open chromatin sequences compared to other regions of the genome (Pique-Regi et al. 2011; Zhong et al. 2013). We considered the SE-assigned TF genes that were predicted to bind their own SE as auto-regulated, as prior evidence in ESCs indicates that such genes do regulate their own expression (Tomioka et al. 2002; Okumura-Nakanishi et al. 2005; Navarro et al. 2012).
To identify the SE-assigned TFs able to form an interconnected auto-regulatory loop by binding to each other's super-enhancers, we next identified, from the set of TFs considered auto-regulated, the TFs that are predicted to bind the SE of the other auto-regulated TFs, through a motif analysis in SE constituent sequences (Fig. 1B, step 3). We assembled interconnected auto-regulatory loops for each cell or tissue type (Fig. 1A, step 3) and selected the loop containing the set of TFs most often represented across the set of loops as the representative model of CRC (Supplemental Fig. S1). On average, across 75 cell types, 15% of the genes considered expressed and encoding TFs were assigned to an SE, 9% were predicted to be auto-regulated, and 3% were identified as candidate core TFs (Fig. 1E; Supplemental Table S3).
hESC core regulatory circuitry
The model of CRC predicted for human H1 ESCs (Fig. 2A, left panel) indicates that the approach described here captures the previously described core TFs and CRC for ESCs and suggests that additional TFs contribute to this core circuitry. The H1 ESC CRC contains three factors—POU5F1, SOX2, and NANOG—that are considered the foundation of the CRC in ESCs (Jaenisch and Young 2008; Young 2011). All three factors are essential for the pluripotent state (Nichols et al. 1998; Niwa et al. 2000; Avilion et al. 2003; Chambers et al. 2003; Mitsui et al. 2003; Masui et al. 2007; Silva et al. 2009; Theunissen et al. 2011), regulate their own genes and those encoding the other two factors (Tomioka et al. 2002; Catena et al. 2004; Boyer et al. 2005; Chew et al. 2005; Kuroda et al. 2005; Okumura-Nakanishi et al. 2005; Rodda et al. 2005; Loh et al. 2006), and can be used to reprogram fibroblasts to an induced pluripotent state (Takahashi and Yamanaka 2006; Yu et al. 2007).
Figure 2.
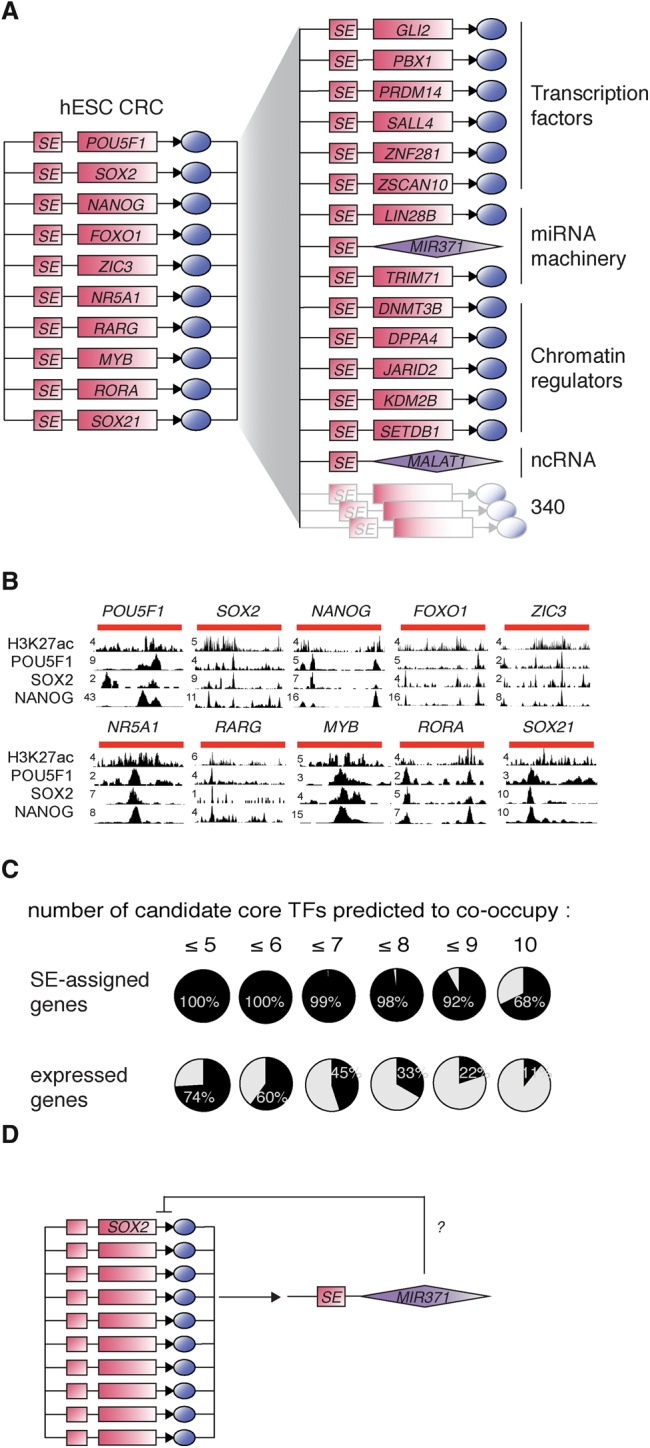
H1 ESC core and extended regulatory circuitry. (A) (Left) CRC model for H1 human embryonic stem cells. The role of each TF in ESC pluripotency and self-renewal is listed in Table 1. (Right) H1 hESC extended regulatory circuit. Examples of SE-assigned genes that are predicted to be bound by each of the TFs in the CRC. The role of these factors in ESC pluripotency and self-renewal is listed in Supplemental Table S5. (B) ChIP-seq data for H3K27ac, POU5F1, SOX2, and NANOG showing binding of the TFs to each of the SEs of the SE-assigned TFs in the hESC CRC. SE genomic locations are depicted by red lines on top of the tracks. (C) Pie charts showing the percentages of SE-assigned genes (top row) or all expressed genes (bottom row) whose regulatory sequences are predicted to be bound by increasing numbers of hESC candidate core TFs. (D) Diagram showing putative transcriptional regulation of miR-371a on SOX2 expression in hESCs.
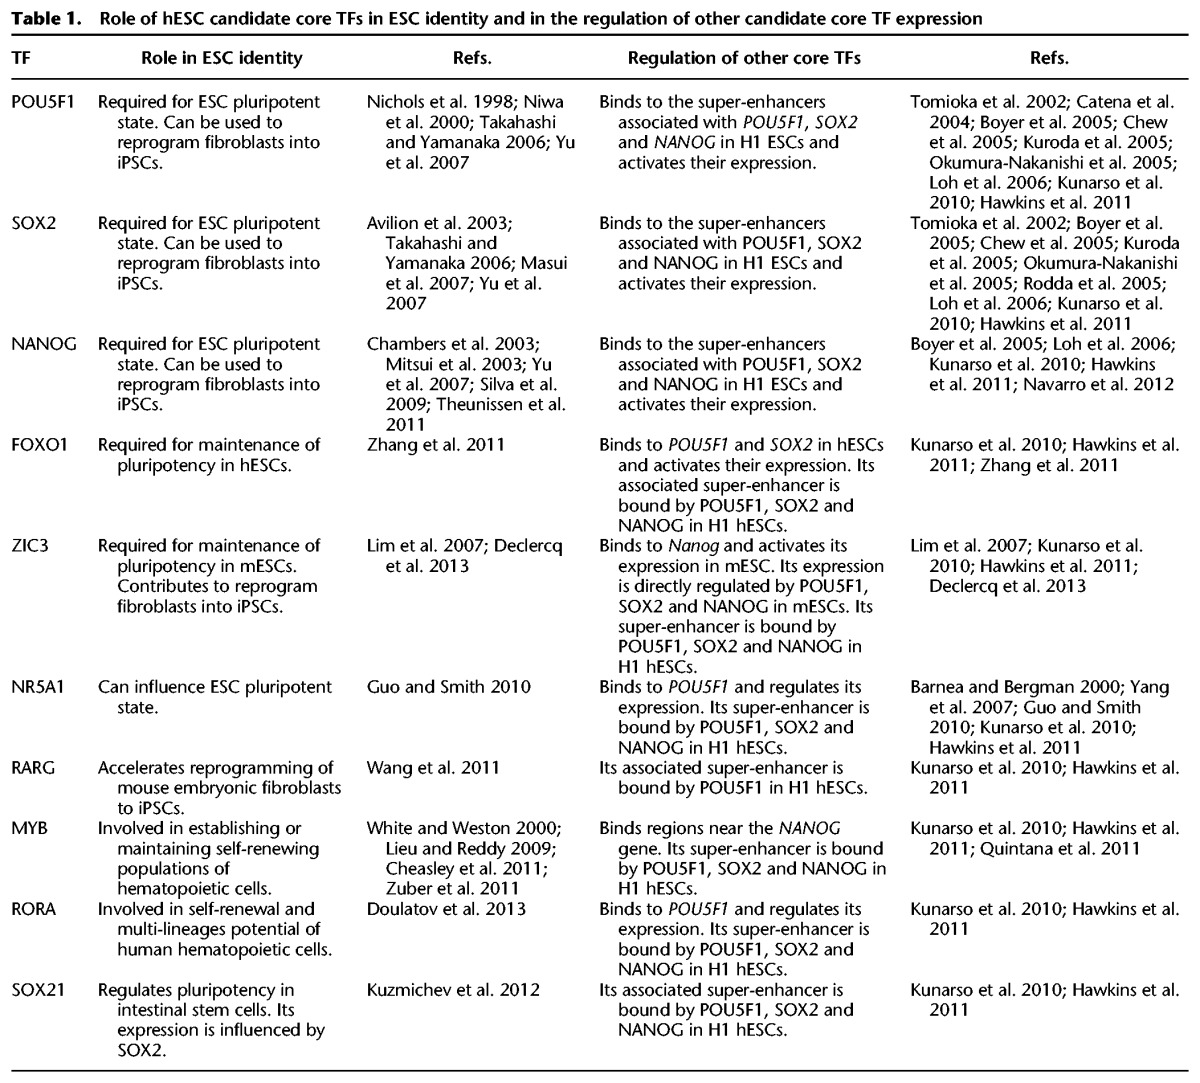
The results of the algorithm we describe suggest that seven additional TFs contribute to the ESC CRC (Fig. 2A, left panel). Most of these factors have previously been implicated in control of the stem cell state, and there is ChIP-seq evidence indicating that their super-enhancers are bound by POU5F1, SOX2, and NANOG (Fig. 2B). FOXO1 and ZIC3 have previously been shown to be essential for the maintenance of pluripotency (Lim et al. 2007; Zhang et al. 2011; Declercq et al. 2013). In hESCs, FOXO1 regulates POU5F1 and SOX2 expression (Zhang et al. 2011). ZIC3 directly activates Nanog expression in mouse ESCs (mESCs) and can contribute to reprogramming of human fibroblasts into an induced pluripotent state (Lim et al. 2007; Declercq et al. 2013). NR5A1 (also known as SF1) and RARG can influence the pluripotent state (Guo and Smith 2010; Wang et al. 2011), and both bind to regulatory regions of the POU5F1 gene and regulate its expression (Barnea and Bergman 2000; Yang et al. 2007; Guo and Smith 2010). The other three TFs—MYB, RORA, and SOX21—are best known for their roles in other stem cells. MYB and RORA have roles in establishing or maintaining self-renewing populations of hematopoietic cells (White and Weston 2000; Lieu and Reddy 2009; Cheasley et al. 2011; Zuber et al. 2011; Doulatov et al. 2013), while SOX21 is involved in regulating pluripotency in intestinal stem cells, where its expression is influenced by SOX2 (Kuzmichev et al. 2012). Thus, there are multiple lines of evidence, summarized in Table 1, that support the inclusion of POU5F1, SOX2, NANOG, FOXO1, ZIC3, NR5A1, RARG, MYB, RORA, and SOX21 in a model of hESC CRC.
Table 1.
Role of hESC candidate core TFs in ESC identity and in the regulation of other candidate core TF expression
In ESCs, loss of cell identity can be assayed by measuring POU5F1 protein levels, where reduced levels are associated with loss of pluripotency, and by counting cell nuclei, where reduced numbers can reflect loss of self-renewal (Chia et al. 2010; Kagey et al. 2010). To test whether the candidate core TFs play roles in control of ESC identity, we analyzed POU5F1 expression changes and cell nuclei number changes after depletion of each of these TFs using data from a genome-wide siRNA screen in H1 hESCs (Chia et al. 2010). These data confirm that the candidate core TFs contribute to pluripotency and/or survival and proliferation of hESCs (Supplemental Fig. S2A). Gene-set enrichment analysis (GSEA) of the set of candidate core TFs shows these factors are encoded by genes that are among those whose knock-down most impacts POU5F1 expression and cell nuclei count (Supplemental Fig. S2B,C). These functional assays in H1 hESCs thus provide supporting evidence for a functional role of the candidate core TFs in control of hESC identity.
Extended hESC regulatory circuitry
POU5F1, SOX2, and NANOG contribute to the formation of SEs at hundreds of active ESC genes that play prominent roles in cell identity (Whyte et al. 2013), suggesting that a simple extended model of regulatory information can be constructed to include these additional SE-assigned genes downstream from the core TFs. We identified the SE-assigned genes whose enhancers and promoters are predicted to be bound by the candidate core TFs in order to construct a model of extended hESC regulatory circuitry (Fig. 2A, right panel). Analysis shows the regulatory sequences of the SE-assigned genes are predicted to be bound by a greater number of candidate core TFs than the regulatory sequences of all expressed genes (Fig. 2C). Sixty-eight percent of the SE-assigned genes are predicted to be bound by each of the core TFs. Experimental evidence (Kunarso et al. 2010) shows that POU5F1 contributes to the regulation of at least 30% (z-test P-value <2.2 × 10⁻¹⁶) of these downstream SE-assigned target genes (Supplemental Table S4). Thus, in the model of extended hESC regulatory circuitry, the core TFs co-occupy and likely regulate the expression of a large portion of SE-assigned genes.
The model of extended hESC regulatory circuitry contains many genes that are known to play prominent roles in ESC biology (Young 2011). These include the TFs PRDM14, SALL4, and ZNF281, the chromatin regulators DNMT3B, JARID2, and SETDB1, and the miRNA miR-371a, all of which have established roles in pluripotency, self-renewal, or differentiation (detailed functions and associated references in Supplemental Table S5). Among the SE-assigned genes, some transcriptional regulators may create feedforward or feedback loops of regulation with the genes in the extended CRC to modulate the direct effect of core TFs. For example, miR-371a, the human homolog of miR-290 which is essential for mESC survival (Medeiros et al. 2011), may fine-tune SOX2 expression in hESCs (Fig. 2D). SOX2 is identified as a highly probable target of miR-371a by multiple miRNA target predictor algorithms, including TargetScan (Lewis et al. 2005), miRDB (Wong and Wang 2015), and PITA (Kertesz et al. 2007) (Supplemental Table S6), and recent functional assays in human cancer cells (Li et al. 2015) support a role for miR-371a in direct regulation of SOX2 expression. We therefore suggest that the ESC gene expression program is controlled by a CRC consisting of ten key TFs that (1) bind the SEs of their own genes and regulate their own expression, and (2) co-bind the SEs of many other genes important for ESC identity and regulate their expression.
CRC and extended regulatory circuitry for many cell types
We next developed models of CRC and extended regulatory circuitry for each of 75 human cell and tissue types (Fig. 3; Supplemental Table S3). The predicted CRCs contain key transcriptional regulators of cell identity that have been previously identified (Supplemental Table S7). This includes, for example, TBX5 in the heart (left ventricle) CRC (Ieda et al. 2010; Song et al. 2012; Nam et al. 2014), PDX1 in the pancreas CRC (Jonsson et al. 1994; Horb et al. 2003; Zhou et al. 2008), and SOX2 in the brain (hippocampus middle) CRC (Graham et al. 2003; Ferri 2004; Sisodiya et al. 2006; Lujan et al. 2012). They also contain well-characterized proto-oncogenes of cancer subtypes represented by cancer cell lines, such as ESR1 and GATA3 in MCF-7 breast cancer cells (Usary et al. 2004; Holst et al. 2007) and TCF7L2 and SMAD3 in HCT-116 colon cancer cells (Supplemental Fig. S3; Zhu et al. 1998; Tuupanen et al. 2009). Importantly, our approach recapitulates the oncogenic circuitry that had been previously identified in T-cell acute lymphoblastic leukemia (T-ALL) Jurkat cells (Sanda et al. 2012; Mansour et al. 2014), as one of the CRCs for Jurkat cells contains the four oncogenic TFs—GATA3, MYB, RUNX1, and TAL1—previously characterized as core TFs in this cell line (Fig. 4A). Together, these data indicate that the CRC models capture much existing knowledge of TFs that play key roles in control of cell identity across diverse cell and tissue types.
Figure 3.

Core and extended regulatory circuitry for multiple cells and tissue types. Core and extended circuitry for (A) brain (hippocampus middle), (B) adipocytes (adipose nuclei), (C) heart (left ventricle), and (D) pancreas. The number of SE-assigned genes predicted to be co-occupied by each of the candidate core TFs and 30 examples of those are displayed on the right part of the maps.
Figure 4.

Experimental validation for T-ALL Jurkat cell circuitry. (A) Core regulatory circuit containing GATA3, MYB, RUNX1, and TAL1 for T-ALL Jurkat cells. (B) ChIP-seq data for H3K27ac, MYB, RUNX1, TAL1, and GATA3 showing binding of the TF to each of the SEs in the T-ALL Jurkat cell core circuit. SE genomic locations are depicted by red lines on top of the tracks. (C) Boxplots showing fold change (FC) in expression for Jurkat cells transfected with the indicated shRNAs vs. control shRNAs, for either the set of candidate core TFs displayed in A (red) or the full set of TFs considered expressed in Jurkat cells (blue). P-values quantifying the difference between the two sets were calculated using a Wilcoxon test.
We used experimental data to test the accuracy of our predictions in newly identified CRCs. The binding of the core TFs to the super-enhancer sequences of the other predicted TFs in the core is supported by ChIP-seq data for core TFs in T-ALL Jurkat cells (Fig. 4B). Available ChIP-seq data for TFs in the CRCs for other cell types were also analyzed and lend functional support for the predicted binding interactions in the CRCs (Supplemental Fig. S3). To test the mutual regulation of the TFs in the core, we investigated the effects of shRNA depletion of MYB, RUNX1, TAL1, and GATA3 on expression of candidate core TF-encoding genes in T-ALL Jurkat cells (Fig. 4C). Analysis of the data shows that when a core TF is depleted, the expression of the TFs in the core is significantly down-regulated compared to the set of TFs considered expressed in the cell. This observation is in agreement with a direct effect of the core TFs on the expression of the other TFs in the core.
The candidate core TFs identified across a wide range of cell types show features of core TFs that have previously been described (Lee and Young 2013). Analysis of the candidate core TFs across samples shows that these are cell-type–specific or lineage-specific: 34% of the core TFs identified across cell types are predicted to be core TFs in only one cell type, and 77% are predicted to be core TFs in less than five cell types (Fig. 5A). DNA-binding domain structures can provide insight on the functional roles of TFs (Vaquerizas et al. 2009), so we compared the frequency of different DNA-binding domains in candidate core TFs to those in ubiquitously expressed housekeeping TFs. Compared to housekeeping TFs, candidate core TFs are depleted in the most common type of TFs—zinc finger domain-containing TFs—and enriched in various classes of TFs that have been associated with developmental processes, such as homeodomain-containing TFs (Fig. 5B). Analysis of expression data shows that candidate core TFs exhibit higher transcript levels when compared to the full set of TFs considered expressed in the cell (Fig. 5C). The candidate core TFs are thus cell-type– or lineage-specific, enriched for functional association with development processes, and show a relatively high level of expression compared to other TFs expressed in the cell.
Figure 5.
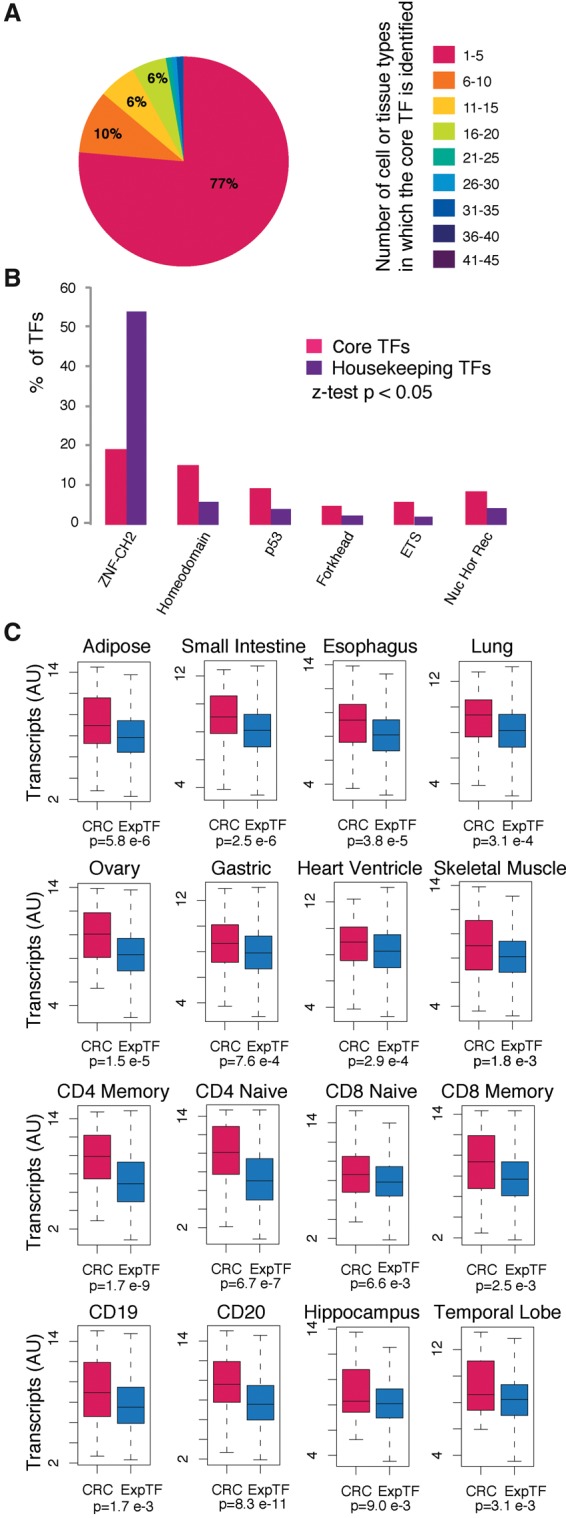
Features of candidate core TFs. (A) Percentages of TFs identified as candidate core TFs in a given number of cell or tissue types. The number of cell or tissue types in which a TF is identified as a candidate core TF is displayed with boxes on the right. A representative sample of each cell and tissue type is used when multiple samples from the same cell or tissue type are present in the data set. (B) DNA-binding domains that are significantly differentially represented in the set of candidate core TFs and housekeeping TFs. (C) Transcript levels for the set of candidate core TFs and for the full set of TFs considered expressed in each sample. P-values quantifying the difference between the two sets were calculated using a Wilcoxon test.
Analyzing CRCs across cell types, we identified features of CRCs that should help guide further experiments to better understand the transcriptional pathways involved in development and disease. We observed that a substantial fraction of candidate core TFs is expressed in multiple cell types, typically within a lineage. This feature of shared core TFs within lineages is evident through hierarchical clustering of candidate core TFs across all data sets (Fig. 6A). It suggests that specific combinations of TFs may be required to control complementary aspects of cell identity and that circuitries may be rewired through ectopic expression of a few TFs between similar cell types. We also found that, compared to other TFs, candidate core TFs are found significantly more often in the set of genes associated with diseases or traits via genome-wide association studies (GWAS), which suggests their involvement in cell identity and disease development (Fig. 6B; Supplemental Fig. S4). Previous studies have shown that disease-associated SNPs are enriched in SEs (Hnisz et al. 2013; Parker et al. 2013), and there are multiple examples of noncoding disease-associated SNPs overlapping the super-enhancers associated with TFs in the CRC (Supplemental Fig. S4).
Figure 6.
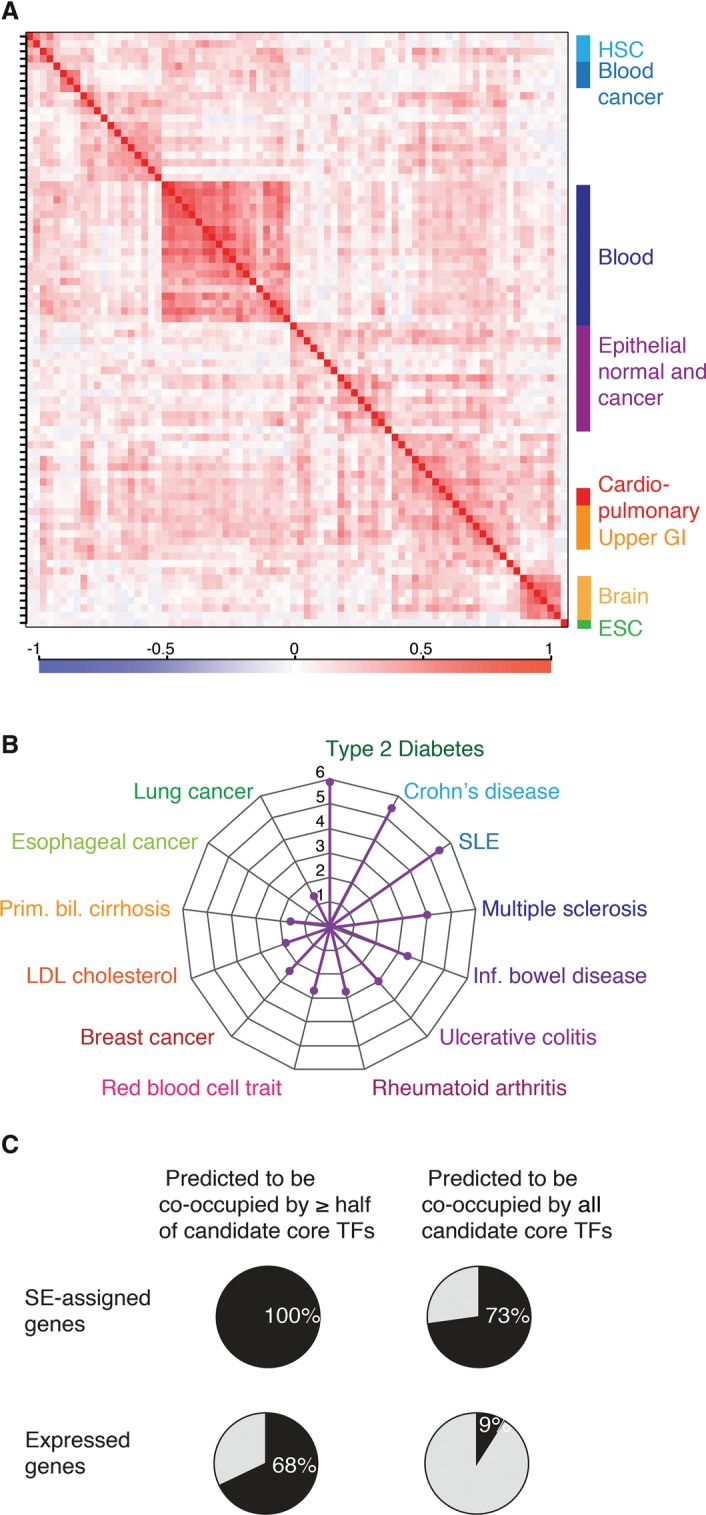
Properties of CRCs of multiple human cell and tissue types. (A) CRCs cluster according to cell type similarity. Hierarchical clustering of candidate core TFs for 80 human samples. The matrix of correlation based on Pearson coefficients identifies specific clusters for hematopoietic stem cells (HSC), blood cancer cells, blood cells, epithelial normal and cancer cells, cardio-pulmonary system cells, upper gastrointestinal system, and brain cells. Correlation values range from −1 to 1 and are colored from blue to red according to the color scale. (B) Radar plot showing the enrichment of candidate core TFs, compared to noncore TFs, in GWAS list of genes for multiple diseases or traits. P-values were calculated using a z-test, and 1/P-values are plotted for the diseases or traits that showed an enrichment P-value <5 × 10⁻² of candidate core TFs. (C) Pie charts showing the average percentages for all samples of SE-assigned genes (top row) or of all expressed genes (bottom row) whose regulatory sequences are predicted to be co-occupied by more than half or by all the TFs in the CRC.
We generated models of extended regulatory circuitry for 75 cell and tissue types using the same process described above for the hESC extended regulatory circuitry (Fig. 3). The features of these extended circuitries are consistent with those observed for hESCs. On average, across samples, 73% of the SE-assigned genes are predicted to be co-occupied by each of the candidate core TFs (Fig. 6C), and these SE-assigned target genes of the CRC play prominent roles in specific cell identities (Fig. 3).
Discussion
There have been tremendous advances in our understanding of the general mechanisms involved in control of gene transcription (Roeder 2005; Rajapakse et al. 2009; Bonasio et al. 2010; Conaway and Conaway 2011; Novershtern et al. 2011; Adelman and Lis 2012; Peter et al. 2012; Spitz and Furlong 2012; Zhou et al. 2012; de Wit et al. 2013; Gifford et al. 2013; Kumar et al. 2014; Ziller et al. 2014; Dixon et al. 2015; Tsankov et al. 2015), but the pathways by which a small set of core TFs control gene expression programs have yet to be mapped in most cells. We describe here models of core transcriptional regulatory circuitry for 75 human cell and tissue types. These models show significant percentages of overlap between the TF-TF binding interactions we predict in the CRCs and the TF-TF interactions identified in previous high-throughput analyses, for similar cell types (Supplemental Table S8; Neph et al. 2012). The CRC models we provide include known core TFs and reprogramming TFs that have been previously identified in a few cell types but add a large list of candidate cell identity regulators. These include ubiquitous and signaling TFs that should work together with the minimal set of TFs required to reprogram cells from one state to another, to establish and maintain cellular identity. These models provide the foundation for future studies of the transcriptional pathways that control cell identity in these diverse cell types of the human body.
Key target genes of the CRC were identified in a first step toward understanding how the information flows from the core TFs to all expressed genes. Across all cell and tissue types, the candidate core TFs were predicted to preferentially co-occupy SE-assigned genes, compared to all expressed genes. As SE-assigned genes are typically key for cell identity (Chapuy et al. 2013; Hnisz et al. 2013; Parker et al. 2013; Whyte et al. 2013; Loft et al. 2015), this shows that the concerted action of candidate core TFs may be preferentially targeted to those key cell identity genes. This led us to envision a model whereby the core TFs promote hallmarks of cell identities through co-binding the SEs of their own genes and regulating their own expression, and co-binding the SEs of many other genes important for cell identity and regulating their expression. The maps of CRC were thus extended to include the SE-assigned target genes of the CRC. These maps of extended regulatory circuitry are founding models for the description of more comprehensive networks that describe additional levels of regulation that should include signaling pathways, as super-enhancers serve as integrating platforms for signaling (Siersbæk et al. 2014b; Hnisz et al. 2015).
The approach presented here constitutes a first attempt to map CRCs in a wide range of cell types and harbors several limitations that should be considered when using the data. The analyses were restricted to TFs that were assigned to a SE in the data set and for which DNA-binding motifs are available. The CRC models also rely on data derived from cell lines, which do not necessarily reflect the state of cells in their normal niche, or from biopsies, which include mixed populations of cell types. Another consideration is the challenge of comprehensive experimental validation of the circuits, which would in principle require knock-out of individual core TFs and perhaps combinations of these TFs. Ongoing efforts to characterize DNA-binding motifs for TFs (Jolma et al. 2013; Mathelier et al. 2014; Hume et al. 2015), taking into account the influence of their TF partners, and the role of coactivators and chromatin regulators on their binding to regulatory sequences (Chen et al. 2008; Yan et al. 2013; Siersbæk et al. 2014a; Schmidt et al. 2015), and further experimental testing should help refine the description of the CRC models we provide here.
CRC models should provide guidance for reprogramming studies and may prove valuable for better understanding transcriptional dysregulation in disease. Candidate core TFs are enriched in the genes associated with multiple diseases or traits through GWAS, supporting their role in disease development. Furthermore, SEs are hotspots of noncoding disease-associated sequence variants (Maurano et al. 2012; Hnisz et al. 2013; Parker et al. 2013; Corradin et al. 2014; Farh et al. 2015). Some of these variants may modify the binding sites for core TFs, providing a mechanism for disease-associated transcriptional misregulation. This is the case, for example, of TFs we predict in CRCs such as TAL1 in T cells, TBX5 in cardiac cells, TCF7L2 in colorectal cancer cells, and ESR1 and GATA3 in breast cancer cells (Tuupanen et al. 2009; Cowper-Sal lari et al. 2012; Sur et al. 2012; Van den Boogaard et al. 2012; Bauer et al. 2013; French et al. 2013). Extended regulatory circuits integrating candidate core TFs and their SE-assigned target genes for many human cell types may thus help better understand disease-associated genetic variation, leading someday to circuitry-directed therapeutic interventions.
Methods
ChIP-seq data
H3K27ac ChIP-seq data were either downloaded from GEO (accession numbers in Supplemental Table S1) or generously shared by the NIH Roadmap Epigenome project (Bernstein et al. 2010). ChIP-seq data for H3K27ac (Kwiatkowski et al. 2014), MYB (Mansour et al. 2014) and TAL1 (Palii et al. 2011) in Jurkat cells and for POU5F1 (Kunarso et al. 2010), SOX2 (Hawkins et al. 2011), and NANOG (Kunarso et al. 2010) in H1 hESCs were downloaded from GEO. ChIP-seq data for CREB1, EBF1, ELF1, ETS1, PAX5, and POU2F2 in GM12878 lymphoblastoid B cells, for TCF7L2 in HCT-116 colon cancer cell line, and for ESR1 in T-47D breast cancer cell line were downloaded from ENCODE (Gertz et al. 2013).
CRC mapper
The algorithm we developed to identify core regulatory circuitry uses as input H3K27ac ChIP-seq reads aligned to the human genome, together with the ChIP-seq peaks identified by MACS (Zhang et al. 2008) and the enhancer table output from ROSE (https://bitbucket.org/young_computation/rose) (Lovén et al. 2013). SEs identified with ROSE are assigned to the closest transcript predicted to be expressed. For each SE-assigned TF, a motif analysis is carried out on the SE constituent sequences assigned to that TF using FIMO (Find Individual Motif Occurrences) from the MEME (Multiple Em for Motif Elicitation) suite (Grant et al. 2011). A database of DNA sequence motifs for 695 TFs was compiled from the TRANSFAC database of motifs (Matys et al. 2006), and from the MEME suite (January 23rd 2014 update), for the following collections: JASPAR CORE 2014 vertebrates (Mathelier et al. 2014), Jolma 2013 (Jolma et al. 2013), Homeodomains (Berger et al. 2008), mouse UniPROBE (Robasky and Bulyk 2011), and mouse and human ETS factors (Wei et al. 2010). For the motif search, the search space in SEs is restricted to extended SE constituents, as these are the regions that capture most of the TF binding in SEs (Fig. 1C). SE constituent DNA sequences are extracted, extended on each side (500 bp by default), and used for motif search with FIMO with a P-value threshold of 1 × 10⁻⁴. SE-assigned TFs whose set of constituents contains at least three DNA sequence motif instances for their own protein products are defined as auto-regulated TFs. From the set of auto-regulated TFs, the TFs predicted to bind to the SEs of other auto-regulated TFs, using the same criteria as described above, are identified. All possible fully interconnected auto-regulatory loops of TFs are then constructed through recursive identification. When multiple possibilities of fully interconnected auto-regulatory loops are found, the most representative fully interconnected auto-regulatory loop of TFs is selected as the model of CRC. This loop is defined as the loop containing the TFs that occur the most frequently across all possible loops. See Supplemental Methods for details.
Data access
ChIP-seq data for RUNX1 and GATA3 in Jurkat cells from this study have been submitted to the NCBI Gene Expression Omnibus (GEO; https://www.ncbi.nlm.nih.gov/geo/) under accession number GSE76181. The CRC Mapper program is implemented in Python. It can be found in the Supplemental Material and is freely available for download at https://bitbucket.org/young_computation/crcmapper.
Competing interest statement
R.A.Y. and J.E.B. are founders of Syros Pharmaceuticals.
Acknowledgments
We thank members of the Young lab, especially Ana D'Alessio, Zi Peng Fan, and Jurian Schuijers for helpful discussions. This work was supported by the Foundation for the National Institutes of Health grant HG002668 (R.A.Y.). A.J.F. was funded by a National Science Foundation graduate fellowship, and B.J.A. is the Hope Funds for Cancer Research Grillo-Marxuach Family Fellow.
Footnotes
[Supplemental material is available for this article.]
Article published online before print. Article, supplemental material, and publication date are at http://www.genome.org/cgi/doi/10.1101/gr.197590.115.
References
- Adelman K, Lis JT. 2012. Promoter-proximal pausing of RNA polymerase II: emerging roles in metazoans. Nat Rev Genet 13: 720–731. [DOI] [PMC free article] [PubMed] [Google Scholar]
- Alon U. 2007. Network motifs: theory and experimental approaches. Nat Rev Genet 8: 450–461. [DOI] [PubMed] [Google Scholar]
- Avilion AA, Nicolis SK, Pevny LH, Perez L, Vivian N, Lovell-Badge R. 2003. Multipotent cell lineages in early mouse development depend on SOX2 function. Genes Dev 17: 126–140. [DOI] [PMC free article] [PubMed] [Google Scholar]
- Bar-Joseph Z, Gerber GK, Lee TI, Rinaldi NJ, Yoo JY, Robert F, Gordon DB, Fraenkel E, Jaakkola TS, Young RA, et al. 2003. Computational discovery of gene modules and regulatory networks. Nat Biotechnol 21: 1337–1342. [DOI] [PubMed] [Google Scholar]
- Barnea E, Bergman Y. 2000. Synergy of SF1 and RAR in activation of Oct-3/4 promoter. J Biol Chem 275: 6608–6619. [DOI] [PubMed] [Google Scholar]
- Bauer DE, Kamran SC, Lessard S, Xu J, Fujiwara Y, Lin C, Shao Z, Canver MC, Smith EC, Pinello L, et al. 2013. An erythroid enhancer of BCL11A subject to genetic variation determines fetal hemoglobin level. Science 342: 253–257. [DOI] [PMC free article] [PubMed] [Google Scholar]
- Berger MF, Badis G, Gehrke AR, Talukder S, Philippakis AA, Peña-Castillo L, Alleyne TM, Mnaimneh S, Botvinnik OB, Chan ET, et al. 2008. Variation in homeodomain DNA binding revealed by high-resolution analysis of sequence preferences. Cell 133: 1266–1276. [DOI] [PMC free article] [PubMed] [Google Scholar]
- Bernstein BE, Stamatoyannopoulos JA, Costello JF, Ren B, Milosavljevic A, Meissner A, Kellis M, Marra MA, Beaudet AL, Ecker JR, et al. 2010. The NIH Roadmap Epigenomics Mapping Consortium. Nat Biotechnol 28: 1045–1048. [DOI] [PMC free article] [PubMed] [Google Scholar]
- Bonasio R, Tu S, Reinberg D. 2010. Molecular signals of epigenetic states. Science 330: 612–616. [DOI] [PMC free article] [PubMed] [Google Scholar]
- Boyer LA, Lee TI, Cole MF, Johnstone SE, Levine SS, Zucker JP, Guenther MG, Kumar RM, Murray HL, Jenner RG, et al. 2005. Core transcriptional regulatory circuitry in human embryonic stem cells. Cell 122: 947–956. [DOI] [PMC free article] [PubMed] [Google Scholar]
- Buganim Y, Faddah DA, Jaenisch R. 2013. Mechanisms and models of somatic cell reprogramming. Nat Rev Genet 14: 427–439. [DOI] [PMC free article] [PubMed] [Google Scholar]
- Catena R, Tiveron C, Ronchi A, Porta S, Ferri A, Tatangelo L, Cavallaro M, Favaro R, Ottolenghi S, Reinbold R, et al. 2004. Conserved POU binding DNA sites in the Sox2 upstream enhancer regulate gene expression in embryonic and neural stem cells. J Biol Chem 279: 41846–41857. [DOI] [PubMed] [Google Scholar]
- Chambers I, Colby D, Robertson M, Nichols J, Lee S, Tweedie S, Smith A. 2003. Functional expression cloning of Nanog, a pluripotency sustaining factor in embryonic stem cells. Cell 113: 643–655. [DOI] [PubMed] [Google Scholar]
- Chapuy B, McKeown MR, Lin CY, Monti S, Roemer MGM, Qi J, Rahl PB, Sun HH, Yeda KT, Doench JG, et al. 2013. Discovery and characterization of super-enhancer-associated dependencies in diffuse large B cell lymphoma. Cancer Cell 24: 777–790. [DOI] [PMC free article] [PubMed] [Google Scholar]
- Cheasley D, Pereira L, Lightowler S, Vincan E, Malaterre J, Ramsay RG. 2011. Myb controls intestinal stem cell genes and self-renewal. Stem Cells 29: 2042–2050. [DOI] [PubMed] [Google Scholar]
- Chen X, Vega VB, Ng H-H. 2008. Transcriptional regulatory networks in embryonic stem cells. Cold Spring Harb Symp Quant Biol 73: 203–209. [DOI] [PubMed] [Google Scholar]
- Chew J-L, Loh Y-H, Zhang W, Chen X, Tam W-L, Yeap L-S, Li P, Ang Y-S, Lim B, Robson P, et al. 2005. Reciprocal transcriptional regulation of Pou5f1 and Sox2 via the Oct4/Sox2 complex in embryonic stem cells. Mol Cell Biol 25: 6031–6046. [DOI] [PMC free article] [PubMed] [Google Scholar]
- Chia N-Y, Chan Y-S, Feng B, Lu X, Orlov YL, Moreau D, Kumar P, Yang L, Jiang J, Lau M-S, et al. 2010. A genome-wide RNAi screen reveals determinants of human embryonic stem cell identity. Nature 468: 316–320. [DOI] [PubMed] [Google Scholar]
- Conaway RC, Conaway JW. 2011. Origins and activity of the Mediator complex. Semin Cell Dev Biol 22: 729–734. [DOI] [PMC free article] [PubMed] [Google Scholar]
- Corradin O, Saiakhova A, Akhtar-Zaidi B, Myeroff L, Willis J, Cowper-Sal lari R, Lupien M, Markowitz S, Scacheri PC. 2014. Combinatorial effects of multiple enhancer variants in linkage disequilibrium dictate levels of gene expression to confer susceptibility to common traits. Genome Res 24: 1–13. [DOI] [PMC free article] [PubMed] [Google Scholar]
- Cowper-Sal lari R, Zhang X, Wright JB, Bailey SD, Cole MD, Eeckhoute J, Moore JH, Lupien M. 2012. Breast cancer risk–associated SNPs modulate the affinity of chromatin for FOXA1 and alter gene expression. Nat Genet 44: 1191–1198. [DOI] [PMC free article] [PubMed] [Google Scholar]
- Davidson EH. 2010. Emerging properties of animal gene regulatory networks. Nature 468: 911–920. [DOI] [PMC free article] [PubMed] [Google Scholar]
- de Wit E, Bouwman BAM, Zhu Y, Klous P, Splinter E, Verstegen MJAM, Krijger PHL, Festuccia N, Nora EP, Welling M, et al. 2013. The pluripotent genome in three dimensions is shaped around pluripotency factors. Nature 501: 227–231. [DOI] [PubMed] [Google Scholar]
- Declercq J, Sheshadri P, Verfaillie CM, Kumar A. 2013. Zic3 enhances the generation of mouse induced pluripotent stem cells. Stem Cells Dev 22: 2017–2025. [DOI] [PMC free article] [PubMed] [Google Scholar]
- Dixon JR, Jung I, Selvaraj S, Shen Y, Antosiewicz-Bourget JE, Lee AY, Ye Z, Kim A, Rajagopal N, Xie W, et al. 2015. Chromatin architecture reorganization during stem cell differentiation. Nature 518: 331–336. [DOI] [PMC free article] [PubMed] [Google Scholar]
- Doulatov S, Vo LT, Chou SS, Kim PG, Arora N, Li H, Hadland BK, Bernstein ID, Collins JJ, Zon LI, et al. 2013. Induction of multipotential hematopoietic progenitors from human pluripotent stem cells via respecification of lineage-restricted precursors. Cell Stem Cell 13: 459–470. [DOI] [PMC free article] [PubMed] [Google Scholar]
- Dowen JM, Fan ZP, Hnisz D, Ren G, Abraham BJ, Zhang LN, Weintraub AS, Schuijers J, Lee TI, Zhao K, et al. 2014. Control of cell identity genes occurs in insulated neighborhoods in mammalian chromosomes. Cell 159: 374–387. [DOI] [PMC free article] [PubMed] [Google Scholar]
- Dutkowski J, Kramer M, Surma MA, Balakrishnan R, Cherry JM, Krogan NJ, Ideker T. 2013. A gene ontology inferred from molecular networks. Nat Biotechnol 31: 38–45. [DOI] [PMC free article] [PubMed] [Google Scholar]
- Farh KK-H, Marson A, Zhu J, Kleinewietfeld M, Housley WJ, Beik S, Shoresh N, Whitton H, Ryan RJH, Shishkin AA, et al. 2015. Genetic and epigenetic fine mapping of causal autoimmune disease variants. Nature 518: 337–343. [DOI] [PMC free article] [PubMed] [Google Scholar]
- Ferri ALM. 2004. Sox2 deficiency causes neurodegeneration and impaired neurogenesis in the adult mouse brain. Development 131: 3805–3819. [DOI] [PubMed] [Google Scholar]
- French JD, Ghoussaini M, Edwards SL, Meyer KB, Michailidou K, Ahmed S, Khan S, Maranian MJ, O'Reilly M, Hillman KM, et al. 2013. Functional variants at the 11q13 risk locus for breast cancer regulate cyclin D1 expression through long-range enhancers. Am J Hum Genet 92: 489–503. [DOI] [PMC free article] [PubMed] [Google Scholar]
- Gerstein MB, Kundaje A, Hariharan M, Landt SG, Yan K-K, Cheng C, Mu XJ, Khurana E, Rozowsky J, Alexander R, et al. 2012. Architecture of the human regulatory network derived from ENCODE data. Nature 489: 91–100. [DOI] [PMC free article] [PubMed] [Google Scholar]
- Gertz J, Savic D, Varley KE, Partridge EC, Safi A, Jain P, Cooper GM, Reddy TE, Crawford GE, Myers RM. 2013. Distinct properties of cell-type-specific and shared transcription factor binding sites. Mol Cell 52: 25–36. [DOI] [PMC free article] [PubMed] [Google Scholar]
- Gifford CA, Ziller MJ, Gu H, Trapnell C, Donaghey J, Tsankov A, Shalek AK, Kelley DR, Shishkin AA, Issner R, et al. 2013. Transcriptional and epigenetic dynamics during specification of human embryonic stem cells. Cell 153: 1149–1163. [DOI] [PMC free article] [PubMed] [Google Scholar]
- Graf T, Enver T. 2009. Forcing cells to change lineages. Nature 462: 587–594. [DOI] [PubMed] [Google Scholar]
- Graham V, Khudyakov J, Ellis P, Pevny L. 2003. SOX2 functions to maintain neural progenitor identity. Neuron 39: 749–765. [DOI] [PubMed] [Google Scholar]
- Grant CE, Bailey TL, Noble WS. 2011. FIMO: scanning for occurrences of a given motif. Bioinformatics 27: 1017–1018. [DOI] [PMC free article] [PubMed] [Google Scholar]
- Guo G, Smith A. 2010. A genome-wide screen in EpiSCs identifies Nr5a nuclear receptors as potent inducers of ground state pluripotency. Development 137: 3185–3192. [DOI] [PMC free article] [PubMed] [Google Scholar]
- Hawkins RD, Hon GC, Yang C, Antosiewicz-Bourget JE, Lee LK, Ngo Q-M, Klugman S, Ching KA, Edsall LE, Ye Z, et al. 2011. Dynamic chromatin states in human ES cells reveal potential regulatory sequences and genes involved in pluripotency. Cell Res 21: 1393–1409. [DOI] [PMC free article] [PubMed] [Google Scholar]
- Hnisz D, Abraham BJ, Lee TI, Lau A, Saint-André V, Sigova AA, Hoke HA, Young RA. 2013. Super-enhancers in the control of cell identity and disease. Cell 155: 934–947. [DOI] [PMC free article] [PubMed] [Google Scholar]
- Hnisz D, Schuijers J, Lin CY, Weintraub AS, Abraham BJ, Lee TI, Bradner JE, Young RA. 2015. Convergence of developmental and oncogenic signaling pathways at transcriptional super-enhancers. Mol Cell 58: 362–370. [DOI] [PMC free article] [PubMed] [Google Scholar]
- Holst F, Stahl PR, Ruiz C, Hellwinkel O, Jehan Z, Wendland M, Lebeau A, Terracciano L, Al-Kuraya K, Jänicke F, et al. 2007. Estrogen receptor α (ESR1) gene amplification is frequent in breast cancer. Nat Genet 39: 655–660. [DOI] [PubMed] [Google Scholar]
- Horb ME, Shen CN, Tosh D, Slack JMW. 2003. Experimental conversion of liver to pancreas. Curr Biol 13: 105–115. [DOI] [PubMed] [Google Scholar]
- Hume MA, Barrera LA, Gisselbrecht SS, Bulyk ML. 2015. UniPROBE, update 2015: new tools and content for the online database of protein-binding microarray data on protein–DNA interactions. Nucleic Acids Res 43: D117–D122. [DOI] [PMC free article] [PubMed] [Google Scholar]
- Ieda M, Fu J-D, Delgado-Olguin P, Vedantham V, Hayashi Y, Bruneau BG, Srivastava D. 2010. Direct reprogramming of fibroblasts into functional cardiomyocytes by defined factors. Cell 142: 375–386. [DOI] [PMC free article] [PubMed] [Google Scholar]
- Jaenisch R, Young R. 2008. Stem cells, the molecular circuitry of pluripotency and nuclear reprogramming. Cell 132: 567–582. [DOI] [PMC free article] [PubMed] [Google Scholar]
- Jolma A, Yan J, Whitington T, Toivonen J, Nitta KR, Rastas P, Morgunova E, Enge M, Taipale M, Wei G, et al. 2013. DNA-binding specificities of human transcription factors. Cell 152: 327–339. [DOI] [PubMed] [Google Scholar]
- Jonsson J, Carlsson L, Edlund T, Edlund H. 1994. Insulin-promoter-factor 1 is required for pancreas development in mice. Nature 371: 606–609. [DOI] [PubMed] [Google Scholar]
- Kagey MH, Newman JJ, Bilodeau S, Zhan Y, Orlando DA, van Berkum NL, Ebmeier CC, Goossens J, Rahl PB, Levine SS, et al. 2010. Mediator and cohesin connect gene expression and chromatin architecture. Nature 467: 430–435. [DOI] [PMC free article] [PubMed] [Google Scholar]
- Kanehisa M, Goto S, Sato Y, Furumichi M, Tanabe M. 2012. KEGG for integration and interpretation of large-scale molecular data sets. Nucleic Acids Res 40: D109–D114. [DOI] [PMC free article] [PubMed] [Google Scholar]
- Kemmeren P, Sameith K, van de Pasch LAL, Benschop JJ, Lenstra TL, Margaritis T, O'Duibhir E, Apweiler E, van Wageningen S, Ko CW, et al. 2014. Large-scale genetic perturbations reveal regulatory networks and an abundance of gene-specific repressors. Cell 157: 740–752. [DOI] [PubMed] [Google Scholar]
- Kertesz M, Iovino N, Unnerstall U, Gaul U, Segal E. 2007. The role of site accessibility in microRNA target recognition. Nat Genet 39: 1278–1284. [DOI] [PubMed] [Google Scholar]
- Krebs HA. 1940. The citric acid cycle and the Szent-Györgyi cycle in pigeon breast muscle. Biochem J 34: 775–779. [DOI] [PMC free article] [PubMed] [Google Scholar]
- Kumar RM, Cahan P, Shalek AK, Satija R, Jay DaleyKeyser A, Li H, Zhang J, Pardee K, Gennert D, Trombetta JJ, et al. 2014. Deconstructing transcriptional heterogeneity in pluripotent stem cells. Nature 516: 56–61. [DOI] [PMC free article] [PubMed] [Google Scholar]
- Kunarso G, Chia N-Y, Jeyakani J, Hwang C, Lu X, Chan Y-S, Ng H-H, Bourque G. 2010. Transposable elements have rewired the core regulatory network of human embryonic stem cells. Nat Genet 42: 631–634. [DOI] [PubMed] [Google Scholar]
- Kuroda T, Tada M, Kubota H, Kimura H, Hatano S, Suemori H, Nakatsuji N, Tada T. 2005. Octamer and Sox elements are required for transcriptional cis regulation of Nanog gene expression. Mol Cell Biol 25: 2475–2485. [DOI] [PMC free article] [PubMed] [Google Scholar]
- Kuzmichev AN, Kim S-K, D'Alessio AC, Chenoweth JG, Wittko IM, Campanati L, McKay RD. 2012. Sox2 acts through Sox21 to regulate transcription in pluripotent and differentiated cells. Curr Biol 22: 1705–1710. [DOI] [PubMed] [Google Scholar]
- Kwiatkowski N, Zhang T, Rahl PB, Abraham BJ, Reddy J, Ficarro SB, Dastur A, Amzallag A, Ramaswamy S, Tesar B, et al. 2014. Targeting transcription regulation in cancer with a covalent CDK7 inhibitor. Nature 511: 616–620. [DOI] [PMC free article] [PubMed] [Google Scholar]
- Lee TI, Young RA. 2013. Transcriptional regulation and its misregulation in disease. Cell 152: 1237–1251. [DOI] [PMC free article] [PubMed] [Google Scholar]
- Lee TI, Rinaldi NJ, Robert F, Odom DT, Bar-Joseph Z, Gerber GK, Hannett NM, Harbison CT, Thompson CM, Simon I, et al. 2002. Transcriptional regulatory networks in Saccharomyces cerevisiae. Science 298: 799–804. [DOI] [PubMed] [Google Scholar]
- Lefebvre C, Rajbhandari P, Alvarez MJ, Bandaru P, Lim WK, Sato M, Wang K, Sumazin P, Kustagi M, Bisikirska BC, et al. 2010. A human B-cell interactome identifies MYB and FOXM1 as master regulators of proliferation in germinal centers. Mol Syst Biol 6: 377. [DOI] [PMC free article] [PubMed] [Google Scholar]
- Levine M, Cattoglio C, Tjian R. 2014. Looping back to leap forward: transcription enters a new era. Cell 157: 13–25. [DOI] [PMC free article] [PubMed] [Google Scholar]
- Lewis BP, Burge CB, Bartel DP. 2005. Conserved seed pairing, often flanked by adenosines, indicates that thousands of human genes are microRNA targets. Cell 120: 15–20. [DOI] [PubMed] [Google Scholar]
- Li Y, Lv Z, He G, Wang J, Zhang X, Lu G, Ren X, Wang F, Zhu X, Ding Y, et al. 2015. The SOX17/miR-371-5p/SOX2 axis inhibits EMT, stem cell properties and metastasis in colorectal cancer. Oncotarget 6: 9099–9112. [DOI] [PMC free article] [PubMed] [Google Scholar]
- Lieu YK, Reddy EP. 2009. Conditional c-myb knockout in adult hematopoietic stem cells leads to loss of self-renewal due to impaired proliferation and accelerated differentiation. Proc Natl Acad Sci 106: 21689–21694. [DOI] [PMC free article] [PubMed] [Google Scholar]
- Lim LS, Loh Y-H, Zhang W, Li Y, Chen X, Wang Y, Bakre M, Ng H-H, Stanton LW. 2007. Zic3 is required for maintenance of pluripotency in embryonic stem cells. Mol Biol Cell 18: 1348–1358. [DOI] [PMC free article] [PubMed] [Google Scholar]
- Loft A, Forss I, Siersbæk MS, Schmidt SF, Larsen A-SB, Madsen JGS, Pisani DF, Nielsen R, Aagaard MM, Mathison A, et al. 2015. Browning of human adipocytes requires KLF11 and reprogramming of PPARγ superenhancers. Genes Dev 29: 7–22. [DOI] [PMC free article] [PubMed] [Google Scholar]
- Loh Y-H, Wu Q, Chew J-L, Vega VB, Zhang W, Chen X, Bourque G, George J, Leong B, Liu J, et al. 2006. The Oct4 and Nanog transcription network regulates pluripotency in mouse embryonic stem cells. Nat Genet 38: 431–440. [DOI] [PubMed] [Google Scholar]
- Lovén J, Hoke HA, Lin CY, Lau A, Orlando DA, Vakoc CR, Bradner JE, Lee TI, Young RA. 2013. Selective inhibition of tumor oncogenes by disruption of super-enhancers. Cell 153: 320–334. [DOI] [PMC free article] [PubMed] [Google Scholar]
- Lujan E, Chanda S, Ahlenius H, Südhof TC, Wernig M. 2012. Direct conversion of mouse fibroblasts to self-renewing, tripotent neural precursor cells. Proc Natl Acad Sci 109: 2527–2532. [DOI] [PMC free article] [PubMed] [Google Scholar]
- Mansour MR, Abraham BJ, Anders L, Berezovskaya A, Gutierrez A, Durbin AD, Etchin J, Lawton L, Sallan SE, Silverman LB, et al. 2014. An oncogenic super-enhancer formed through somatic mutation of a noncoding intergenic element. Science 346: 1373–1377. [DOI] [PMC free article] [PubMed] [Google Scholar]
- Masui S, Nakatake Y, Toyooka Y, Shimosato D, Yagi R, Takahashi K, Okochi H, Okuda A, Matoba R, Sharov AA, et al. 2007. Pluripotency governed by Sox2 via regulation of Oct3/4 expression in mouse embryonic stem cells. Nat Cell Biol 9: 625–635. [DOI] [PubMed] [Google Scholar]
- Mathelier A, Zhao X, Zhang AW, Parcy F, Worsley-Hunt R, Arenillas DJ, Buchman S, Chen C, Chou A, Ienasescu H, et al. 2014. JASPAR 2014: an extensively expanded and updated open-access database of transcription factor binding profiles. Nucleic Acids Res 42: D142–D147. [DOI] [PMC free article] [PubMed] [Google Scholar]
- Matys V, Kel-Margoulis OV, Fricke E, Liebich I, Land S, Barre-Dirrie A, Reuter I, Chekmenev D, Krull M, Hornischer K, et al. 2006. TRANSFAC and its module TRANSCompel: transcriptional gene regulation in eukaryotes. Nucleic Acids Res 34: D108–D110. [DOI] [PMC free article] [PubMed] [Google Scholar]
- Maurano MT, Humbert R, Rynes E, Thurman RE, Haugen E, Wang H, Reynolds AP, Sandstrom R, Qu H, Brody J, et al. 2012. Systematic localization of common disease-associated variation in regulatory DNA. Science 337: 1190–1195. [DOI] [PMC free article] [PubMed] [Google Scholar]
- Medeiros LA, Dennis LM, Gill ME, Houbaviy H, Markoulaki S, Fu D, White AC, Kirak O, Sharp PA, Page DC, et al. 2011. Mir-290–295 deficiency in mice results in partially penetrant embryonic lethality and germ cell defects. Proc Natl Acad Sci 108: 14163–14168. [DOI] [PMC free article] [PubMed] [Google Scholar]
- Mitsui K, Tokuzawa Y, Itoh H, Segawa K, Murakami M, Takahashi K, Maruyama M, Maeda M, Yamanaka S. 2003. The homeoprotein Nanog is required for maintenance of pluripotency in mouse epiblast and ES cells. Cell 113: 631–642. [DOI] [PubMed] [Google Scholar]
- Morris SA, Daley GQ. 2013. A blueprint for engineering cell fate: current technologies to reprogram cell identity. Cell Res 23: 33–48. [DOI] [PMC free article] [PubMed] [Google Scholar]
- Nam Y-J, Lubczyk C, Bhakta M, Zang T, Fernandez-Perez A, McAnally J, Bassel-Duby R, Olson EN, Munshi NV. 2014. Induction of diverse cardiac cell types by reprogramming fibroblasts with cardiac transcription factors. Development 141: 4267–4278. [DOI] [PMC free article] [PubMed] [Google Scholar]
- Navarro P, Festuccia N, Colby D, Gagliardi A, Mullin NP, Zhang W, Karwacki-Neisius V, Osorno R, Kelly D, Robertson M, et al. 2012. OCT4/SOX2-independent Nanog autorepression modulates heterogeneous Nanog gene expression in mouse ES cells. EMBO J 31: 4547–4562. [DOI] [PMC free article] [PubMed] [Google Scholar]
- Neph S, Stergachis AB, Reynolds A, Sandstrom R, Borenstein E, Stamatoyannopoulos JA. 2012. Circuitry and dynamics of human transcription factor regulatory networks. Cell 150: 1274–1286. [DOI] [PMC free article] [PubMed] [Google Scholar]
- Nichols J, Zevnik B, Anastassiadis K, Niwa H, Klewe-Nebenius D, Chambers I, Schöler H, Smith A. 1998. Formation of pluripotent stem cells in the mammalian embryo depends on the POU transcription factor Oct4. Cell 95: 379–391. [DOI] [PubMed] [Google Scholar]
- Niwa H, Miyazaki J, Smith AG. 2000. Quantitative expression of Oct-3/4 defines differentiation, dedifferentiation or self-renewal of ES cells. Nat Genet 24: 372–376. [DOI] [PubMed] [Google Scholar]
- Novershtern N, Subramanian A, Lawton LN, Mak RH, Haining WN, McConkey ME, Habib N, Yosef N, Chang CY, Shay T, et al. 2011. Densely interconnected transcriptional circuits control cell states in human hematopoiesis. Cell 144: 296–309. [DOI] [PMC free article] [PubMed] [Google Scholar]
- Odom DT, Zizlsperger N, Gordon DB, Bell GW, Rinaldi NJ, Murray HL, Volkert TL, Schreiber J, Rolfe PA, Gifford DK, et al. 2004. Control of pancreas and liver gene expression by HNF transcription factors. Science 303: 1378–1381. [DOI] [PMC free article] [PubMed] [Google Scholar]
- Odom DT, Dowell RD, Jacobsen ES, Nekludova L, Rolfe PA, Danford TW, Gifford DK, Fraenkel E, Bell GI, Young RA. 2006. Core transcriptional regulatory circuitry in human hepatocytes. Mol Syst Biol 2: 2006.0017. [DOI] [PMC free article] [PubMed] [Google Scholar]
- Okumura-Nakanishi S, Saito M, Niwa H, Ishikawa F. 2005. Oct-3/4 and Sox2 regulate Oct-3/4 gene in embryonic stem cells. J Biol Chem 280: 5307–5317. [DOI] [PubMed] [Google Scholar]
- Palii CG, Perez-Iratxeta C, Yao Z, Cao Y, Dai F, Davison J, Atkins H, Allan D, Dilworth FJ, Gentleman R, et al. 2011. Differential genomic targeting of the transcription factor TAL1 in alternate haematopoietic lineages. EMBO J 30: 494–509. [DOI] [PMC free article] [PubMed] [Google Scholar]
- Parker SCJ, Stitzel ML, Taylor DL, Orozco JM, Erdos MR, Akiyama JA, van Bueren KL, Chines PS, Narisu N, Black BL, et al. 2013. Chromatin stretch enhancer states drive cell-specific gene regulation and harbor human disease risk variants. Proc Natl Acad Sci 110: 17921–17926. [DOI] [PMC free article] [PubMed] [Google Scholar]
- Peter IS, Faure E, Davidson EH. 2012. Predictive computation of genomic logic processing functions in embryonic development. Proc Natl Acad Sci 109: 16434–16442. [DOI] [PMC free article] [PubMed] [Google Scholar]
- Pique-Regi R, Degner JF, Pai AA, Gaffney DJ, Gilad Y, Pritchard JK. 2011. Accurate inference of transcription factor binding from DNA sequence and chromatin accessibility data. Genome Res 21: 447–455. [DOI] [PMC free article] [PubMed] [Google Scholar]
- Quintana AM, Zhou YE, Pena JJ, O'Rourke JP, Ness SA. 2011. Dramatic repositioning of c-Myb to different promoters during the cell cycle observed by combining cell sorting with chromatin immunoprecipitation. PLoS One 6: e17362. [DOI] [PMC free article] [PubMed] [Google Scholar]
- Rajapakse I, Perlman MD, Scalzo D, Kooperberg C, Groudine M, Kosak ST. 2009. The emergence of lineage-specific chromosomal topologies from coordinate gene regulation. Proc Natl Acad Sci 106: 6679–6684. [DOI] [PMC free article] [PubMed] [Google Scholar]
- Robasky K, Bulyk ML. 2011. UniPROBE, update 2011: expanded content and search tools in the online database of protein-binding microarray data on protein–DNA interactions. Nucleic Acids Res 39: D124–D128. [DOI] [PMC free article] [PubMed] [Google Scholar]
- Rodda DJ, Chew J-L, Lim L-H, Loh Y-H, Wang B, Ng H-H, Robson P. 2005. Transcriptional regulation of Nanog by OCT4 and SOX2. J Biol Chem 280: 24731–24737. [DOI] [PubMed] [Google Scholar]
- Roeder RG. 2005. Transcriptional regulation and the role of diverse coactivators in animal cells. FEBS Lett 579: 909–915. [DOI] [PubMed] [Google Scholar]
- Rolland T, Taşan M, Charloteaux B, Pevzner SJ, Zhong Q, Sahni N, Yi S, Lemmens I, Fontanillo C, Mosca R, et al. 2014. A proteome-scale map of the human interactome network. Cell 159: 1212–1226. [DOI] [PMC free article] [PubMed] [Google Scholar]
- Sanda T, Lawton LN, Barrasa MI, Fan ZP, Kohlhammer H, Gutierrez A, Ma W, Tatarek J, Ahn Y, Kelliher MA, et al. 2012. Core transcriptional regulatory circuit controlled by the TAL1 complex in human T cell acute lymphoblastic leukemia. Cancer Cell 22: 209–221. [DOI] [PMC free article] [PubMed] [Google Scholar]
- Schmidt SF, Larsen BD, Loft A, Nielsen R, Madsen JGS, Mandrup S. 2015. Acute TNF-induced repression of cell identity genes is mediated by NFκB-directed redistribution of cofactors from super-enhancers. Genome Res 25: 1281–1294. [DOI] [PMC free article] [PubMed] [Google Scholar]
- Siersbæk R, Baek S, Rabiee A, Nielsen R, Traynor S, Clark N, Sandelin A, Jensen ON, Sung M-H, Hager GL, et al. 2014a. Molecular architecture of transcription factor hotspots in early adipogenesis. Cell Rep 7: 1434–1442. [DOI] [PMC free article] [PubMed] [Google Scholar]
- Siersbæk R, Rabiee A, Nielsen R, Sidoli S, Traynor S, Loft A, La Cour Poulsen L, Rogowska-Wrzesinska A, Jensen ON, Mandrup S. 2014b. Transcription factor cooperativity in early adipogenic hotspots and super-enhancers. Cell Rep 7: 1443–1455. [DOI] [PubMed] [Google Scholar]
- Silva J, Nichols J, Theunissen TW, Guo G, van Oosten AL, Barrandon O, Wray J, Yamanaka S, Chambers I, Smith A. 2009. Nanog is the gateway to the pluripotent ground state. Cell 138: 722–737. [DOI] [PMC free article] [PubMed] [Google Scholar]
- Sisodiya SM, Ragge NK, Cavalleri GL, Hever A, Lorenz B, Schneider A, Williamson KA, Stevens JM, Free SL, Thompson PJ, et al. 2006. Role of SOX2 mutations in human hippocampal malformations and epilepsy. Epilepsia 47: 534–542. [DOI] [PubMed] [Google Scholar]
- Song K, Nam Y-J, Luo X, Qi X, Tan W, Huang GN, Acharya A, Smith CL, Tallquist MD, Neilson EG, et al. 2012. Heart repair by reprogramming non-myocytes with cardiac transcription factors. Nature 485: 599–604. [DOI] [PMC free article] [PubMed] [Google Scholar]
- Spitz F, Furlong EEM. 2012. Transcription factors: from enhancer binding to developmental control. Nat Rev Genet 13: 613–626. [DOI] [PubMed] [Google Scholar]
- Stergachis AB, Neph S, Sandstrom R, Haugen E, Reynolds AP, Zhang M, Byron R, Canfield T, Stelhing-Sun S, Lee K, et al. 2014. Conservation of trans-acting circuitry during mammalian regulatory evolution. Nature 515: 365–370. [DOI] [PMC free article] [PubMed] [Google Scholar]
- Sur IK, Hallikas O, Vähärautio A, Yan J, Turunen M, Enge M, Taipale M, Karhu A, Aaltonen LA, Taipale J. 2012. Mice lacking a Myc enhancer that includes human SNP rs6983267 are resistant to intestinal tumors. Science 338: 1360–1363. [DOI] [PubMed] [Google Scholar]
- Takahashi K, Yamanaka S. 2006. Induction of pluripotent stem cells from mouse embryonic and adult fibroblast cultures by defined factors. Cell 126: 663–676. [DOI] [PubMed] [Google Scholar]
- Theunissen TW, van Oosten AL, Castelo-Branco G, Hall J, Smith A, Silva JCR. 2011. Nanog overcomes reprogramming barriers and induces pluripotency in minimal conditions. Curr Biol 21: 65–71. [DOI] [PMC free article] [PubMed] [Google Scholar]
- Tomioka M, Nishimoto M, Miyagi S, Katayanagi T, Fukui N, Niwa H, Muramatsu M, Okuda A. 2002. Identification of Sox-2 regulatory region which is under the control of Oct-3/4–Sox-2 complex. Nucleic Acids Res 30: 3202–3213. [DOI] [PMC free article] [PubMed] [Google Scholar]
- Tsankov AM, Gu H, Akopian V, Ziller MJ, Donaghey J, Amit I, Gnirke A, Meissner A. 2015. Transcription factor binding dynamics during human ES cell differentiation. Nature 518: 344–349. [DOI] [PMC free article] [PubMed] [Google Scholar]
- Tuupanen S, Turunen M, Lehtonen R, Hallikas O, Vanharanta S, Kivioja T, Björklund M, Wei G, Yan J, Niittymäki I, et al. 2009. The common colorectal cancer predisposition SNP rs6983267 at chromosome 8q24 confers potential to enhanced Wnt signaling. Nat Genet 41: 885–890. [DOI] [PubMed] [Google Scholar]
- Usary J, Llaca V, Karaca G, Presswala S, Karaca M, He X, Langerød A, Kåresen R, Oh DS, Dressler LG, et al. 2004. Mutation of GATA3 in human breast tumors. Oncogene 23: 7669–7678. [DOI] [PubMed] [Google Scholar]
- Van den Boogaard M, Wong LYE, Tessadori F, Bakker ML, Dreizehnter LK, Wakker V, Bezzina CR, ’t Hoen PAC, Bakkers J, Barnett P, et al. 2012. Genetic variation in T-box binding element functionally affects SCN5A/SCN10A enhancer. J Clin Invest 122: 2519–2530. [DOI] [PMC free article] [PubMed] [Google Scholar]
- Vaquerizas JM, Kummerfeld SK, Teichmann SA, Luscombe NM. 2009. A census of human transcription factors: function, expression and evolution. Nat Rev Genet 10: 252–263. [DOI] [PubMed] [Google Scholar]
- Wang W, Yang J, Liu H, Lu D, Chen X, Zenonos Z, Campos LS, Rad R, Guo G, Zhang S, et al. 2011. Rapid and efficient reprogramming of somatic cells to induced pluripotent stem cells by retinoic acid receptor γ and liver receptor homolog 1. Proc Natl Acad Sci 108: 18283–18288. [DOI] [PMC free article] [PubMed] [Google Scholar]
- Wei G-H, Badis G, Berger MF, Kivioja T, Palin K, Enge M, Bonke M, Jolma A, Varjosalo M, Gehrke AR, et al. 2010. Genome-wide analysis of ETS-family DNA-binding in vitro and in vivo. EMBO J 29: 2147–2160. [DOI] [PMC free article] [PubMed] [Google Scholar]
- White JR, Weston K. 2000. Myb is required for self-renewal in a model system of early hematopoiesis. Oncogene 19: 1196–1205. [DOI] [PubMed] [Google Scholar]
- Whyte WA, Orlando DA, Hnisz D, Abraham BJ, Lin CY, Kagey MH, Rahl PB, Lee TI, Young RA. 2013. Master transcription factors and mediator establish super-enhancers at key cell identity genes. Cell 153: 307–319. [DOI] [PMC free article] [PubMed] [Google Scholar]
- Wong N, Wang X. 2015. miRDB: an online resource for microRNA target prediction and functional annotations. Nucleic Acids Res 43: D146–D152. [DOI] [PMC free article] [PubMed] [Google Scholar]
- Yan J, Enge M, Whitington T, Dave K, Liu J, Sur I, Schmierer B, Jolma A, Kivioja T, Taipale M, et al. 2013. Transcription factor binding in human cells occurs in dense clusters formed around cohesin anchor sites. Cell 154: 801–813. [DOI] [PubMed] [Google Scholar]
- Yang H-M, Do H-J, Kim D-K, Park J-K, Chang W-K, Chung H-M, Choi S-Y, Kim J-H. 2007. Transcriptional regulation of human Oct4 by steroidogenic factor-1. J Cell Biochem 101: 1198–1209. [DOI] [PubMed] [Google Scholar]
- Yosef N, Shalek AK, Gaublomme JT, Jin H, Lee Y, Awasthi A, Wu C, Karwacz K, Xiao S, Jorgolli M, et al. 2013. Dynamic regulatory network controlling TH17 cell differentiation. Nature 496: 461–468. [DOI] [PMC free article] [PubMed] [Google Scholar]
- Young RA. 2011. Control of the embryonic stem cell state. Cell 144: 940–954. [DOI] [PMC free article] [PubMed] [Google Scholar]
- Yu J, Vodyanik MA, Smuga-Otto K, Antosiewicz-Bourget J, Frane JL, Tian S, Nie J, Jonsdottir GA, Ruotti V, Stewart R, et al. 2007. Induced pluripotent stem cell lines derived from human somatic cells. Science 318: 1917–1920. [DOI] [PubMed] [Google Scholar]
- Zhang Y, Liu T, Meyer CA, Eeckhoute J, Johnson DS, Bernstein BE, Nusbaum C, Myers RM, Brown M, Li W, et al. 2008. Model-based analysis of ChIP-Seq (MACS). Genome Biol 9: R137. [DOI] [PMC free article] [PubMed] [Google Scholar]
- Zhang X, Yalcin S, Lee D-F, Yeh T-YJ, Lee S-M, Su J, Mungamuri SK, Rimmelé P, Kennedy M, Sellers R, et al. 2011. FOXO1 is an essential regulator of pluripotency in human embryonic stem cells. Nat Cell Biol 13: 1092–1099. [DOI] [PMC free article] [PubMed] [Google Scholar]
- Zhong S, He X, Bar-Joseph Z. 2013. Predicting tissue specific transcription factor binding sites. BMC Genomics 14: 796. [DOI] [PMC free article] [PubMed] [Google Scholar]
- Zhou Q, Brown J, Kanarek A, Rajagopal J, Melton DA. 2008. In vivo reprogramming of adult pancreatic exocrine cells to β-cells. Nature 455: 627–632. [DOI] [PMC free article] [PubMed] [Google Scholar]
- Zhou Q, Li T, Price DH. 2012. RNA polymerase II elongation control. Annu Rev Biochem 81: 119–143. [DOI] [PMC free article] [PubMed] [Google Scholar]
- Zhu Y, Richardson JA, Parada LF, Graff JM. 1998. Smad3 mutant mice develop metastatic colorectal cancer. Cell 94: 703–714. [DOI] [PubMed] [Google Scholar]
- Ziller MJ, Edri R, Yaffe Y, Donaghey J, Pop R, Mallard W, Issner R, Gifford CA, Goren A, Xing J, et al. 2014. Dissecting neural differentiation regulatory networks through epigenetic footprinting. Nature 518: 355–359. [DOI] [PMC free article] [PubMed] [Google Scholar]
- Zuber J, Rappaport AR, Luo W, Wang E, Chen C, Vaseva AV, Shi J, Weissmueller S, Fellmann C, Fellman C, et al. 2011. An integrated approach to dissecting oncogene addiction implicates a Myb-coordinated self-renewal program as essential for leukemia maintenance. Genes Dev 25: 1628–1640. [DOI] [PMC free article] [PubMed] [Google Scholar]