

Abstract
Background
Intensive care unit (ICU) scoring systems or prediction models evolved to meet the desire of clinical and administrative leaders to assess the quality of care provided by their ICUs. The Critical Care Information System (CCIS) is province-wide data information for all Ontario, Canada level 3 and level 2 ICUs collected for this purpose. With the dataset, we developed a multivariable logistic regression ICU mortality prediction model during the first 24 h of ICU admission utilizing the explanatory variables including the two validated scores, Multiple Organs Dysfunctional Score (MODS) and Nine Equivalents Nursing Manpower Use Score (NEMS) followed by the variables age, sex, readmission to the ICU during the same hospital stay, admission diagnosis, source of admission, and the modified Charlson Co-morbidity Index (CCI) collected through the hospital health records.
Methods
This study is a single-center retrospective cohort review of 8822 records from the Critical Care Trauma Centre (CCTC) and Medical-Surgical Intensive Care Unit (MSICU) of London Health Sciences Centre (LHSC), Ontario, Canada between 1 Jan 2009 to 30 Nov 2012. Multivariable logistic regression on training dataset (n = 4321) was used to develop the model and validate by bootstrapping method on the testing dataset (n = 4501). Discrimination, calibration, and overall model performance were also assessed.
Results
The predictors significantly associated with ICU mortality included: age (p < 0.001), source of admission (p < 0.0001), ICU admitting diagnosis (p < 0.0001), MODS (p < 0.0001), and NEMS (p < 0.0001). The variables sex and modified CCI were not significantly associated with ICU mortality. The training dataset for the developed model has good discriminating ability between patients with high risk and those with low risk of mortality (c-statistic 0.787). The Hosmer and Lemeshow goodness-of-fit test has a strong correlation between the observed and expected ICU mortality (χ2 = 5.48; p > 0.31). The overall optimism of the estimation between the training and testing data set ΔAUC = 0.003, indicating a stable prediction model.
Conclusions
This study demonstrates that CCIS data available after the first 24 h of ICU admission at LHSC can be used to create a robust mortality prediction model with acceptable fit statistic and internal validity for valid benchmarking and monitoring ICU performance.
Electronic supplementary material
The online version of this article (doi:10.1186/s40560-016-0143-6) contains supplementary material, which is available to authorized users.
Keywords: Intensive care unit (ICU), Mortality, MODS, NEMS, Logistic regression, Hosmer and Lemeshow goodness-of-fit test
Background
Patients in the intensive care units (ICUs) have a heterogeneous disease processes and illness severity. Scoring systems developed for ICU patients were introduced 34 years ago with the goal of using physiologic data available at ICU admission to predict individual patient outcomes. Although these predictions have little utility for managing individual patients, they do provide a mechanism for assessing ICU performance by comparing the actual outcome in a given population to the expected outcome determined by the prediction algorithms. The scores that assess the disease severity on admission and are used to predict outcome include the Acute Physiology and Chronic Health Evaluation (APACHE) [1–3], the Simplified Acute Physiological Score (SAPS) [4], and the Mortality Prediction Model (MPM) [5]. The organ dysfunction scores that assess the presence and severity of organ dysfunction include the Multiple Organ Dysfunction Score (MODS) [6] and Sequential Organ Failure Assessment (SOFA) [7]. The score that assesses nursing workload is the Therapeutic Intervention Scoring System (TISS) [8], and the Nine Equivalents of Nursing Manpower Use Score (NEMS) [9] (Additional file 1: Table S1) assesses ICU resource utilization and efficiency. Many of these measurement systems involve resource-intensive data collection.
In 2007, the Critical Care Services Ontario (CCSO), a division of the Ontario Ministry of Health and Long Term Care, developed the Critical Care Information System (CCIS). The purpose of CCIS is to provide the Ministry, Local Health Integration Networks (LHINs) and hospitals with information on bed availability, critical care utilization, and patient outcomes. The CCIS uses a web-based application to collect real-time information on every patient admitted to a critical care unit in Ontario acute care hospitals. Data captured includes, but it is not limited to the following: demographics, admission and discharge details, MODS on admission, daily NEMS, and patient outcomes such as ICU mortality and other outcomes associated with quality of care.
The MODS is an objective scale that quantifies the severity of multiple organ dysfunction for patients admitted to critical care. The score reflects six major organ systems and the specific physiological data associated with each system [6]. A total of 0–4 points are assigned to each system, where a score of 0 is normal and 4 is the most dysfunctional to give a total maximum score of 24. MODS was not designed to predict mortality, but an increasing MODS does correlate with ICU outcome [6].
The NEMS was developed from the TISS-28 score and is a less complicated and is more widely used to measure resource utilization in critical care [10]. The score is determined based on the need for any of the nine life support interventions. A weighted point is awarded to each of the nine categories to give a maximum score of 56. NEMS has been validated in large cohorts of ICU patients and is easy to use with minimum inter-observer variability [11]. It has been utilized to classify the different levels of ICUs based on nursing workload efficacy as distinguished from the amount of care being provided.
In an effort to help hospitals analyze and interpret their data, CCSO produces and distributes quarterly reports that include a multitude of utilization and quality indicators of which one is ICU mortality. This data is presented in a manner that promotes benchmarking, but there is currently no means of risk adjustment to ensure that units are comparing themselves to centers with similar case mix and illness severity. Review of these reports shows that there are units with direct correlation of higher mean MODS and ICU mortality, but this is not always the case. There are units with similar MODS but differing mortality rates. The objective of this study is to investigate if existing CCIS data collected by the Critical Care Trauma Center (CCTC) and Medical-Surgical Intensive Care Unit (MSICU) of London Health Sciences Centre (LHSC) can be used to develop and validate an acceptable ICU mortality prediction model that might improve current performance measurement reporting.
Methods
Study design and patient population
This is a retrospective study of two adult intensive care units at the LHSC, an academic teaching facility, affiliated with The University of Western Ontario. The CCTC is a 30-bed general medical, surgical, trauma, and oncological unit, and the MSICU is a 25-bed unit that specializes in the care of various patient populations including neurosurgical, cardiovascular surgery, and transplantation patients. In both units, the care is provided by multidisciplinary teams of professional health care providers and is directed by physicians that have specialty training in critical care. This study was approved by the Western Health Research Ethic Board on 13 Nov 2013, IRB 00000940.
Between 1 Jan 2009 to 30 Nov 2012, data was prospectively collected on 4784 admissions to the CCTC and 4297 admissions to the MSICU. The primary endpoint of this study is to develop a mortality prediction model utilizing the available data from CCIS during the first 24-h ICU admission.
Data sources
Relevant data from both units was exported from CCIS. Comorbidities are not included in CCIS but it is important because it may delay diagnosis, influence treatment decision, are related to complications, may influence chances of survival, and can confound analysis [12]. Based on the APACHE II mortality prediction model, comorbidities can reflect diminished physiological reserve; thus, it is important to incorporate past relevant medical/surgical history into a mortality prediction model. All Canadian hospitals submit information to the Canadian Institute of Health Information (CIHI) which is an independent, not-for-profit corporation that aims to contribute to the improvement of the health of Canadians and the health care system by disseminating quality health information. The CIHI utilizes the Charlson Comorbidity Index (CCI) as their measure of comorbidity [13] which has been shown to be highly associated with 1-year patient mortality and has been widely used in clinical research [14]. To obtain comorbidities for the prediction model, the ICD-10-CA data for patients admitted to either of the critical care units during the time frame of interest was obtained from the LHSC Health Records Department and only type 1 diagnoses, which specifically refer to pre-admission comorbidity was utilized.
Data management
The data from CCIS was exported in three parts. The reference dataset (N = 9081) contains demographic, admit/discharge date and time, admitting diagnosis, and the source of admission of the patients. The second part of the data is the MODS score on the day of admission to the ICU, and the third part of the data is the NEMS score on the day of admission to the ICU. The medical record number (MRN) and ICU admission date were used as the common linking variables to merge the MODS and NEMS data with the reference data into one file. Merging the reference dataset with the MODS dataset resulted in 8953 records, followed by merging with the NEMS dataset that resulted in 8924 records. There were a total of 157 (1.73 % of the original dataset) records missing. To obtain the ICD-10-CA data to calculate the modified CCS, the reference dataset was forwarded to the LHSC Records Department. A total of 8898 records were matched from Health Records, of which 183 records (2 % of the original dataset) from the CCIS dataset were not matched with the hospital records. This is likely due to error in the MRN number and/or failure to capture the ICU admission during discharge coding. Programmed SAS codes were created to extract only the type 1 diagnoses and calculation of the modified CCI score. Then, the dataset containing the modified CCI was combined with the final CCIS dataset (N = 8924) resulted in 8822 records for analysis, from which 2.9 % records were not captured from the original reference dataset, Fig. 1.
Fig. 1.
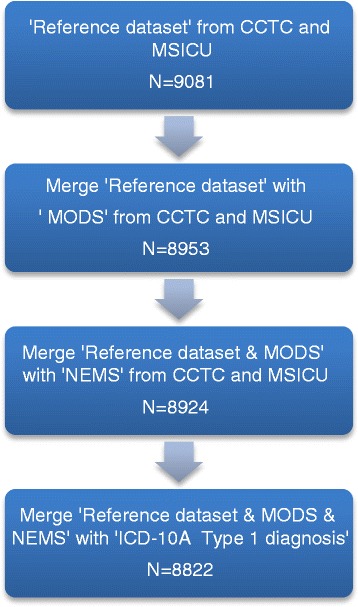
Data management flow chart. Reference admit/discharge dataset, N = 9081 records. Merged reference dataset with MODS and NEMS dataset resulted in N = 8924 records. Merged CCIS dataset (N = 8924) with type 1 diagnosis resulted final dataset for analysis, N = 8822 records. Total 2.9 % records were not matched
Covariates associated with ICU mortality
Based on the literature review, the covariates associated with risk of mortality upon admission to the ICU included age, gender, MODS, NEMS, CCI, source of admission, ICU admission diagnosis, and ICU readmission during the same hospital admission. The continuous, nominal, and ordinal data of the covariates are categorized accordingly (Additional file 2: Table S2). The variable threshold used to divide it into the groups for analysis was done using the mean value for each of the variables for survivors and non-survivors as a reference point. Then, through much iteration with SAS 9.3, the developed groups for each of the variables that give the best discriminatory performances and Hosmer and Lemeshow goodness-of-fit were utilized.
Statistical analysis
Univariate analysis was conducted for all baseline characteristics, and values were compared for survivors and non-survivors. For continuous variables, data are expressed as mean ± SD and comparisons conducted using the Student’s t test. For categorical variables, data are reported as proportions and comparison made using Pearson’s chi-square test. The prediction model for ICU mortality on admission was constructed by dividing the whole dataset into two random subgroups, “training” and “testing” set. To create the two random sample subgroups (training and testing set), the authors used the SAS 9.3 Ranuni function which generates a random number from a continuous uniform distribution with the interval (0,1) in which we used less than equal to 0.5 for group 1 and greater than 0.5 for group 2. Each 15th record will then be assigned to a random number. After assigning a random number to each record, it is then sorted in ascending or descending order of the random number assigned. A stepwise selection algorithm was also used to select from the eight covariates in the raw logistic regression prediction model. If the covariate significance was less than 0.05, it remained in the model; otherwise, the covariate exited the model. The remaining covariates were then fitted to a raw multivariable logistic regression model.
Often a predictive model’s estimate of these measures from the training set tends to overstate the predictive ability of the chosen model in another dataset. The amount of overestimation is referred to as the “optimism” of the estimate. To further obtain a valid criterion for the performance of the model, the logistic regression model then fit to the bootstrap sample and the corresponding value for the AUC was calculated. The fitted model was then applied to the original dataset, and the value of the AUC was recalculated. The differences in the values for the AUC provide an estimate of the optimism. This process is repeated 500 and 1000 times, and the results are averaged to provide a final bootstrap estimate for the optimism of the AUC.
The ability of the model to estimate mortality and agree with the actual outcome within groups of subjects of similar predicted risks by using the Hosmer and Lemeshow goodness-of-fit statistic obtained by grouping the subjects of the prediction model into k categories of percentiles. A good calibration is considered to be consistent with a small χ2 value for the Hosmer and Lemeshow test statistic.
All analyses were performed using SAS 9.3 (SAS Institute Inc., Cary, NC, USA). All tests presented are two-sided, and a p value <0.05 is considered significant.
Results
Table 1 compares the baseline characteristics for survivors and non-survivors in a cohort of 8822 subjects. There were 5037 (57.10 %) males with mean age 60.67 ± 17.19 and 3785 (42.90 %) females with mean age 61.16 ± 17.66 with no mortality differences between males and females (23.23 % vs. 22.17 %; p = 0.24) but, the mean age was higher for non-survivors than survivors (66.82 vs. 59.13; p < 0.0001). The admission sources with the highest mortality included the wards, emergency department, and other hospital transfers whereas patients admitted to critical care post-operatively had the lowest mortality (p < 0.0001). There was also a statistically significant association between ICU mortality and ICU admitting diagnosis (p < 0.0001) with cardiovascular/cardiac/vascular diseases having the highest mortality and gastrointestinal disease, the lowest. The MODS and NEMS scores were both significantly associated with ICU mortality (p < 0.0001) whereas the modified CCI did not have a statistically significant association between survivors and non-survivors, p = 0.74. There was also no significant difference in mortality for those re-admitted back to the ICU during the same hospital admission compared to those that were not readmitted (9.19 % vs. 9.01 %; p = 0.81.).
Table 1.
Baseline characteristics comparison between survivors and non-survivors of Critical Care Trauma Center (CCTC) and Medical-Surgical Intensive Care Unit (MSICU) at London Health Sciences Center (LHSC), between 1 Jan 2009 and 30 Nov 2012, N = 8822
| Baseline characteristics | Survivors, N (%) | Non-survivors, N (%) | p value |
|---|---|---|---|
| Total number of subjects | 6813 (77.23) | 2009 (22.77) | |
| Sex | 0.24 | ||
| Male | 3867 (56.76) | 1170 (58.24) | |
| Female | 2946 (43.24) | 839 (41.76) | |
| Age, mean ± SD | 59.13 ± 17.49 | 66.82 ± 15.67 | <0.0001 |
| Male ± SD | 58.94 ± 17.29 | 66.40 ± 15.55 | |
| Female ± SD | 59.38 ± 17.76 | 67.40 ± 15.81 | |
| 0–39 | 1067 (15.66) | 124 (6.17) | |
| 40–79 | 4972 (72.98) | 1452 (72.27) | |
| ≥ 80 | 774 (11.36) | 433 (21.55) | |
| Intensive care units | 0.06 | ||
| Critical Care Trauma Center (CCTC) | 3542 (51.99) | 1092 (54.36) | |
| Medical Surgical Intensive Care Unit (MSICU) | 3271 (48.01) | 917 (45.64) | |
| ICU admission source | <0.0001 | ||
| Operating room/post-anesthesia care unit | 1748 (25.66) | 191 (9.51) | |
| Hospital—outside or within LHIN | 1175 (17.25) | 389 (19.36) | |
| Emergency department | 1983 (29.11) | 624 (31.06) | |
| Other sourcea | 625 (9.18) | 195 (9.71) | |
| Unit/ward | 1280 (18.79) | 610 (30.36) | |
| ICU admission diagnosis | <0.0001 | ||
| Cardiovascular/cardiac/vascular | 895 (13.14) | 463 (23.05) | |
| Other diagnosisb | 1727 (25.35) | 353 (17.57) | |
| Gastrointestinal | 826 (83.94) | 158 (7.86) | |
| Respiratory | 2091 (30.69) | 655 (32.60) | |
| Trauma | 473 (6.94) | 106 (5.28) | |
| Neurological | 801 (11.76) | 274 (13.64) | |
| Multiple Organ Dysfunction Score (MODS) | <0.0001 | ||
| Mean MODS ± SD | 4.65 ± 2.96 | 7.01 ± 3.23 | |
| Minimum-maximum MODS | 0–19 | 0–20 | |
| 0 | 495 (7.27) | 25 (1.24) | |
| 1–4 | 3035 (44.55) | 450 (22.40) | |
| 5–8 | 2605 (38.24) | 930 (46.29) | |
| 9–12 | 591 (8.67) | 492 (24.49) | |
| > 13 | 87 (1.28) | 112 (5.57) | |
| Nine Equivalents Nursing Manpower Use Score (NEMS) | <0.0001 | ||
| Mean NEMS ± SD | 30.50 ± 8.45 | 36.64 ± 8.68 | |
| Minimum-maximum NEMS | 0–56 | 0–56 | |
| 0–22 | 990 (14.56) | 94 (4.68) | |
| 23–29 | 2458 (36.14) | 388 (19.31) | |
| ≥30 | 3353 (49.30) | 1527 (76.01) | |
| Modified Charlson’s Comorbidity Index(CCI) | 0.74 | ||
| Mean CCI ± SD | 1.30 ± 0.57 | 1.34 ± 0.61 | |
| Score 0 | 5148 (75.56) | 1461 (72.72) | |
| Score 1–3 | 1280 (18.79) | 405 (20.16) | |
| Score >3 | 385 (5.65) | 143 (7.12) | |
| Re-admission to ICU (same hospital admission) | 626 (9.19) | 181 (9.01) | 0.81 |
a Other Source includes patients admitted from the following locations: home—within or outside LHIN, level 2 unit or step-down unit, level 3 unit (medical/surgical or specialty unit), complex continuing care facility, rehabilitation facility, outside province, other
bOther diagnosis includes patients with the following diseases: metabolic/endocrine, genitourinary, musculoskeletal, skin, oncology, hematology, other
The baseline characteristics partitioned between the groups “training” and ‘testing’ sets were similar (Table 2). The total number of subjects in the training group was 4321 (48.98 %) as compared to 4501 (51.02 %) in the testing group. The combination of the patients from the two ICUs for each of the groups was evenly distributed between the two groups. In the training group, there were 2310 (53.46 %) subjects from CCTC and 2011 (46.54 %) from MSICU, while in the testing group, there were 2324 (51.63 %) from CCTC and 2177 (48.37 %) from MSICU.
Table 2.
Training (N = 4321) and validation (N = 4501) dataset baseline characteristics for Critical Care Trauma Center (CCTC) and Medical-Surgical Intensive Care Unit (MSICU) at London Health Sciences Center (LHSC)
| Baseline characteristics | Training, N (%) | Validation, N (%) |
|---|---|---|
| Total number of subjects | 4321 (48.98) | 4501 (51.02) |
| Sex | ||
| Male | 2475 (57.28) | 2562 (56.92) |
| Female | 1846 (42.72) | 1939 (43.08) |
| Age | ||
| 0–39 | 582 (13.47) | 609 (13.53) |
| 40–79 | 3146 (72.81) | 3278 (72.83) |
| ≥80 | 593 (13.72) | 614 (13.64) |
| ICU | ||
| Critical Care Trauma Unit(CCTC) | 2310 (53.46) | 2324 (51.63) |
| Medical and Surgical Intensive Care Unit(MSICU) | 2011 (46.54) | 2177 (48.37) |
| ICU admission source | ||
| Operating room/post-anesthesia care unit | 932 (21.57) | 1007 (22.38) |
| Hospital—outside or within LHIN | 789 (18.26) | 775 (17.23) |
| Emergency department | 1264 (29.25) | 1343 (29.85) |
| Other sourcea | 379 (8.77) | 441 (9.80) |
| Unit/ward | 975 (22.15) | 933 (20.74) |
| ICU admission diagnosis | ||
| Cardiovascular/cardiac/vascular | 652 (15.09) | 706 (15.69) |
| Other diagnosisb | 998 (23.10) | 1082 (24.04) |
| Gastrointestinal | 452 (10.46) | 532 (11.82) |
| Respiratory | 1405 (32.52) | 1341 (29.79) |
| Trauma | 287 (6.64) | 292 (6.49) |
| Neurological | 527 (12.20) | 548 (12.18) |
| Multiple Organ Dysfunction Score (MODS) | ||
| 0 | 245 (5.67) | 275 (6.11) |
| 1–4 | 1725 (39.92) | 1760 (39.10) |
| 5–8 | 1733 (40.11) | 1802 (40.04) |
| 9–12 | 531 (12.29) | 552 (12.26) |
| >13 | 87 (2.01) | 112 (2.49) |
| Nine Equivalents Nursing Manpower Use Score (NEMS) | ||
| 0–22 | 557 (12.90) | 527 (11.73) |
| 23–29 | 1401 (32.45) | 1445 (32.16) |
| ≥30 | 2359 (54.64) | 2521 (56.11) |
| Modified Charlson’s Comorbidity Score (CCI) | ||
| 0 | 3255 (75.33) | 3354 (74.52) |
| 1–3 | 813 (18.82) | 872 (19.37) |
| >3 | 253 (5.86) | 275 (6.11) |
| Re-admission to ICU (same hospital admission) | 394 (9.12) | 413 (9.18) |
| Mortality | 986 (22.82) | 1023 (22.73) |
a Other Source includes patients admitted from the following locations: home—within or outside LHIN, level 2 unit or step-down unit, level 3 unit (medical/surgical or specialty unit), complex continuing care facility, rehabilitation facility, outside province, other
bOther diagnosis includes patients with the following diseases: metabolic/endocrine, genitourinary, musculoskeletal, skin, oncology, hematology, other
In the multivariable logistic regression model, the stepwise selection algorithm eliminated the variables sex, p = 0.20 and readmit, p = 0.16. The c-statistic of the reduced model was smaller to that obtained when all explanatory variables were forced in (c = 0.774). The backward elimination algorithm eliminated readmit, p = 0.16 first, and then sex, p = 0.22, and resulted in a final model very similar to that using stepwise selection (c = 0.774). Because there is already a parsimony of variables in comparison to reported models, the two variables eliminated by both algorithms were forced back into the whole model.
The logistic regression analysis of the training group (Table 3) revealed that the model containing the explanatory variables compared to that with the intercept only significantly impacted the predictive ability of the model with the likelihood ratio, χ2 = 835.98, p < 0.0001. The overall effect of each of the covariates on mortality revealed that all except gender (χ2 = 0.59; p = 0.44) and CCI (χ2 = 4.60; p = 0.10) had a significant independent effect on ICU mortality. Categorically, the odds of mortality are much higher for older patients, specifically ages 40–79 that is 2.23 (95 % confidence interval (CI) 1.64, 3.04), and those of patients ≥80 years old was 5.51 (95 % CI 3.87, 7.84) times higher than those of patients age ≤ 39. For patients admitted to the ICUs from the unit/ward (odds ratio (OR) = 4.93; 95 % CI 3.69, 6.59), other hospitals (OR = 3.054; 95 % CI 2.26, 4.12), emergency departments (OR = 2.71; 95 % CI 2.05, 3.59), and specialty units (OR = 2.66; 95 % CI 1.86, 3.81) had higher odds of ICU mortality as compared to patients admitted from the operating room/post-anesthesia unit. Patients admitted with cardiovascular/cardiac/vascular diagnoses had a higher mortality as compared to other etiologies. Higher scores in MODS and NEMS corresponded to increasing ICU mortality (p ≤ 0.0001). There was a weak association with ICU readmission and mortality (OR = 0.742; 95 % CI 0.56, 0.99; p = 0.04).
Table 3.
Multivariable logistic regression analysis of the training set (N = 4321) for Critical Care Trauma Center (CCTC) and Medical-Surgical Intensive Care Unit (MSICU) at London Health Sciences Center (LHSC)
| Beta (β) coefficient | Wald chi-square | Odds ratio (95 % CI) | p value | |
|---|---|---|---|---|
| Intercept | −5.18 | 137.10 | – | <.0001 |
| Age | <.0001 | |||
| 0–39 (reference) | – | – | – | – |
| 40–79 | 0.80 | 25.73 | 2.23 (1.64–3.04) | |
| ≥80 | 1.71 | 90.17 | 5.51 (3.87–7.84) | |
| Sex | 0.44 | |||
| Male (reference) | – | – | – | – |
| Female | 0.06 | 0.60 | 1.07 (0.91–1.25) | |
| Nine Equivalents Nursing Manpower Use Score (NEMS) | <.0001 | |||
| 0–22 (reference) | – | – | – | – |
| 23–29 | 0.39 | 4.79 | 1.48 (1.04–2.10) | |
| ≥30 | 1.02 | 36.57 | 2.77 (1.99–3.84) | |
| Multiple Organ Dysfunction Score (MODS) | <.0001 | |||
| 0 (reference) | – | – | – | |
| 1–4 | 1.18 | 9.87 | 3.25 (1.56–6.78) | |
| 5–8 | 1.91 | 26.24 | 6.78 (3.26–14.09) | |
| 9–12 | 2.90 | 57.39 | 18.09 (8.55–38.25) | |
| ≥13 | 3.56 | 65.11 | 35.16 (14.81–83.46) | |
| ICU Admission Source | <.0001 | |||
| Operating room/post-anesthesia care unit (reference) | – | – | – | |
| Other sourcea | 0.98 | 28.56 | 2.66 (1.86–3.81) | |
| Emergency department | 1.00 | 48.76 | 2.71 (2.05–3.59) | |
| Hospital—outside or within LHIN | 1.12 | 58.76 | 3.05 (2.26–4.12) | |
| Unit/ward | 1.60 | 115.846 | 4.93 (3.69–6.59) | |
| ICU admission diagnosis | <.0001 | |||
| Cardiovascular/cardiac/vascular (reference) | – | – | – | – |
| Other diagnosisb | −0.81 | 37.67 | 0.45 (0.34–0.58) | |
| Gastrointestinal | −0.80 | 20.16 | 0.45 (0.32–0.64) | |
| Respiratory | −0.56 | 22.85 | 0.57 (0.45–0.72) | |
| Trauma | −0.32 | 2.52 | 0.73 (0.49–1.08) | 0.11 |
| Neurological | 0.002 | 0.0002 | 1.00 (0.76–1.33) | 0.99 |
| Re-admission to ICU (same hospital admission) | −0.30 | 4.02 | 0.74 (0.56–0.99) | 0.04 |
| Modified Charlson’s Comorbidity Index (CCI) | 0.1 | |||
| 0 (reference) | – | – | – | – |
| 1–3 | −0.21 | 4.20 | 0.81 (0.66–0.99) | |
| >3 | 0.05 | 0.10 | 1.06 (0.76–1.48) |
aOther Source includes patients admitted from the following locations:home—within or outside LHIN, level 2 unit or step-down unit, level 3 unit (medical/surgical or specialty unit), complex continuing care facility, rehabilitation facility, outside province, other
bOther diagnosis includes patients with the following diseases: metabolic/endocrine, genitourinary, musculoskeletal, skin, oncology, hematology, other
The discriminatory performance of the training model revealed the AUC was 0.787. This indicates that the model has good ability to distinguish between patients with a high risk of mortality and those with a low risk of mortality [15]. The comparison of the receiver operating curve (ROC) curves for the training dataset and the testing dataset indicated an area difference of 0.026 (0.787–0.761), which reflects a very narrow gap or the optimism between the two curves, suggesting a small degradation in the model’s performance in prospective testing (Fig. 2). To validate this difference, the bootstrap processes were repeated 500 and 1000 times, and the results were averaged to provide an optimism correction for the AUC of 0.003 (AUC range = 0.758–0.790) which indicates that our model does not overpredict (Additional file 3: Table S3). The AUC comparison between this new model with MODS and NEMS alone in the new model revealed AUC = 0.776 and 0.736, respectively, which are lower than the combined scores AUC = 0.787 (Additional file 4: Table S4). Overall, the combination of the two scores in the model gives better discrimination ability between patients with high and low risks for ICU mortality during the first 24 h of ICU admission.
Fig. 2.
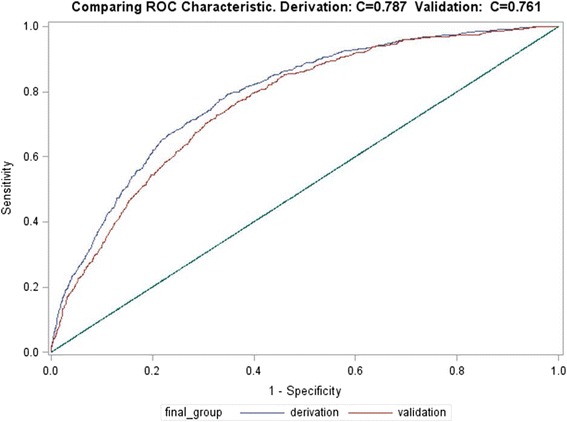
Comparison of the receiver operating curve (ROC) for the training dataset (red) and the testing dataset (blue). The area under the curve (AUC) was 0.787 for the training dataset and 0.760 for the validation dataset
As a measure of calibration from the model, the Hosmer and Lemeshow goodness-of-fit statistics revealed χ2 = 5.48 (p > 0.31) indicating strong agreement between observed and expected ICU mortality (Table 4).
Table 4.
Hosmer and Lemeshow and goodness-of-fit test for the multivariable logistic regression model
| Partition for the Hosmer and Lemeshow test | ||||||
|---|---|---|---|---|---|---|
| Mortality = 1 | Mortality = 0 | |||||
| Group | Range of predicted mortality probability | Total | Observed | Expected | Observed | Expected |
| 1 | 0–3.58 % | 433 | 11 | 9.73 | 422 | 423.27 |
| 2 | 3.59–6.26 % | 432 | 21 | 22.03 | 411 | 409.97 |
| 3 | 6.27–9.56 % | 432 | 31 | 33.91 | 401 | 398.09 |
| 4 | 9.57–13.06 % | 434 | 45 | 49.05 | 389 | 384.95 |
| 5 | 13.07–18.24 % | 432 | 66 | 66.83 | 366 | 365.17 |
| 6 | 18.25–23.35 % | 432 | 91 | 90.61 | 341 | 341.49 |
| 7 | 23.36–28.25 % | 432 | 108 | 109.35 | 324 | 320.84 |
| 8 | 28.26–39.11 % | 438 | 174 | 149.02 | 264 | 288.98 |
| 9 | 39.12–49.38 % | 435 | 190 | 190.70 | 245 | 244.30 |
| 10 | 49.39–94.08 % | 417 | 249 | 262.96 | 168 | 154.04 |
| Hosmer and Lemeshow goodness-of-fit test | ||||||
| Chi-square 9.3599 | p value 0.3128 | |||||
The final formula equation for our model is
Log [Mortality (at 24 h ICU admission)] = −5.18 + 0.80[age(40–79)] + 1.71[age(>80)] + 0.60[Sex(male = 0 and female = 1) + 0.98[Other source admission] + 0.00[Operating room/post-anesthesia care] + 1.00[ER admission] + 1.12[Hospital-outside or within LHIN] + 1.60[Ward admission]Cardiovascular/Cardiac/Vascular] + 0.00[−0.81[Other diagnosis] − 0.80[Gastrointestinal] − 0.56[Respiratory] − 0.32[Trauma] + 0.002[Neurological] − 0.30[ICU re-admission] − 0.21[CCI(1–3)] + 0.05[CCI(>3)] + 0.0[NEMS(0–22)] + 0.39[NEMS(23–29)] + 1.02[NEMS(≥300] + 1.18[MODS(1–4)] + 1.91[MODS(5–8)] + 2.90[MODS(9–120] + 3.56[MODS(≥130].
Discussion
Currently, many health care performance measurement systems are based on administrative databases. These systems are often developed to fulfill the needs of funding agencies and support the quality improvement plans of individual hospitals but rarely provide the necessary level of risk adjustment to provide meaningful comparison, over time or across facilities. It is also well known that prognostic research has received limited attention as compared to etiological, diagnostic, and therapeutic research. The development and application of robust prognostic models are essential for valid benchmarking. Prognostic scoring systems have been developed by the critical care specialty in an effort to quantify the severity of illness of a given patient or groups of patient [16–18]. Adjustment for the severity of illness enables one to monitor the performance of an ICU over time and to allow comparison of ICUs in the same or different hospitals. However, the fact that many prognostic models currently exist suggests that the optimum model has not yet been fully established and any of the developed prognostic models will have a limited effective life span [16, 19], due to changes in clinical practice over time and improved health care that can alter the risk of mortality for a given clinical situation. Thus, prognostic models require periodic updating. Major revisions of prognostic models that were published between 2005 and 2007 include APACHE IV (AUC = 0.88, χ2 = 16.9, p = 0.08) [20], SAPS 3 (AUC = 0.848, χ2 = 14.29, p = 0.16) [21], and MPM0 III (AUC = 0.823, χ2 = 11.62, p = 0.31) [22]. A recent review evaluated the latest versions of these models and concluded that although they represent great improvement compared to the previous ones, regular updates and local customizations are required [23]. Also, the huge resources burden needed to collect a significantly large amount of data for the variables to generate these scores is daunting. The present study aimed to use available data already collected by our ICUs and other ICUs for a very limited number of variables for the two scores, MODS and NEMS in the province of Ontario, Canada, as mandated by CCIS as well as comorbidities diagnoses collected by our hospital health records to develop a mortality prognostic model. The AUC for our model was 0.787, which is considered acceptable or very good in differentiating between survivors and non-survivors [24, 25]. This model is well calibrated, showing good agreement between predicted and actual outcomes for all risk strata (Hosmer and Lemeshow χ2 = 5.4761, p = 0.3146) [26].
To the best of our knowledge, this study is the first to use validated organ dysfunction score, MODS and severity assessment based on nursing workload, and NEMS coupled with five other variables selected. Overall, only two out the seven independent variables, gender and CCI, were not significant in the prediction of ICU mortality. Two retrospective studies contradicted our findings with respect to gender. One study of 24,778 patients admitted to the ICUs across Ontario, Canada in 2001–2002 revealed that females had a higher ICU mortality than males with an adjusted OR = 1.20 (95 % CI 1.10–1.31, p < 0.001) [27]. Another study of 18,757 patients diagnosed with sepsis in 98 ICUs between 2003 and 2006 reported an adjusted OR = 1.11 (95 % CI 1.04–1.19, p < 0.01) [28]. This increased mortality in female patients was not fully understood but could be explained by differences in the presentation of critical illness, decision-making, or unmeasured confounding factors that may contribute to these findings. The other possibility that our patient cohort was reported at a later time period may result in improved ICU access and earlier care of patients using the Critical Care Outreach Team (CCRT) [29–31].
We know that scoring systems used in the ICUs have been introduced and developed over the last 30 years. These models allow an assessment of the severity of disease and provide an estimate of ICU and hospital mortality. The MODS score independently has been used in many clinical studies and it has an excellent discriminating predictor of mortality in ICU patients [32–37]. The MODS in our study is a very strong predictor of mortality in the first 24 h of ICU admission, and it correlated very well with other scores such as the SOFA score and APACHE II score in terms of mortality prediction [38]. However, the complexity of ICU care goes beyond the severity of illness or organ failure, the level of nursing workload, and NEMS as related to the ICU resource utilization that also correlated well with ICU mortality [39]. Many other factors also have been shown to increase risks of in-hospital mortality after admission to the ICU, including increasing age and severity of acute illness, certain pre-existing medical conditions, source of admission, physiological measurements, and biochemical/hematological indices [40]. By utilizing those other covariates, it may not necessarily improve the discrimination ability of predicted model but rather avoid the pitfall of either underpredicting or overpredicting ICU mortality when using only a single covariate in the prediction model. Although the NEMS in our study is not as a strong mortality predictor in the first 24 h of ICU admission as the MODS, with the combined scores in a prediction model, it provided a much better basis for evaluation of treatment results and documentation of the ICUs’ resource needs [39]. Having knowledge of both severity of organ dysfunction and degree of resource utilization will provide a better basis for assessing whether ICU treatment(s) and/or administrative protocol(s) needs to be modified to improve patient care.
With comorbidities, specifically severe chronic organ system insufficiency or immunocompromised, those patients markedly influence outcomes [41] and this is supported by other outcome prediction scores. In our study, comorbidities were not predictive because we used the pre-admit comorbidities that existed prior to admission to the ICU as opposed to the conditions that were aggravated or developed subsequently. Another limitation was the actual condition captured in the CCI score that was developed on breast cancer patients and not in ICU patients to predict 1-year patient mortality using comorbidity data obtained from hospital chart review [42, 43]. The CCI is a validated weighted score, the weight for each of the co-morbidities may not fully reflect the severity of the disease and it may or may not include specific or unusual illnesses, and therefore, it is not an assessment of the impact of all illnesses on the overall health of the patient. Furthermore, the ICD-10-CA data is abstracted by medical record clerks and not entered by health care providers and can be subjected to errors based on lack of documentation and misinterpretation. Our model fit could be improved by capturing active chronic health status at ICU admission utilizing the APACHE II chronic health points which reflects diminished physiological reserve and markedly influence outcome [2, 41].
Acute diagnosis was not used in earlier prediction models with the exception of the APACHE II to IV scores. It was not until 1993 that MPM II started to include acute diagnosis to the model and SAPS 3 and MPM III followed suit in 2005 and 2007. However, the predictive accuracy over diagnosis showed that the performance of a prediction model can vary in different diagnostic groups [44]. This is in agreement with previous research [45–47], which suggested that prognostic models can underpredict or overpredict mortality in specific patient sub-groups. The admitting diagnosis in our study is classified using broad, system-based categories and did not include specific diagnostic information to allow for comparisons within the generalized diagnoses, between subgroups or between-study populations. Although these broad diagnostic groups include specific diagnoses that are similar based on the system involved, the exact diagnoses within a group can have completely different treatments and outcomes. For example, the “cardiovascular/cardiac/vascular” diagnosis group used in this study has the highest mortality but includes less severe exact diagnoses with lower mortality rates. Patients with abdominal aorta aneurysm carried a much higher mortality than patients with myocardial infarction and cardiac bypass surgery thus skewing the mortality risk. Another limitation, some of the system-based groups such as metabolic/endocrine, genitourinary, musculoskeletal, skin, oncology, hematology, and “other” was collapsed together due to its small number of patients per group. This represented a significant heterogeneous population within a diagnostic group which would be difficult to interpret the statistical prediction accuracy.
Studies carried out in numerous countries indicated that the source of the patient admission is associated with mortality. Patients transferred from the ward within the same hospital showed a greater ICU mortality when compared with those coming from other sources [48–51]. This is in agreement with the present study where patients admitted from the ward had the highest mortality (OR = 4.93, 95 % CI 3.69–6.59, p < 0.0001), post-surgical patients had the lowest.
Those patient readmitted to the ICU did not have significant mortality differences to those patients not readmitted, which is contrary to published literature [52]. This difference could be due to the implementation of the Critical Care Resuscitation Team (CCRT) that may intervene earlier on the wards of patients’ acute illness [53, 54]. Also, various service teams including CCRT are improving end of life (EOL) discussions with those patients previously admitted to the ICU, thus avoids a readmission [55, 56]. Our institution implemented the CCRT service in 2007.
Conclusions
Scoring systems in critical care have evolved to meet the desire of clinical and administrative leaders to assess the quality of care provided by the ICUs. Mortality is a key ICU quality metric and reflects many aspects of ICU care, including use of best practice, accurate diagnosis, and effective and timely therapies. Our model is locally calibrated to two ICUs in London, Ontario, Canada only, and the results may not be generalizable to other critical care units. But collectively, all ICUs in the province of Ontario, Canada gather the same data information; it is logical that a model be developed to benchmark ICU performance and improve the usability of the current reporting system. This study demonstrates that data from the CCIS can be used to create a mortality prediction model with good calibration and discrimination. Inclusion of data to capture active chronic health status and refinement of the acute diagnosis classification could further improve predictive ability of the developed model.
Acknowledgements
We are grateful to Mrs. Kathryn Barber, Health Information Analyst at the LHSC Health Records department matched the CCIS dataset with the hospital records to obtain the ICD-10-CA for calculation of the Charlson’s Co-morbidity Index.
Financial support
No financial supports were utilized for this study.
Abbreviations
- APACHE
Acute physiology and chronic health evaluation
- AUC
Area under the curve
- CCI
Charlson’s Co-Morbidity Index
- CCIS
Critical care information system
- CCSO
Critical care services Ontario
- CCTC
Critical care trauma centre
- CI
Confidence interval
- CIHI
Canadian Institute of Health Information
- ICD-10-CA
International statistical classification of diseases and related health problems – tenth version – Canada
- ICU
Intensive care unit
- LHIN
Local health information networks
- LHSC
London health sciences centre
- MODS
Multiple organs dysfunction score
- MPM
Mortality prediction model
- MSICU
Medical and surgical intensive care unit
- NEMS
Nine equivalent manpower use score
- OR
Odds ratio
- ROC
Receiver operating curve
- SAPS
Simplified acute physiological score
- SOFA
Sequential organ failure assessment
- TISS
Therapeutic intervention scoring system
Additional files
Nine equivalents of nursing manpower use score by Miranda DR, Nap R, de RA, Schaufeli W, Iapichino G. Nursing activities score. Crit Care Med 2003;31:374–382. (DOCX 87 kb)
Selection and categorization of the independent variables for the logistic regression model associated with ICU mortality. (DOCX 14 kb)
Bootstrap sampling (500 and 1000 times) to estimate the optimism in the AUC (c-statistics) based on the predicted outcomes from a logistic regression model. (DOCX 13 kb)
Multivariable logistic regression analysis of the training set (N = 4321) for Critical Care Trauma Center (CCTC) and Medical-Surgical Intensive Care Unit (MSICU) at London Health Sciences Center (LHSC) with MODS or NEMS only. (DOCX 14 kb)
Footnotes
Competing interests
The authors declare that they have no competing interests.
Authors’ contributions
RK conceived and designed the study and performed the analysis and interpretation of the data and drafting and revising of the manuscript. FP participated in the analysis and interpretation of the data and revision of the manuscript critically for important intellectual content. AD carried out revising of the manuscript critically for important intellectual content and has given the final approval of the version to be published. All authors read and approved the final manuscript.
Contributor Information
Raymond Kao, Phone: 1-519-685-8500, Email: rkao3@uwo.ca.
Fran Priestap, Email: Fran.Priestap@lhsc.on.ca.
Allan Donner, Email: allan.donner@schulich.uwo.ca.
References
- 1.Knaus WA, Zimmerman JE, Wagner DP, Draper EA, Lawrence DE. APACHE-acute physiology and chronic health evaluation: a physiologically based classification system. Crit Care Med. 1981;9(8):591–7. doi: 10.1097/00003246-198108000-00008. [DOI] [PubMed] [Google Scholar]
- 2.Knaus WA, Draper EA, Wagner DP, Zimmerman JE. APACHE II: a severity of disease classification system. Crit Care Med. 1985;13(10):818–29. doi: 10.1097/00003246-198510000-00009. [DOI] [PubMed] [Google Scholar]
- 3.Knaus WA, Wagner DP, Draper EA, et al. The APACHE III prognostic system. Risk prediction of hospital mortality for critically ill hospitalized adults. Chest. 1991;100(6):1619–36. doi: 10.1378/chest.100.6.1619. [DOI] [PubMed] [Google Scholar]
- 4.LeGall JR, Loirat P, Alperovitch A. APACHE II—a severity of disease classification system. Crit Care Med. 1986;14(8):754–5. doi: 10.1097/00003246-198608000-00027. [DOI] [PubMed] [Google Scholar]
- 5.Lemeshow S, Teres D, Klar J, Avrunin JS, Gehlbach SH, Rapoport J. Mortality Probability Models (MPM II) based on an international cohort of intensive care unit patients. JAMA. 1993;270(20):2478–86. doi: 10.1001/jama.1993.03510200084037. [DOI] [PubMed] [Google Scholar]
- 6.Marshall JC, Cook DJ, Christou NV, Bernard GR, Sprung CL, Sibbald WJ. Multiple organ dysfunction score: a reliable descriptor of a complex clinical outcome. Crit Care Med. 1995;23(10):1638–52. doi: 10.1097/00003246-199510000-00007. [DOI] [PubMed] [Google Scholar]
- 7.Vincent JL, Moreno R, Takala J, et al. The SOFA (Sepsis-related Organ Failure Assessment) score to describe organ dysfunction/failure. On behalf of the Working Group on Sepsis-Related Problems of the European Society of Intensive Care Medicine. Intensive Care Med. 1996;22(7):707–10. doi: 10.1007/BF01709751. [DOI] [PubMed] [Google Scholar]
- 8.Cullen DJ, Civetta JM, Briggs BA, Ferrara LC. Therapeutic intervention scoring system: a method for quantitative comparison of patient care. Crit Care Med. 1974;2(2):57–60. doi: 10.1097/00003246-197403000-00001. [DOI] [PubMed] [Google Scholar]
- 9.Miranda DR, Nap R, de Rijk A, Schaufeli W, Iapichino G. Nursing activities score. Crit Care Med. 2003;31(2):374–82. doi: 10.1097/01.CCM.0000045567.78801.CC. [DOI] [PubMed] [Google Scholar]
- 10.Reis MD, Moreno R, Iapichino G. Nine equivalents of nursing manpower use score (NEMS) Intensive Care Med. 1997;23(7):760–5. doi: 10.1007/s001340050406. [DOI] [PubMed] [Google Scholar]
- 11.Rothen HU, Kung V, Ryser DH, Zurcher R, Regli B. Validation of “nine equivalents of nursing manpower use score” on an independent data sample. Intensive Care Med. 1999;25(6):606–11. doi: 10.1007/s001340050910. [DOI] [PubMed] [Google Scholar]
- 12.Hall SF. A user’s guide to selecting a comorbidity index for clinical research. J Clin Epidemiol. 2006;59(8):849–55. doi: 10.1016/j.jclinepi.2005.11.013. [DOI] [PubMed] [Google Scholar]
- 13.Moreno R, Reis MD. Nursing staff in intensive care in Europe: the mismatch between planning and practice. Chest. 1998;113(3):752–8. doi: 10.1378/chest.113.3.752. [DOI] [PubMed] [Google Scholar]
- 14.Quan H, Li B, Couris CM, et al. Updating and validating the Charlson comorbidity index and score for risk adjustment in hospital discharge abstracts using data from 6 countries. Am J Epidemiol. 2011;173(6):676–82. doi: 10.1093/aje/kwq433. [DOI] [PubMed] [Google Scholar]
- 15.Fawdett T. An introduction to ROC analysis. Pattern Recogn Lett. 2006;27:861–74. doi: 10.1016/j.patrec.2005.10.010. [DOI] [Google Scholar]
- 16.Keegan MT, Gajic O, Afessa B. Severity of illness scoring systems in the intensive care unit. Crit Care Med. 2011;39(1):163–9. doi: 10.1097/CCM.0b013e3181f96f81. [DOI] [PubMed] [Google Scholar]
- 17.Rubenfeld GD, Angus DC, Pinsky MR, Curtis JR, Connors AF, Jr, Bernard GR. Outcomes research in critical care: results of the American Thoracic Society Critical Care Assembly Workshop on Outcomes Research. The Members of the Outcomes Research Workshop. Am J Respir Crit Care Med. 1999;160(1):358–67. doi: 10.1164/ajrccm.160.1.9807118. [DOI] [PubMed] [Google Scholar]
- 18.Vincent JL, Moreno R. Clinical review: scoring systems in the critically ill. Crit Care. 2010;14(2):207. doi: 10.1186/cc8204. [DOI] [PMC free article] [PubMed] [Google Scholar]
- 19.Beck DH, Smith GB, Pappachan JV. The effects of two methods for customising the original SAPS II model for intensive care patients from South England. Anaesthesia. 2002;57(8):785–93. doi: 10.1046/j.1365-2044.2002.02698_2.x. [DOI] [PubMed] [Google Scholar]
- 20.Zimmerman JE, Kramer AA, McNair DS, Malila FM. Acute Physiology and Chronic Health Evaluation (APACHE) IV: hospital mortality assessment for today’s critically ill patients. Crit Care Med. 2006;34(5):1297–310. doi: 10.1097/01.CCM.0000215112.84523.F0. [DOI] [PubMed] [Google Scholar]
- 21.Moreno RP, Metnitz PG, Almeida E, et al. SAPS 3—from evaluation of the patient to evaluation of the intensive care unit. Part 2: Development of a prognostic model for hospital mortality at ICU admission. Intensive Care Med. 2005;31(10):1345–55. doi: 10.1007/s00134-005-2763-5. [DOI] [PMC free article] [PubMed] [Google Scholar]
- 22.Higgins TL, Teres D, Copes WS, Nathanson BH, Stark M, Kramer AA. Assessing contemporary intensive care unit outcome: an updated Mortality Probability Admission Model (MPM0-III) Crit Care Med. 2007;35(3):827–35. doi: 10.1097/01.CCM.0000257337.63529.9F. [DOI] [PubMed] [Google Scholar]
- 23.Salluh JI, Soares M. ICU severity of illness scores: APACHE, SAPS and MPM. Curr Opin Crit Care. 2014;20(5):557–65. doi: 10.1097/MCC.0000000000000135. [DOI] [PubMed] [Google Scholar]
- 24.Hosmer DW, Hosmer T, Le CS, Lemeshow S. A comparison of goodness-of-fit tests for the logistic regression model. Stat Med. 1997;16(9):965–80. doi: 10.1002/(SICI)1097-0258(19970515)16:9<965::AID-SIM509>3.0.CO;2-O. [DOI] [PubMed] [Google Scholar]
- 25.Afessa B, Gajic O, Keegan MT. Severity of illness and organ failure assessment in adult intensive care units. Crit Care Clin. 2007;23(3):639–58. doi: 10.1016/j.ccc.2007.05.004. [DOI] [PubMed] [Google Scholar]
- 26.Lemeshow S, Hosmer DW., Jr A review of goodness of fit statistics for use in the development of logistic regression models. Am J Epidemiol. 1982;115(1):92–106. doi: 10.1093/oxfordjournals.aje.a113284. [DOI] [PubMed] [Google Scholar]
- 27.Fowler RA, Sabur N, Li P, et al. Sex- and age-based differences in the delivery and outcomes of critical care. CMAJ. 2007;177(12):1513–9. doi: 10.1503/cmaj.071112. [DOI] [PMC free article] [PubMed] [Google Scholar]
- 28.Pietropaoli AP, Glance LG, Oakes D, Fisher SG. Gender differences in mortality in patients with severe sepsis or septic shock. Gend Med. 2010;7(5):422–37. doi: 10.1016/j.genm.2010.09.005. [DOI] [PMC free article] [PubMed] [Google Scholar]
- 29.Bellomo R, Goldsmith D, Uchino S, et al. A prospective before-and-after trial of a medical emergency team. Med J Aust. 2003;179(6):283–7. doi: 10.5694/j.1326-5377.2003.tb05548.x. [DOI] [PubMed] [Google Scholar]
- 30.Jones D, Bellomo R, Bates S, et al. Long term effect of a medical emergency team on cardiac arrests in a teaching hospital. Crit Care. 2005;9(6):R808–15. doi: 10.1186/cc3906. [DOI] [PMC free article] [PubMed] [Google Scholar]
- 31.Sebat F, Musthafa AA, Johnson D, et al. Effect of a rapid response system for patients in shock on time to treatment and mortality during 5 years. Crit Care Med. 2007;35(11):2568–75. doi: 10.1097/01.CCM.0000287593.54658.89. [DOI] [PubMed] [Google Scholar]
- 32.Jacobs S, Zuleika M, Mphansa T. The Multiple Organ Dysfunction Score as a descriptor of patient outcome in septic shock compared with two other scoring systems. Crit Care Med. 1999;27(4):741–4. doi: 10.1097/00003246-199904000-00027. [DOI] [PubMed] [Google Scholar]
- 33.Vanderschueren S, De WA, Malbrain M, et al. Thrombocytopenia and prognosis in intensive care. Crit Care Med. 2000;28(6):1871–6. doi: 10.1097/00003246-200006000-00031. [DOI] [PubMed] [Google Scholar]
- 34.Bota DP, Melot C, Lopes FF, Nguyen Ba V, Vincent JL. The multiple Organ Dysfunction Score (MODS) versus the Sequential Organ Failure Assessment (SOFA) in outcome prediction. Intensive Care Med. 2002;28(11):1619-24. [DOI] [PubMed]
- 35.Khwannimit B. Serial evaluation of the MODS, SOFA and LOD scores to predict ICU mortality in mixed critically ill patients. J Med Assoc Thai. 2008;91(9):1336–42. [PubMed] [Google Scholar]
- 36.Dover M, Tawfick W, Hynes N. Sultan S. Vascular: Evaluation of illness severity scoring systems and risk prediction in vascular intensive care admissions; 2015. [DOI] [PubMed] [Google Scholar]
- 37.Xiao K, Guo C, Su L, Yan P, Li X, Xie L. Prognostic value of different scoring models in patients with multiple organ dysfunction syndrome associated with acute COPD exacerbation. J Thorac Dis. 2015;7(3):329–36. doi: 10.3978/j.issn.2072-1439.2014.11.27. [DOI] [PMC free article] [PubMed] [Google Scholar]
- 38.Peres BD, Melot C, Lopes FF, Nguyen BV, Vincent JL. The Multiple Organ Dysfunction Score (MODS) versus the Sequential Organ Failure Assessment (SOFA) score in outcome prediction. Intensive Care Med. 2002;28(11):1619–24. doi: 10.1007/s00134-002-1491-3. [DOI] [PubMed] [Google Scholar]
- 39.Haagensen R, Jamtli B, Moen H, Stokland O. Experiences with scoring systems SAPS II and NEMS for registration of activities in an intensive care unit. Tidsskr Nor Laegeforen. 2001;121(6):687–90. [PubMed] [Google Scholar]
- 40.Bouch DP, Thompson JP. Severity scoring systems in the critically ill. Contining Educ Anaesthesia Crit Care Pain. 2008;8(5):181–5. doi: 10.1093/bjaceaccp/mkn033. [DOI] [Google Scholar]
- 41.Wagner DP, Knaus WA, Draper EA. Statistical validation of a severity of illness measure. Am J Public Health. 1983;73(8):878–84. doi: 10.2105/AJPH.73.8.878. [DOI] [PMC free article] [PubMed] [Google Scholar]
- 42.Charlson ME, Pompei P, Ales KL, MacKenzie CR. A new method of classifying prognostic comorbidity in longitudinal studies: development and validation. J Chronic Dis. 1987;40(5):373–83. doi: 10.1016/0021-9681(87)90171-8. [DOI] [PubMed] [Google Scholar]
- 43.Needham DM, Scales DC, Laupacis A, Pronovost PJ. A systematic review of the Charlson comorbidity index using Canadian administrative databases: a perspective on risk adjustment in critical care research. J Crit Care. 2005;20(1):12–9. doi: 10.1016/j.jcrc.2004.09.007. [DOI] [PubMed] [Google Scholar]
- 44.Paul E, Bailey M, Pilcher D. Risk prediction of hospital mortality for adult patients admitted to Australian and New Zealand intensive care units: development and validation of the Australian and New Zealand Risk of Death model. J Crit Care. 2013;28(6):935–41. doi: 10.1016/j.jcrc.2013.07.058. [DOI] [PubMed] [Google Scholar]
- 45.Brinkman S, Bakhshi-Raiez F, Abu-Hanna A, et al. External validation of Acute Physiology and Chronic Health Evaluation IV in Dutch intensive care units and comparison with Acute Physiology and Chronic Health Evaluation II and Simplified Acute Physiology Score II. J Crit Care. 2011;26(1):105–8. doi: 10.1016/j.jcrc.2010.07.007. [DOI] [PubMed] [Google Scholar]
- 46.Nierman DM, Schechter CB, Cannon LM, Meier DE. Outcome prediction model for very elderly critically ill patients. Crit Care Med. 2001;29(10):1853–9. doi: 10.1097/00003246-200110000-00001. [DOI] [PubMed] [Google Scholar]
- 47.Zhu BP, Lemeshow S, Hosmer DW, Klar J, Avrunin J, Teres D. Factors affecting the performance of the models in the Mortality Probability Model II system and strategies of customization: a simulation study. Crit Care Med. 1996;24(1):57–63. doi: 10.1097/00003246-199601000-00011. [DOI] [PubMed] [Google Scholar]
- 48.Odetola FO, Rosenberg AL, Davis MM, Clark SJ, Dechert RE, Shanley TP. Do outcomes vary according to the source of admission to the pediatric intensive care unit? Pediatr Crit Care Med. 2008;9(1):20–5. doi: 10.1097/01.PCC.0000298642.11872.29. [DOI] [PubMed] [Google Scholar]
- 49.Escarce JJ, Kelley MA. Admission source to the medical intensive care unit predicts hospital death independent of APACHE II score. JAMA. 1990;264(18):2389–94. doi: 10.1001/jama.1990.03450180053028. [DOI] [PubMed] [Google Scholar]
- 50.Knaus WA, Wagner DP, Zimmerman JE, Draper EA. Variations in mortality and length of stay in intensive care units. Ann Intern Med. 1993;118(10):753–61. doi: 10.7326/0003-4819-118-10-199305150-00001. [DOI] [PubMed] [Google Scholar]
- 51.Hill AD, Vingilis E, Martin CM, Hartford K, Speechley KN. Interhospital transfer of critically ill patients: demographic and outcomes comparison with nontransferred intensive care unit patients. J Crit Care. 2007;22(4):290–5. doi: 10.1016/j.jcrc.2007.06.002. [DOI] [PubMed] [Google Scholar]
- 52.Kramer AA, Higgins TL, Zimmerman JE. The association between ICU readmission rate and patient outcomes. Crit Care Med. 2013;41(1):24–33. doi: 10.1097/CCM.0b013e3182657b8a. [DOI] [PubMed] [Google Scholar]
- 53.Choi S, Lee J, Shin Y, et al. Effects of a medical emergency team follow-up programme on patients discharged from the medical intensive care unit to the general ward: a single-centre experience. J Eval Clin Pract. 2015;16. [DOI] [PubMed]
- 54.Niven DJ, Bastos JF, Stelfox HT. Critical care transition programs and the risk of readmission or death after discharge from an ICU: a systematic review and meta-analysis. Crit Care Med. 2014;42(1):179–87. doi: 10.1097/CCM.0b013e3182a272c0. [DOI] [PubMed] [Google Scholar]
- 55.Pattison N, O’Gara G, Wigmore T. Negotiating transitions: involvement of critical care outreach teams in end-of-life decision making. Am J Crit Care. 2015;24(3):232–40. doi: 10.4037/ajcc2015715. [DOI] [PubMed] [Google Scholar]
- 56.Jones D, Moran J, Winters B, Welch J. The rapid response system and end-of-life care. Curr Opin Crit Care. 2013;19(6):616–23. doi: 10.1097/MCC.0b013e3283636be2. [DOI] [PubMed] [Google Scholar]