

Abstract
In this Letter, we varied targeting ligand density of an EGFR binding affibody on the surface of two different hydrogel PRINT nanoparticles (80 nm × 320 and 55 nm × 60 nm) and monitored effects on target-cell association, off-target phagocytic uptake, biodistribution, and tumor accumulation. Interestingly, variations in ligand density only significantly altered in vitro internalization rates for the 80 nm × 320 nm particle. However, in vivo, both particle sizes experienced significant changes in biodistribution and pharmacokinetics as a function of ligand density. Overall, nanoparticle size and passive accumulation were the dominant factors eliciting tumor sequestration.
Keywords: PRINT, nanoparticle, active targeting, ligand density, pharmacokinetics, tumor accumulation
Passive targeting continues to be the crux of nanoparticle-mediated drug delivery to solid tumors. Improved efficacy typically associated with particulate carrier systems is dependent on an improved pharmacokinetic profile compared to the native therapeutic, as well as preferential accumulation of the carrier within the tumor tissue due to the discontinuous and irregular tumor vasculature.1,3 This superior accumulation is known as the enhanced permeation and retention (EPR) effect, as coined by Maeda and Matsumura in the late 1980s.2 By reducing the carrier size to sub-100 nm dimensions and by enhancing plasma retention, neoplastic delivery can be augmented drastically due to improved interstitial diffusivity and probability of accretion, respectively.3 In order to extend circulation time, the carrier must exhibit a neutral or slightly negative surface potential to avoid nonspecific cell association and surface chemistry adept at evading the mononuclear phagocytic system (MPS).4–9 Carrier shape is another parameter that should be controlled. While NPs are typically spherical, recent literature has demonstrated that rod-shaped carriers have enhanced cellular internalization both in vitro and in vivo as well as greater extravasation into and accumulation within diseased tissue.10–12 Beyond passive targeting, actively targeted nanoparticulate systems can further enhance therapeutic effect by preferentially targeting overexpressed cellular receptors on cancerous tissue.13–16
A distinct advantage offered with particulate-based active targeting is establishing multivalent interactions between the carrier and target cell.17 Achieving this multivalent effect is highly dependent on ligand size, surface pinning density, length and flexibility of the ligand tether, and the packing structure of the ligand.22,41–44 Once achieved, multivalency can lead to enhanced avidity to target cells with traditional low-affinity ligands; therefore, the ligand library is greatly expanded when coupled with a particle carrier.18,25 In addition, multivalent interactions can enhance cell binding several orders of magnitude over the unbound ligand yielding dramatically improved payload delivery and tumor reduction.19 Furthermore, particle shape and size have also been shown to vary the multivalency effect.20,39 With these benefits, multivalency also comes with a cost of complexity and can lead to significant changes in vitro and in vivo from the untargeted counterpart. It is well documented that increasing surface ligand density results in enhanced in vitro cellular internalization.37,45,46 However, decorating the surface of the nanoparticle carrier with biologics often leads to enhanced in vivo MPS clearance.44,46,47 Therefore, determining the ideal density of targeting ligand to optimize multivalent effects while maintaining stealth properties remains an arduous task, and having the capability to finely control ligand surface density cannot be understated. As such, variation in surface ligand density has been shown to impact particle toxicity, binding coefficient to the target receptor, and tumor accumulation.15,18,21–23 While actively targeting these complex particulate systems has become an intense area of research, off-targeting effects associated with ligand density have yet to be fully understood. Depending on the nanoparticle fabrication technique utilized, controlling all of the outlined parameters (surface chemistry, shape, size, etc.) simultaneously is a challenging if not altogether unobtainable objective.
To this aim, we investigated the effects of nanoparticle size, shape, and targeting ligand density in vitro and in vivo. Passive accumulation in tumor tissue was assessed with sphere-like and rod-shaped hydrogel PRINT particles to determine the role of NP size and shape. Using a FITC-labeled ZEGFR affibody, we exquisitely controlled ligand density functionalized to both particles. Particle shape and size effects on receptor-mediated endocytosis and nonspecific uptake were observed as ligand density was held constant between both NPs. Biodistribution and pharmacokinetics were observed as a function of nanoparticle shape, size, and ligand density. Overall, passive targeting was the dominant factor influencing tumor accumulation, while changes in ligand density dramatically shifted in vitro and in vivo particle behavior.
Calibration-quality hydrogel nanoparticles were synthesized at two sizes: 55 × 60 nm and 80 × 320 nm (Figure 1 and Table 1). Using a continuous roll-to-roll fabrication system, PRINT particles were rapidly fabricated at 72 and 360 mg/h for the 55 × 60 nm and 80 × 320 nm particles, respectively. The particle composition consisted of UV-cured acrylate based monomers. A fluorescent marker was included for in vitro (Dylight 488) and in vivo (Dylight 650/680) studies in addition to the other acrylate polymeric components. The particle matrix mainly comprised an HP4A monomer coupled with PEG700DA cross-linker, yielding a PEG-based nanoparticle that aids in immune system evasion when administered in vivo.5,8,24,28 An amino functional monomer was incorporated to allow for facile postfunctionalization chemistry. For these studies the primary amine was reacted through NHS (N-hydroxysuccinimide) chemistry to either a monofunctional or bifunctional PEG, for either passive or active tumor accumulation studies. The mass of either mono- or bifunctional terminated PEG charged to the hydrogel particles resulted in a surface density of PEG sufficient to inhibit macrophage uptake and protein opsonization while extending circulation times in vivo.28 Residual amine groups post-PEGylation were converted to inert acetyl groups resulting in a negative NP surface charge, further decreasing undesired cellular uptake when administered IV.28 As discussed in previous accounts, fabrication by PRINT continued to yield calibration-quality nanoparticles that exhibited narrow poly-dispersity postfunctionalization.10,21,27,28,34–36,60
Figure 1.

Scanning electron micrograph of 80 × 320 nm (A) and 55 × 60 nm (B) hydrogel PRINT nanoparticles.
Table 1.
Nanoparticle Characterization via Dynamic Light Scattering
| type (nm) | surface modification | Dh (nm) | PdI | ζ (mV) |
|---|---|---|---|---|
| 55 × 60 | n/a | 126.8 ± 4.0 | 0.130 ± 0.01 | +38.0 ± 1.1 |
| mPEG/acetylation | 126.7 ± 2.4 | 0.095 ± 0.01 | −16.7 ± 1.1 | |
| 80 × 320 | n/a | 276.6 ± 2.4 | 0.034 ± 0.01 | +35.1 ± 0.9 |
| mPEG/acetylation | 257.3 ± 2.1 | 0.008 ± 0.01 | −19.0 ± 1.1 |
Nanoparticle size is arguably the most significant factor dictating the success of a nanobased cancer therapy, as passive tumor accumulation is largely regulated by carrier size.30 To this end, reducing NP size to sub-100 nm has recurrently shown greater accumulation, efficacy, and tumor uptake than larger analogues.31–33 Yet, previous work from the DeSimone lab has demonstrated remarkable efficacy with 80 × 320 nm docetaxel loaded poly(lactic-co-glycolic acid) NPs in tumor-bearing mouse models.34–36 To this aim, we wanted to elucidate what particle-parameters influenced efficacious accumulation in cancerous tissue. Biodistribution of non-targeted 55 × 60 nm and 80 × 320 nm hydrogel particles in A431 tumor-bearing mice (Figure 2) were conducted in an effort to determine the size/shape effects on MPS organ accumulation and passive tumor accumulation. The percentage of accumulation for each organ was calculated by dividing collected fluorescence from each tissue by the total sum fluorescence of all excised tissues. In these studies, the 55 × 60 nm particle exhibited a 2-fold greater accumulation in the liver (42 ± 5%), as compared to the 80 × 320 nm particle (18 ± 7%). However, the inverse was observed in the spleen: the 80 × 320 nm particle displayed a greater than 2-fold increase in accumulation (72 ± 7%) over the smaller 55 × 60 nm particle (30 ± 7%). Blood retention at 24 h was statistically the same between both NP types, while the smaller particle dramatically enhanced tumor accumulation (over 5-fold; 9.1 ± 2.5%) compared to the larger particle (1.7 ± 0.7%). These findings coincided with literature, as size reduction typically results in more dispersed distribution throughout all tissues.38 The noteworthy improvement in tumor accretion reflects the general trend of enhanced tumor penetration with NP size reduction as previously mentioned. This hypothesis is further confirmed as both particles exhibited similar blood circulation profiles at 24 h; therefore, each NP type exhibits equal exposure to the tumor vasculature and equal chance to permeate into the diseased tissue.
Figure 2.

Biodistribution of PEGylated 80 × 320 nm and 55 × 60 nm NPs at 24 h in A431 tumor-bearing mice (inset: enhanced view of blood, tumor, kidney, and lung at 24 h; N = 4). *, P < 0.05. The percentage of recovered fluorescence per gram of tissue for each organ was calculated by dividing collected fluorescence from each tissue by the total sum fluorescence of all excised tissues.
Fabricating actively targeted nanocarriers has shown great precedence in improving tumor delivery and efficacy.13–16 Yet, as previously discussed, the optimal ligand density for a particle platform is reliant on many factors including particle size and shape. Additionally, changing the targeting density may result in major shifts in biodistribution and PK, possibly rendering an advantageous nanotherapy ineffective.15,23 In an effort to preserve the improved biological profile gained by PEG density optimization, it was of great importance to study ligand density variation on hydrogel NPs.28 To this end, a highly tunable and precisely controlled ligand quantitation scheme was developed to exquisitely control targeting density on both particle types.
The targeting conjugation scheme utilized an anti-EGFR affibody, which is selective to the extracellular domain of the EGFR surface glycoprotein.26 This affibody was precisely conjugated to the NP surface at several ligand densities (Scheme 1). After PEGylating with a thiol-reactive maleimide-PEG5k-SCM and subsequent acetylation, FITC-labeled affibody functionalized with a nonstructural cysteine group was reacted to the NP surface allowing detection of ligand to subnanomolar concentrations, exceeding colorimetric assays traditionally used for biological detection on particulates. Surface modification concluded with addition of mPEG1k-thiol to quench residual maleimide groups with an inert methoxy-functionality. Affibody was charged at various amounts to both particle types, and the targeting ligand density (LG/nm2) was quantified by fluorescence methods similar to those previously described for quantifying PEG density.28 Due to the fine control exhibited, we were able to maintain similar ligand density between the two particle sizes at three separate densities. For the 80 × 320 nm particle, targeting ligand density was calculated to be 0.65, 1.1, 1.8, 3.3, and 4.5 (×10−3) ligands/nm2 corresponding to ~100, 170, 280, 560, and 700 ligands/NP, respectively. For the 55 × 60 nm particle, densities of 1.2, 2.0, and 3.0 (×10−3) ligands/nm2 were calculated corresponding to ~20, 30, and 40 ligands/NP, respectively (Supplemental Figure 1). For in vitro and in vivo studies, the FITC-labeled ligand was replaced with an unlabeled analogue to reduce possibility of immune recognition. Upon dynamic light scattering and zeta-potential analyses, size and PDI were observed to increase slightly for the 80 × 320 nm particle as a function of targeting ligand density, while surface charge neutralized. However, with the 55 × 60 nm particle, no distinct trend was observed for size, PDI, or surface charge (Supplemental Table 1).
Scheme 1. Conjugation of PRINT NPs to Targeting Ligand.

In vitro studies were conducted with 488 Dylight labeled 55 × 60 nm and 80 × 320 nm particles to determine ligand density and NP shape/size effects. In these studies, EGFR-over-expressing epidermoid carcinoma (A431) and alveolar macrophage (MH-S) cells were used to conduct targeted cell association and nonspecific uptake experiments, respectively. Trypan Blue (TB) typically used as a live/dead stain, was repurposed to determine if nanoparticles were membrane bound or internalized by cells. This simple technique has been used throughout literature to distinguish between intracellular and extracellular presence of both biological and nano-particulate matter.10,57–59 If nanoparticles are membrane bound, the Dylight 488 (from the nanoparticle) forms a FRET pair with the TB, shifting the λem of the particle (λem ≈ 580 nm). However, since TB cannot penetrate through the plasma membrane, upon NP internalization, a FRET pair is not formed and the λem remains at ~520 nm. In all, four scenarios exist between the cell and the dye-labeled particle upon cell sorting and bivariate analysis: no-association, membrane bound only, membrane bound and internalized, and internalized only.
For targeting experimentation, a direct correlation was observed between ligand density and cellular association (nanoparticles bound to outer membrane and internalized) for both set of NPs (Figure 3 and Supplemental Figure 3). The percentage of particle sequestration in each cell population was calculated by dividing collected fluorescence from the individual subpopulation by total sum fluorescence of all cell populations. For the rod-shaped particle, an optimum ligand density was observed at approximately 1.8 × 10⁻³ LG/nm2 in the cell population that only exhibited internalized NPs (Figure 3b), and with a further increase in ligand density, the majority of cells displayed NPs both internalized and bound to the outer membrane (Figure 3a.). Several reports have also observed optimal cellular internalization at intermediate ligand densities, and above this ligand density cellular internalization was not improved.46–48 One possible explanation for this is that the rod-shaped particles decorated at high ligand density are competing for receptors, and due to the large contact area of the rod-shaped particle with the cell, there is a depletion of available receptors to fully wrap the nanoparticles on the cell membrane, and therefore, endocytosis is decreased.49 This phenomenon is also observed in thermodynamic models, which predict that when ligand density increases beyond the optimal value, cellular uptake is decreased due to the adhesion strength between nanoparticles and cells.50 The 55 × 60 nm type, however, displayed cellular association independent of ligand density for both cell populations internalized and bound to the outer membrane (Figure 3c) and internalized only (Figure 3d). This may be attributed to the particle size, as there are multiple accounts stating that optimal particle diameter for receptor mediate endocytosis is 50 nm.50–53 To confirm particle association observed was due to EGFR-mediated endocytosis, a competition study was completed. A distinct trend was observed upon which an increase of free affibody concentration in cell culture led to a precipitous reduction in particle association indicating a direct dependence on the receptor-mediated endocytosis pathway for particle internalization (Figure 4). It is important to point out that cellular association is also dependent on particle dosage and that, upon increasing particle dosage with the 80 × 320 nm type, an enhancement in association was observed in all cell populations regardless of ligand density (Supplemental Figure 2) while negative controls, PEG and wild-type affibody, displayed limited association and uptake with both particle types. These results seem to indicate a limit in receptor-mediated endocytosis at a specific time point, particle dosage, and ligand density. As well, particle multivalency was shown to be a key factor improving cellular internalization, and ligand functionalization to the nanoparticle was imperative for any significant cell association.
Figure 3.

In vitro association of A431 cells with targeted 80 × 320 nm (A,B) and 55 × 60 nm NPs (C,D) was assessed via flow cytometry. Two cell populations are shown, the percentage was calculated by dividing the number of cells in the specific population by the total sum, one with NPs both bound to the outer cell membrane and internalized (A,C) and a second population with NPs only internalized (B,D). Negative controls, PEGylated and wild-type functionalized NPs, and positive control, cationic NPs, were also examined (N = 3).
Figure 4.
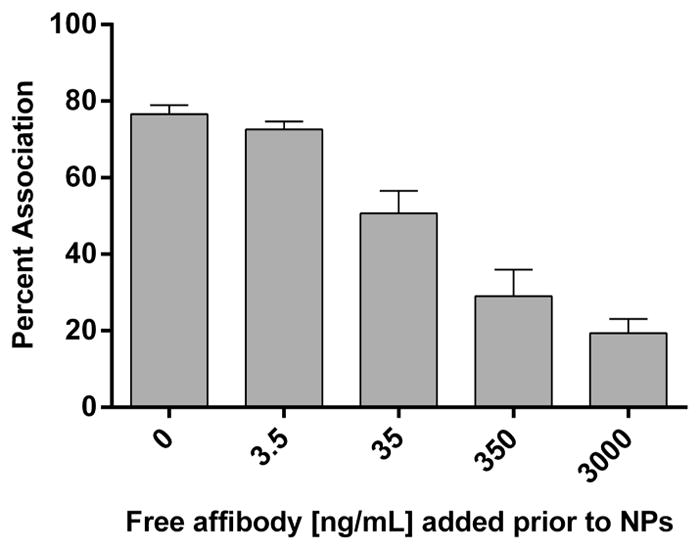
A431 cell association of 80 × 320 nm particles (ligand density = 1.1 × 10⁻³ LG/nm2) with predose of free affibody administered at five different concentrations 30 min prior to particle addition (N = 3).
Nonspecific uptake studies were conducted to further examine the mechanism of particle internalization as a function of targeting density. In general, nonspecific uptake with alveolar murine macrophage studies displayed negligible association with either set of particles, however, a significant boost in association was found at the highest ligand density for 80 × 320 nm particles (Figure 5). Additionally, mean fluorescence intensity increased with respect to ligand density for the rod-shaped NP, further indicating that a correlation exists between ligand density and nonspecific macrophage interaction with rod-shaped NPs (Supplemental Figure 4). Since ligand density was held roughly constant, these results suggest increased nonspecific uptake with rod-shaped 80 × 320 nm particles compared to sphere-like 55 × 60 nm particles. Similar to previous accounts, an increase in nonspecific association trended with ligand density, alluding to enhanced opsonization from deshielding of the PEG coating by proteins in media.23 In all in vitro experiments, cationic nanoparticles (nonfunctionalized particles), serving as a positive control, displayed near complete cellular association, which is expected due to the strong interaction between the negatively charged cellular membrane and the positive surface charge of amine-functional NPs; this interaction also falls in line with previous literature accounts.5 The PEG and wild-type, serving as negative controls, showed limited interaction with the EGFR-overexpressing cell-line. Based on these in vitro findings, it was clear that alterations in ligand density led to significant changes in target (A431) and phagocytic cellular interactions. Murine biodistribution studies were then conducted to elucidate how these in vitro results translate to in vivo behavior.
Figure 5.

Percent association of alveolar macrophage cells (MH-S) with targeted 80 × 320 nm (A) and 55 × 60 nm (B) at three distinct ligand densities (N = 3).
Biodistribution and blood pharmacokinetics were monitored as a function of targeting ligand density on the 80 × 320 nm hydrogel particle. In general, all study groups with targeted NPs displayed worse pharmacokinetic behavior in comparison to the nontargeted PEG control (Supplemental Table 2 and Supplemental Figure 5). The change in PK profiles was in direct correlation with targeting ligand density, as circulation half-life decreased from 11.2 h with the PEG control to 3.9, 3.3, and 0.7 h with increasing ligand density.29 The observed area-under-the-curve (AUC) showed substantial reductions over the PEGylated control, with 5- and 28-fold AUC reductions at the lowest and highest ligand densities, respectively. Clearance rates were drastically increased over the PEG control with 5- and 30-fold increases for the lowest and highest ligand densities, respectively. These findings corroborated with previous accounts in literature that describe enhanced nonspecific protein adsorption with ligand density increase potentially leading to subsequent opsonization and expedited blood clearance.23,46,47 Based upon these PK profiles, the targeting ligand density was optimized for biodistribution studies in A431-tumor bearing mice (Supplemental Figure 6). Specifically, targeting density at 4.5 × 10⁻³ LG/nm2 was not pursued due to the precipitous reduction in blood PK. A 24 h biodistribution study revealed vast differences in particle sequestration as a function of targeting ligand density. A shift from spleen to liver deposition was observed with targeting density enhancement, which could be due to innate high expression of EGFR in liver tissue.40 As observed with blood PK analysis targeting density greatly impacted blood retention; yet, even with the mitigated blood retention, tumor accumulation improved as a function of ligand density indicating possible multivalent effects toward the high-expression EGFR cell-line. From these results it was clear targeting density had a significant impact on in vivo outcomes. In order to further enhance tumor accumulation, we underwent a similar biodistribution study with the smaller 55 × 60 nm, as they exhibited superior passive tumor accumulation.
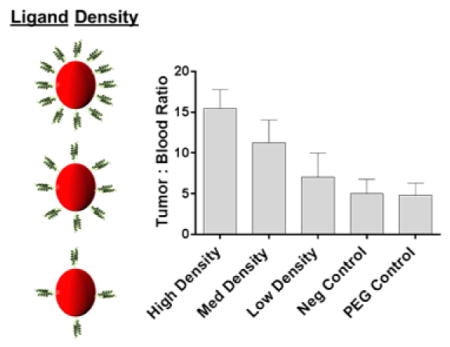
Biodistribution of 55 × 60 nm hydrogel was conducted as a function of targeting ligand density in an effort to further enhance tumor accumulation (Figure 6A,B). All of the 55 × 60 nm particles (targeted and nontargeted) exhibited considerably improved tumor accumulation over any of the 80 × 320 nm particles due to the major increase in passive accumulation. Again, all targeted NPs shifted deposition from spleen to liver in comparison to the nontargeted counterparts; however, unlike the larger particle, no discernible difference was observed in liver and spleen as a function of ligand density. In tumor tissue, the highest targeting ligand density demonstrated the best accumulation that was statistically similar to the nontargeted PEG control. At time points beyond 24 h, however, it is likely that the PEGylated particles would continue to accumulate in the tumor mass due to the enhanced blood circulation profile over the targeted counterparts. Even with the improved blood retention and probable boost in tumor accumulation beyond 24 h, the ZEGFR affibody particles have a significantly greater chance of binding and subsequently internalizing within diseased cell, as previously shown in vitro. In order to account for residual blood sequestration in the neo-plastic tissue, tumor/blood (T/B) ratios were calculated and a notable trend was observed (Figure 7). A direct relationship was seen between ligand density and (T/B) ratio, leading to statistically significant improvements in the targeted particle study groups over the nontargeted NPs. Similar to the higher aspect ratio particles, increasing targeting ligand density seemed to improve tumor accumulation while simultaneously sacrificing blood retention.
Figure 6.

Biodistribution (A) and sample IVIS images of harvested tissues (B) with 55 × 60 nm NPs at 24 h (N = 4). PEGylated (PEG) and Taq polymerase binder (NEG), a bacterial-binding protein, NPs were used as controls [Low LG = 1.2 × 10⁻³ LG/nm2; Med LG = 2.0 × 10⁻³ LG/nm2; High LG = 3.0 × 10⁻³ LG/nm2; LG = ligand]. **, P < 0.01.
Figure 7.

Ratio of targeted 50 nm × 60 nm particles between harvested tumor tissue and whole blood at 24 h (N = 4). PEGylated and Taq polymerase binder, a bacterial-binding protein, NPs were used as controls [Low LG = 1.2 × 10⁻³ LG/nm2; Med LG = 2.0 × 10⁻³ LG/nm2; High LG = 3.0 × 10⁻³ LG/nm2; LG = ligand]. **, P < 0.01; ***, P < 0.001.
Majority of previous accounts have explored the in vitro or in vivo effects of either modulating ligand density over a specific particle size/shape or a specific ligand density over different particle sizes/shapes.15,22,45,46,54–56 There are very few instances of evaluating how changes in ligand density over different particle sizes/shapes affects both in vitro cellular uptake and in vivo biodistribution. In this account, we have fabricated calibration-quality hydrogel nanoparticles using the PRINT technique at two distinct sizes and shapes. Even though remarkable efficacy has been previously established with the rod-shaped 80 × 320 nm particle, we found significantly improved passive accumulation with a 55 × 60 nm particle lending to potential improvement in future efficacy studies.35,36 In effort to retain improvements in macrophage inhibition, protein resistance, and extended PK profiles previously established with optimized poly(ethylene glycol) surface modulation, we developed a method to finely control the surface ligand density of an EGFR-binding affibody on two different PRINT particles.28 With the addition of targeting ligand, in vitro analysis yielded rapid association in epidermoid carcinoma cell-line that was dependent on EGFR receptor-mediated endocytosis; however, nonspecific uptake was observed in alveolar macrophage with the rod-shaped particle type at high ligand densities. In previous studies, an increase in nonspecific macrophage uptake correlated with a stark reduction in circulation persistence, which may help explain the drastic inverse correlation observed between ligand density and blood circulation with the 80 × 320 nm particle.28 However, even with the mitigated blood retention; targeting density had a direct relationship to tumor accumulation at 24 h. Upon targeting the sphere-like 55 × 60 nm particle, the PEGylated control and highly targeted counterpart exhibited statistically similar tumor accumulation; however, upon accounting for residual blood within the tumor a distinct trend was observed that displayed a direct correlation between increased ligand density and tumor accumulation. While passive accumulation remains the major factor dictating neoplastic delivery, we established that careful control over ligand density, as well as nanoparticle size and shape, is paramount when developing an effective delivery vehicle toward cancer.
Supplementary Material
Acknowledgments
Funding
This work was supported by Liquidia Technologies, the University Cancer Research Fund, and the Carolina Center for Cancer Nanotechnology Excellence (U54CA151652).
We thank Dr. Dongwook Kim and Dr. Rihe Liu for the allotment of targeting ligand and helpful scientific discussions, Dr. Ashish Pandya for the synthesis of HP4A, and the University of North Carolina Animal Studies Core for their assistance. Additionally, we thank Liquidia Technologies for the provision of PRINT molds used in the fabrication of our nanoparticles.
ABBREVIATIONS
Particle Replication in Nonwetting Templates
- NP
nanoparticle
- EPR
enhanced permeation and retention
- MPS
macrophage phagocytic system
- FITC
fluorescein isothiocyanate
- PEG
polyethylene glycol
- NHS
N-hydroxysuccinimide
- UV
ultraviolet
- IV
intravenous
- EGFR
epidermal growth factor receptor
- LG
ligand
- TB
trypan blue
- FRET
fluorescence resonance energy transfer
- PK
pharmacokinetics
- AUC
area-under-curve
Footnotes
Notes
The authors declare the following competing financial interest(s): Joseph M. DeSimone is a founder and maintains a financial interest in Liquidia Technologies. Liquidia was founded in 2004 to commercialize PRINT technology and other discoveries of Professor Joseph DeSimone and colleagues at the University of North Carolina, Chapel Hill.
The Supporting Information is available free of charge on the ACS Publications website at DOI: 10.1021/acs.nano-lett.5b01362.
Materials and methods, characterization of targeted NPs via DLS, fluorescence quantitation of affibody density, dosage-dependent cellular association of targeted 80 × 320 nm type, and pharmacokinetics/biodistribution of 80 × 320 nm targeted nanoparticles (PDF)
References
- 1.Li SD, Huang L. Mol Pharmaceutics. 2008;5:496–504. doi: 10.1021/mp800049w. [DOI] [PubMed] [Google Scholar]
- 2.Matsumura Y, Maeda H. Cancer Res. 1986;46:6387–6392. [PubMed] [Google Scholar]
- 3.Bertrand N, Wu J, Xu X, Kamaly N, Farokhzad OC. Adv Drug Delivery Rev. 2014;66:2–25. doi: 10.1016/j.addr.2013.11.009. [DOI] [PMC free article] [PubMed] [Google Scholar]
- 4.Heidel JD, Davis ME. Pharm Res. 2011;28:187–199. doi: 10.1007/s11095-010-0178-7. [DOI] [PubMed] [Google Scholar]
- 5.Alexis F, Pridgen E, Molnar LK, Farokhzad OC. Mol Pharmaceutics. 2008;5:505–515. doi: 10.1021/mp800051m. [DOI] [PMC free article] [PubMed] [Google Scholar]
- 6.Xiao K, Li Y, Luo J, Lee JS, Xiao W, Gonik AM, Agarwal RG, Lam SL. Biomaterials. 2011;32:3435–3446. doi: 10.1016/j.biomaterials.2011.01.021. [DOI] [PMC free article] [PubMed] [Google Scholar]
- 7.Yamamoto Y, Nagasaki Y, Kato Y, Sugiyama Y, Kataoka K. J Controlled Release. 2001;77:27–38. doi: 10.1016/s0168-3659(01)00451-5. [DOI] [PubMed] [Google Scholar]
- 8.Gref R, Luck M, Quellec P, Marchand M, Dellacherie E, Harnisch S, Blunk T, Muller RH. Colloids Surf, B. 2000;18:301–313. doi: 10.1016/s0927-7765(99)00156-3. [DOI] [PubMed] [Google Scholar]
- 9.Sun X, Rossin R, Turner JL, Becker ML, Joralemon MJ, Welch MJ, Wooley KL. Biomacromolecules. 2005;6:2541–2554. doi: 10.1021/bm050260e. [DOI] [PMC free article] [PubMed] [Google Scholar]
- 10.Gratton SEA, Napier ME, Ropp PA, Tian S, DeSimone JM. Pharm Res. 2008;25:2845–2852. doi: 10.1007/s11095-008-9654-8. [DOI] [PMC free article] [PubMed] [Google Scholar]
- 11.Huang X, Teng X, Chen D, Tang F, He J. Biomaterials. 2010;31:438–448. doi: 10.1016/j.biomaterials.2009.09.060. [DOI] [PubMed] [Google Scholar]
- 12.Frieboes HB, Wu M, Lowengrub J, Decuzzi P, Cristini V. PLoS One. 2013;8:1–11. doi: 10.1371/journal.pone.0056876. [DOI] [PMC free article] [PubMed] [Google Scholar]
- 13.Byrne JD, Betancourt T, Brannon-Peppas L. Adv Drug Delivery Rev. 2008;60:1615–1626. doi: 10.1016/j.addr.2008.08.005. [DOI] [PubMed] [Google Scholar]
- 14.Iinuma H, Maruyama K, Okinaga K, Sasaki K, Sekine T, Ishida O, Ogiwara N, Johkura K, Yonemura Y. Int J Cancer. 2002;99:130–137. doi: 10.1002/ijc.10242. [DOI] [PubMed] [Google Scholar]
- 15.Hrkach J, Hoff DV, Ali MM, Andrianova E, Auer J, Campbell T, Witt DD, Figa M, Figueiredo M, Horhota A, Low S, McDonnell K, Peeke E, Retnarajan B, Sabnis A, Schnipper E, Song JJ, Song YH, Summa J, Tompsett D, Troiano G, Hoven TVG, Wright J, LoRusso P, Kantoff PW, Bander NH, Sweeney C, Farokhzad OC, Langer R, Zale S. Sci Transl Med. 2012;4:128–139. doi: 10.1126/scitranslmed.3003651. [DOI] [PubMed] [Google Scholar]
- 16.Lopes de Monezes DE, Pilarski LM, Allen TM. Cancer Res. 1998;58:3320–3330. [PubMed] [Google Scholar]
- 17.Cheng Z, Zaki AA, Hui JZ, Muzykantiv VR, Tsourkas A. Science. 2012;338:903–910. doi: 10.1126/science.1226338. [DOI] [PMC free article] [PubMed] [Google Scholar]
- 18.Davis ME, Chen Z, Shin DM. Nat Rev Drug Discovery. 2008;7:771–782. doi: 10.1038/nrd2614. [DOI] [PubMed] [Google Scholar]
- 19.Hong S, Leroueil PR, Majoros IJ, Orr BG, Baker JR, Holl MMB. Chem Biol. 2007;14:107–115. doi: 10.1016/j.chembiol.2006.11.015. [DOI] [PubMed] [Google Scholar]
- 20.Kolhar P, Anselmo AC, Gupta V, Pant K, Prabhakarpandian B, Ruoslahti E, Mitagotri S. Proc Natl Acad Sci U S A. 2013;110:10753–10758. doi: 10.1073/pnas.1308345110. [DOI] [PMC free article] [PubMed] [Google Scholar]
- 21.Wang J, Tian S, Petros RA, Napier ME, DeSimone JM. J Am Chem Soc. 2010;132:11306–11313. doi: 10.1021/ja1043177. [DOI] [PMC free article] [PubMed] [Google Scholar]
- 22.Elias DR, Poloukhtine A, Popik V, Tsourkas A. Nanomedicine. 2013;9:194–201. doi: 10.1016/j.nano.2012.05.015. [DOI] [PMC free article] [PubMed] [Google Scholar]
- 23.Salvati A, Pitek AS, Monopoli MP, Prapainop K, Bombelli FB, Hristov DR, Kelly PM, Aberg C, Mahon E, Dawson KA. Nat Nanotechnol. 2013;8:137–143. doi: 10.1038/nnano.2012.237. [DOI] [PubMed] [Google Scholar]
- 24.Guzman J, Iglesias MT, Compan V, Andrio A. Polymer. 1997;38:5227–5232. [Google Scholar]
- 25.Montet X, Funovics M, Montet-Abou K, Weissleder R, Josephson L. J Med Chem. 2006;49:6087–6093. doi: 10.1021/jm060515m. [DOI] [PubMed] [Google Scholar]
- 26.Kim D, Yan Y, Valencia CA, Liu R. PLoS One. 2012;7:1–13. doi: 10.1371/journal.pone.0043077. [DOI] [PMC free article] [PubMed] [Google Scholar]
- 27.Rolland JP, Maynor BW, Euliss LE, Exner AE, Denison GM, DeSimone JM. J Am Chem Soc. 2005;127:10096–10100. doi: 10.1021/ja051977c. [DOI] [PubMed] [Google Scholar]
- 28.Perry JL, Reuter KG, Kai MP, Herlihy KP, Jones SW, Luft JL, Napier M, Bear JE, DeSimone JM. Nano Lett. 2012;12:5304–5310. doi: 10.1021/nl302638g. [DOI] [PMC free article] [PubMed] [Google Scholar]
- 29.Zhang Y, Huo M, Zhou J, Xie S. Comput Methods Programs Biomed. 2010;99:306–314. doi: 10.1016/j.cmpb.2010.01.007. [DOI] [PubMed] [Google Scholar]
- 30.Yuan F, Dellian M, Fukumura D, Leunig M, Berk DA, Torchilin VP, Jain RK. Cancer Res. 1995;55:3752–3756. [PubMed] [Google Scholar]
- 31.Perrault SD, Walkey C, Jennings T, Fischer HC, Chan WCW. Nano Lett. 2009;9:1909–1915. doi: 10.1021/nl900031y. [DOI] [PubMed] [Google Scholar]
- 32.Huo S, Ma H, Huang K, Liu J, Wei T, Jin S, Zhang J, He S, Liang X. Cancer Res. 2012;73:1–12. doi: 10.1158/0008-5472.CAN-12-2071. [DOI] [PubMed] [Google Scholar]
- 33.Schadlich A, Caysa H, Mueller T, Tenambergen F, Rose C, Gopferich A, Kuntsche J, Mader K. ACS Nano. 2011;5:8710–8720. doi: 10.1021/nn2026353. [DOI] [PubMed] [Google Scholar]
- 34.Chu KS, Hasan W, Rawal S, Walsh MD, Enlow EM, Luft JC, Bridges AS, Kuijer JL, Napier ME, Zamboni WC, DeSimone JM. Nanomedicine. 2013;9:686–693. doi: 10.1016/j.nano.2012.11.008. [DOI] [PMC free article] [PubMed] [Google Scholar]
- 35.Chu KS, Schorzman AN, Finniss MC, Bowerman CJ, Peng L, Luft JC, Madden AJ, Wang AZ, Zamboni WC, DeSimone JM. Biomaterials. 2013;34:8424–8429. doi: 10.1016/j.biomaterials.2013.07.038. [DOI] [PMC free article] [PubMed] [Google Scholar]
- 36.Chu KS, Finniss MC, Schorzman AN, Kuijer JL, Luft JC, Bowerman CJ, Napier ME, Haroon ZA, Zamboni WC, DeSimone JM. Nano Lett. 2014;14:1472–1476. doi: 10.1021/nl4046558. [DOI] [PMC free article] [PubMed] [Google Scholar]
- 37.Benhabbour SR, Luft JC, Kim D, Jain A, Wadhwa S, Parrott MC, Liu R, DeSimone JM, Mumper RJ. J Controlled Release. 2012;158:63–71. doi: 10.1016/j.jconrel.2011.10.013. [DOI] [PMC free article] [PubMed] [Google Scholar]
- 38.Sonavane G, Tomoda K, Makino K. Colloids Surf, B. 2008;66:274–280. doi: 10.1016/j.colsurfb.2008.07.004. [DOI] [PubMed] [Google Scholar]
- 39.Liu Y, Shah S, Hu W, Gao J. Adhesion Dynamics of Functional Nanoparticles for Targeted Drug Delivery. Proceedings of the 25th Southern Biomedical Engineering Conference (IFMBE); 2009. [Google Scholar]
- 40.Natarajan A, Wagner B, Sibilia M. Proc Natl Acad Sci U S A. 2007;104:17081–17086. doi: 10.1073/pnas.0704126104. [DOI] [PMC free article] [PubMed] [Google Scholar]
- 41.Ghaghada KB, Sauld J, Natarajanb JV, Bellamkondad RV, Annapragada AV. J Controlled Release. 2005;104:113–128. doi: 10.1016/j.jconrel.2005.01.012. [DOI] [PubMed] [Google Scholar]
- 42.Tang H, Chen X, Rui M, Sun W, Chen J, Peng J, Xu Y. Mol Pharmaceutics. 2014;11:3242–3250. doi: 10.1021/mp5001718. [DOI] [PubMed] [Google Scholar]
- 43.Wang B, Galliford CV, Low PS. Nanomedicine. 2014;9:313–330. doi: 10.2217/nnm.13.175. [DOI] [PubMed] [Google Scholar]
- 44.Albanese A, Tang PS, Chan CW. Annu Rev Biomed Eng. 2012;14:1–16. doi: 10.1146/annurev-bioeng-071811-150124. [DOI] [PubMed] [Google Scholar]
- 45.Giljohann DA, Seferos DS, Patel PC, Millstone JE, Rosi NL, Mirkin CA. Nano Lett. 2007;7:3818–3821. doi: 10.1021/nl072471q. [DOI] [PMC free article] [PubMed] [Google Scholar]
- 46.Gu F, Zhang L, Teply BA, Mann N, Wang A, Radovic-Moreno AF, Langer R, Farokhzad O. Proc Natl Acad Sci U S A. 2008;105:2586–2591. doi: 10.1073/pnas.0711714105. [DOI] [PMC free article] [PubMed] [Google Scholar]
- 47.Sykes EA, Chen J, Zheng G, Chan WCW. ACS Nano. 2014;8:5696–5706. doi: 10.1021/nn500299p. [DOI] [PubMed] [Google Scholar]
- 48.Fakhari A, Baoum A, Siahaan TJ, Le BK, Berkland C. J Pharm Sci. 2011;100:1045–1056. doi: 10.1002/jps.22342. [DOI] [PMC free article] [PubMed] [Google Scholar]
- 49.Zhang S, Li J, Lykotrafitis G, Bao G, Suresh S. Adv Mater. 2009;21:419–424. doi: 10.1002/adma.200801393. [DOI] [PMC free article] [PubMed] [Google Scholar]
- 50.Yuan H, Li J, Bao G, Zhang S. Phys Rev Lett. 2010;105:138101–138105. doi: 10.1103/PhysRevLett.105.138101. [DOI] [PubMed] [Google Scholar]
- 51.Chithrani BD, Ghazani AA, Chan WCW. Nano Lett. 2006;6:662–668. doi: 10.1021/nl052396o. [DOI] [PubMed] [Google Scholar]
- 52.Gao H, Shi W, Freund LB. Proc Natl Acad Sci U S A. 2005;102:9469–9474. doi: 10.1073/pnas.0503879102. [DOI] [PMC free article] [PubMed] [Google Scholar]
- 53.Decuzzi P, Pasqualini R, Arap W, Ferrari M. Pharm Res. 2009;26:235–243. doi: 10.1007/s11095-008-9697-x. [DOI] [PubMed] [Google Scholar]
- 54.Chithrani BD, Chan WCW. Nano Lett. 2007;7:1542–1550. doi: 10.1021/nl070363y. [DOI] [PubMed] [Google Scholar]
- 55.Kolhar P, Anselmo AC, Gupta V, Pant K, Prabhakarpandian B, Ruoslahti E, Mitragotri S. Proc Natl Acad Sci U S A. 2013;110:10753–10758. doi: 10.1073/pnas.1308345110. [DOI] [PMC free article] [PubMed] [Google Scholar]
- 56.Choi CHJ, Alabi CA, Webster P, Davis ME. Proc Natl Acad Sci U S A. 2010;107:1235–1240. doi: 10.1073/pnas.0914140107. [DOI] [PMC free article] [PubMed] [Google Scholar]
- 57.Fattorossi A, Nisini R, Pizzolo JG, D’amelio R. Cytometry. 1989;10:320–325. doi: 10.1002/cyto.990100311. [DOI] [PubMed] [Google Scholar]
- 58.Drevets DA, Campbell PA. J Immunol Methods. 1991;142:31–38. doi: 10.1016/0022-1759(91)90289-r. [DOI] [PubMed] [Google Scholar]
- 59.Nichols JE, Mock DJ, Roberts NJ. Arch Virol. 1992;130:441–455. doi: 10.1007/BF01309672. [DOI] [PubMed] [Google Scholar]
- 60.Mueller SN, Tian S, DeSimone JM. Mol Pharmaceutics. 2015;12:1356–1365. doi: 10.1021/mp500589c. [DOI] [PMC free article] [PubMed] [Google Scholar]
Associated Data
This section collects any data citations, data availability statements, or supplementary materials included in this article.