

Abstract
Carbapenem-resistant Enterobacteriaceae (CRE), a group of pathogens resistant to most antibiotics and associated with high mortality, are a rising emerging public health threat. Current approaches to infection control and prevention have not been adequate to prevent spread. An important but unproven approach is to have hospitals in a region coordinate surveillance and infection control measures. Using our Regional Healthcare Ecosystem Analyst (RHEA) simulation model and detailed Orange County, California, patient-level data on adult inpatient hospital and nursing home admissions (2011–2012), we simulated the spread of CRE throughout Orange County health-care facilities under 3 scenarios: no specific control measures, facility-level infection control efforts (uncoordinated control measures), and a coordinated regional effort. Aggressive uncoordinated and coordinated approaches were highly similar, averting 2,976 and 2,789 CRE transmission events, respectively (72.2% and 77.0% of transmission events), by year 5. With moderate control measures, coordinated regional control resulted in 21.3% more averted cases (n = 408) than did uncoordinated control at year 5. Our model suggests that without increased infection control approaches, CRE would become endemic in nearly all Orange County health-care facilities within 10 years. While implementing the interventions in the Centers for Disease Control and Prevention's CRE toolkit would not completely stop the spread of CRE, it would cut its spread substantially, by half.
Keywords: carbapenem-resistant Enterobacteriaceae, control measures, coordinated responses, regional spread, surveillance
Carbapenem-resistant Enterobacteriaceae (CRE) are considered an urgent public health threat by the Centers for Disease Control and Prevention (CDC) (1). Few treatment options exist for CRE infection, which can result in high mortality. The emergence of CRE across the United States has suggested that existing approaches to infection control and prevention may not be adequate to control the spread of CRE. CRE have been steadily increasing in prevalence over the past decade in many US regions. In 2011, 4.2% of Enterobacteriaceae were CRE, up from the 1.2% reported in 2001 (2, 3). CRE detection increased more than 5-fold between 2008 and 2012 (4). Within the first 6 months of 2012, 3.9% of acute-care hospitals and 17.8% of long-term acute-care hospitals (LTACs) reported at least 1 CRE infection (2). Additionally, as of January 2015, CRE has been confirmed in 48 states (5). These data strongly suggest that CRE will eventually become widespread if new tactics in controlling the spread of CRE are not adopted.
Some regions of the United States have experienced a particularly high burden or rapid spread of CRE (6). In regions with high CRE burden, the CDC has recommended (i.e., in the 2012 CRE toolkit) that health-care facilities in the region coordinate CRE surveillance and control measures (7). Previous studies have demonstrated the benefits of regional coordination of control measures for endemic pathogens such as methicillin-resistant Staphylococcus aureus (MRSA) and vancomycin-resistant enterococci (8–10). However, the dynamics of emerging pathogens are different from those of endemic pathogens, and CRE have specific characteristics that may mean that their patterns of spread are different in varying scenarios and settings, which leads to several key questions. First, if current trends persist, what will CRE prevalence in health-care facilities be in the coming years? Second, will existing approaches be adequate (i.e., each health-care facility acting independently in CRE control)? Third, what are the added benefits of regional implementation of the CDC's 2012 CRE toolkit (7), and how should the regional interventions be implemented (e.g., at what thresholds should aggressive control measures be employed)?
METHODS
The RHEA model
We used our previously described Regional Healthcare Ecosystem Analyst (RHEA) software (11) to generate an agent-based model of CRE for Orange County, California, which included detailed representations of all 28 acute-care hospitals serving adult patients (including 5 LTACs) and 74 nursing homes and the patients moving among these facilities and the community. We used the Orange County agent-based model to simulate CRE transmission and evaluate regional interventions. Table 1 shows key model inputs. Our model drew from detailed 2011–2012 Orange County patient-level data for adult inpatient hospital and nursing home admissions (12, 13).
Table 1.
Key Input Parameters, Values, and Sources Used in the RHEA Model to Simulate the Spread of Carbapenem-Resistant Enterobacteriaceae in Orange County, California
| Parameter | Type of Health-Care Facility |
Source (Reference No.) | |||||
|---|---|---|---|---|---|---|---|
| Acute-Care Hospitals |
Long-Term Acute-Care Hospitals |
Nursing Homes |
|||||
| Median | Range | Median | Range | Median | Range | ||
| Facility Characteristics | |||||||
| Daily capacitya | 125 | 14–356 | 69 | 26–100 | 97 | 27–277 | 12, 13 |
| Annual no. of adult admissions | 7,588 | 779–24,998 | 1,076 | 371–2,541 | 345 | 35–1,554 | 12, 13 |
| Mean length of stay, days | 5.4 | 4.2–6.9 | 25.7 | 12.3–34.2 | 107 | 36–362 | 12, 13 |
| No. of discharges to community | 3,552 | 277–15,604 | 350 | 159–1,785 | 245 | 20–1,462 | 12, 13 |
| No. of direct transfers to hospitals | 309 | 34–1,373 | 64 | 1–295 | 33 | 23–152 | 12, 13 |
| No. of direct transfers to nursing homes | 931 | 160–2,253 | 163 | 14–449 | 60 | 0–480 | 12, 13 |
| No. of readmissions | 1,952 | 276–6,318 | 323 | 186–1,005 | 318 | 11–1,317 | 12, 13 |
| Time to readmission, days | 91.6 | 76.1–104.4 | 72.4 | 41.4–113.6 | 44 | 1–365 | 12, 13 |
| No. of temporary discharges to hospitals | 65 | 0–192 | 13 | ||||
| Length of temporary stay, days | 6 | 0–14 | 13 | ||||
| CRE Parameters | |||||||
| Targeted point prevalence at year 7 from CRE emergence in Orange County, % | 25 | 8 | 23–27 | ||||
| Ratio of carriers to clinical isolates | 8:1 | 8:1 | 8:1 | 16, 28, 33b | |||
| Transmission coefficient | ICUs: 0.00025095 | 0.00467996 | 0.00411885–0.00834316 | 0.000057895 | 0–0.00053513 | —c | |
| General wards: 0.0001673 | |||||||
| Increased risk of readmission for CRE carriers on discharge, % | 80 | 80 | 80 | 22d | |||
| Persistent carriers (those who remain colonized), % | 30 | 30 | 30 | 34, 35 | |||
| Loss rate for CRE carriage at 12 months, %e | 50 | 50 | 50 | 36 | |||
| Sensitivity of single rectal swab, % | 70 | 70 | 17 | ||||
| Screening test sensitivity, % | 91 | 85–92 | 91 | 85–92 | 18–20 | ||
| Screening test specificity, % | 94 | 89–97 | 94 | 89–97 | 18–20 | ||
| Test turnaround time, days | 1 | 1 | 37 | ||||
Abbreviations: CRE, carbapenem-resistant Enterobacteriaceae; ICU, intensive care unit; RHEA, Regional Healthcare Ecosystem Analyst.
a The average daily number of patients in a facility.
b Also personal communication with Dr. Michael Lin (Rush University, Chicago, Illinois) on November 3, 2014.
c Parameterized by model.
d Also personal communication with Dr. Dawn Terashita (Los Angeles County Department of Public Health, Los Angeles, California) on January 12, 2013.
e Assumes a linear loss for the remaining 70% of carriers who experience loss of CRE carriage.
Briefly, the model represents each patient with a computational agent, which on a given day can either carry or not carry CRE (14). On each simulated day, thousands of these agents move from the community or other health-care facilities into the various health-care facilities in Orange County. Each virtual health-care facility has a number of virtual beds, based on its actual bed count. Acute-care facilities consist of multiple wards (general wards and intensive care units), while nursing homes consist of a single large ward, representing the high degree of social interaction among residents. Once a patient is admitted to a facility, a probability draw determines which of that facility's wards/units the patient will enter, and a draw from a facility and unit-/ward-specific length-of-stay distribution determines how long the patient will remain in the ward/unit and facility. CRE carriers draw from a CRE-specific length-of-stay distribution (on average, 7.6 days longer than noncarriers) generated from data on vancomycin-resistant enterococci carriage in Orange County (12). If transferring directly to an acute-care hospital, a patient from an LTAC would be admitted to an intensive care unit 50% of the time and a resident from a nursing home would be admitted to the intensive care unit 20% of the time (15), to represent patients requiring mechanical ventilation or similar intensive care.
Each day, within each ward/unit, patients mix homogeneously, and CRE carriers can transmit CRE to noncarriers, based on a ward- and facility-specific transmission coefficient (β): β × susceptible patients × infectious CRE patients. Once the patient's stay ends, the patient leaves the facility and has probabilities of returning to the community, directly transferring to another Orange County facility, or returning to the community for a period of time before being readmitted to the same or another facility. During a nursing home stay, a resident can experience a brief hospitalization during which his/her bed is held (i.e., temporary discharge). CRE carriers had a 1.8-fold increased risk of readmission within 365 days of discharge. Notably, 8 Orange County nursing homes did not receive patient transfers from other facilities due to lack of interfacility transfer (n = 5) or lack of transfer data (n = 3).
CRE spread and control scenarios
Our initial conditions assumed a CRE-naive region (i.e., no CRE cases in any health-care facility or among recently discharged patients) on day 0 and that each nursing home and LTAC's transmission coefficient (β) was calibrated to reach a target prevalence of 25% in LTACs and 8% in nursing homes 7 years from CRE introduction (year 0). We then parameterized the intensive care unit and general ward β coefficients, taking Orange County data into account, so that CRE prevalence trends matched those currently seen in Orange County facilities based upon epidemiologic surveys conducted in year 4 of CRE emergence (16). This corresponded to 75% and 50% of the average nursing home β's for intensive care units and general wards, respectively.
Our initial experimental scenario assumed that no CRE-specific control measures were in place—that is, a facility would detect only those CRE cases incidentally identified from cultures obtained for clinical reasons. As a result, only a fraction of CRE carriers would be detected; we assumed that for every carrier identified incidentally through clinical cultures, 8 would remain undetected. Facilities would place identified CRE carriers on contact precautions (i.e., a single room and use of gloves and gowns by staff). Known carriers would remain on contact precautions when transferred to other facilities or readmitted to the same facility. Nursing home residents with CRE infection (assumed to be 50% of known carriers) were placed in contact precautions for 10 days. Contact precautions reduced transmission by 50%, a combination of the efficacy of the intervention and health-care-worker compliance with the intervention (8).
Other experimental scenarios revolved around the recommendations in the CDC's 2012 CRE toolkit (7). These control strategies implement admission surveillance testing for CRE for patients directly transferred to hospitals or LTACs from another hospital or nursing home, followed by contact precautions (single room, staff glove and gown use) for those testing positive or with a prior history of CRE known to that institution. Testing consisted of rectal screening with a 1-day turnaround time, based upon chromogenic testing, with the test sensitivity and specificity of testing further adjusted for the sensitivity of a single rectal swab compared with multiple or multisite swabs (17–20).
The second experimental scenario represented uncoordinated CRE control, with each individual hospital acting independently in implementing active CRE surveillance and contact isolation when the number of CRE cases in that facility exceeded a certain trigger threshold. This is consistent with the facility-level recommendations in the CRE toolkit. The third scenario represented coordinated regional CRE control in which all hospitals cooperated in a regional CRE containment approach, implementing active CRE surveillance and contact precautions when CRE appeared in a certain number of hospitals (i.e., a trigger threshold) in Orange County. This scenario is consistent with the coordinated regional response recommended in the CRE toolkit.
Model outcomes and sensitivity analyses
Each simulation experiment involved running the Orange County model 50 times, with each run consisting of 1,000 trajectories for 10–15 simulated years to account for the stochasticity in the model. Reported results are the mean value, median value, and data distribution from each experiment.
Sensitivity analyses varied the trigger threshold for each scenario: for the uncoordinated CRE control scenario, individual hospital trigger thresholds of 1, 10, 20, 50, and 100 CRE cases identified, and for the coordinated regional CRE control scenario, countywide trigger thresholds of 1, 10, and 20 hospitals detecting a CRE case. Additional scenarios also explored varying hospital compliance (range, 15%–50% (16)) with implementing uncoordinated CRE control measures after identifying 10 CRE cases. In each of the aforementioned experiments, the control policy strategy of interest was in place from the time of initial CRE emergence, was instituted as soon as the relevant thresholds were met, and was evaluated over 10 simulated years. An additional set of experiments evaluated the impact of waiting (e.g., 1 or 3 years) until after CRE became endemic (simulation year 7) to implement active CRE surveillance and subsequent coordinated regional CRE control and the 5–7 years following the initiation of these interventions (i.e., a 15-year total time horizon).
RESULTS
In the absence of specific CRE control measures, CRE prevalence reached a countywide average of 11.1% 10 years after CRE introduction. The line of squares in Figures 1 and 2 shows the estimated CRE prevalence over time in the absence of specific CRE control measures. CRE would rapidly spread throughout the region and reach a prevalence of 3.1% in acute-care hospitals, 28.9% in LTACs, and 13.9% in nursing homes in 10 years (Figure 2). Countywide, 16,495 patients would acquire CRE (both newly acquired and reacquired) within those 10 years.
Figure 1.
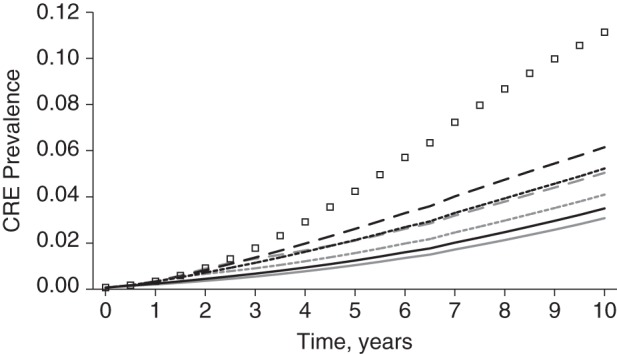
Simulated total countywide prevalence of carbapenem-resistant Enterobacteriaceae (CRE) in Orange County, California, in a model with no specific CRE control measures, uncoordinated CRE control measures, and coordinated regional CRE control measures implemented at trigger thresholds of 1, 10, and 20. The line of squares represents no specific control measures; black lines represent uncoordinated control measures at trigger thresholds of 1 (solid line), 10 (short-dashed line), and 20 (long-dashed line); and gray lines represent coordinated regional control at trigger thresholds of 1 (solid line), 10 (short-dashed line), and 20 (long-dashed line).
Figure 2.
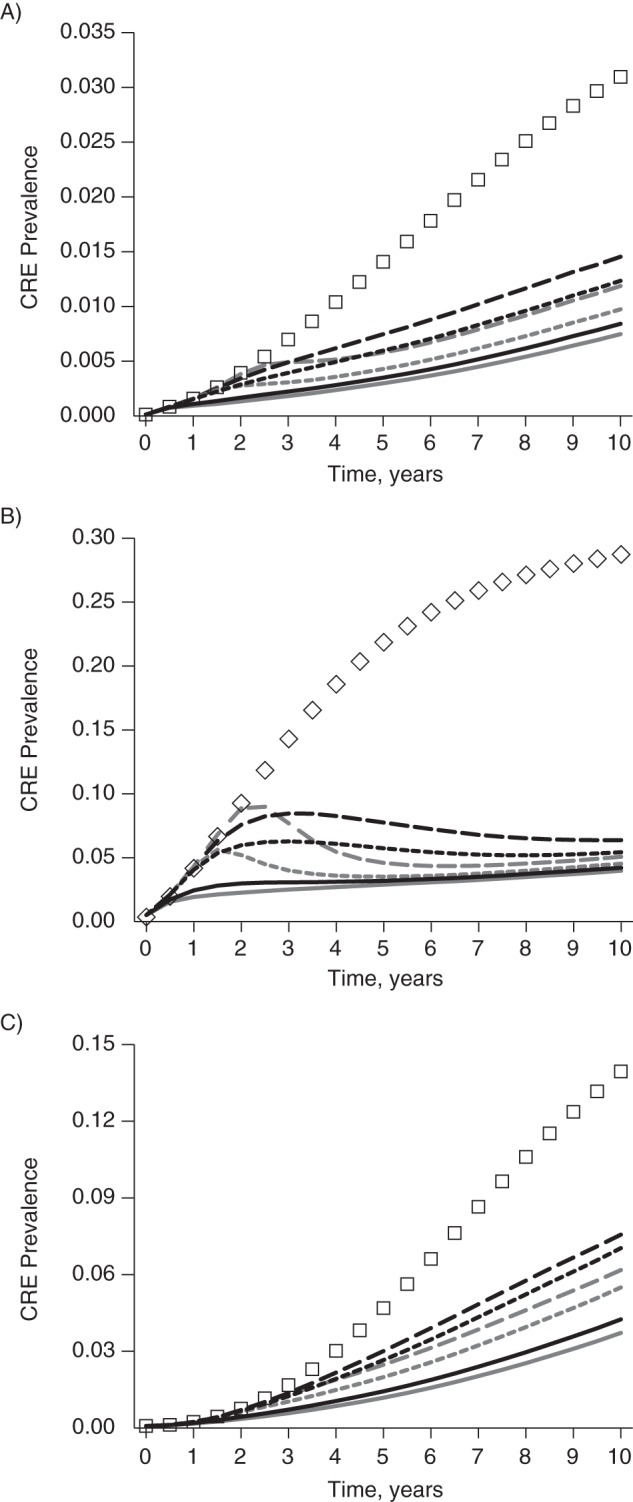
Simulated prevalence of carbapenem-resistant Enterobacteriaceae (CRE) in Orange County, California, in a model with no specific CRE control measures, uncoordinated CRE control measures, and coordinated regional CRE control measures implemented at trigger thresholds of 1, 10, and 20, by type of health-care facility. A) acute-care hospitals; B) long-term acute-care hospitals; C) nursing homes. The line of squares represents no specific control measures; black lines represent uncoordinated control measures at trigger thresholds of 1 (solid line), 10 (short-dashed line), and 20 (long-dashed line); and gray lines represent coordinated regional control at trigger thresholds of 1 (solid line), 10 (short-dashed line), and 20 (long-dashed line). (Note that y-axis scales are not the same across panels.)
Figure 1 shows the Orange County CRE prevalence for each scenario and trigger (results for triggers greater than 20 are shown in Web Figure 1, available at http://aje.oxfordjournals.org/). Coordinated regional approaches were consistently more effective than uncoordinated approaches. However, coordinated and uncoordinated approaches yielded similar results when very low triggers were used (trigger of 1, Figure 1). As triggers became higher (e.g., allowing for more cases before implementation of CRE control measures), the advantages of regional approaches grew. For example, uncoordinated approaches with a trigger of 10 cases resulted in a 5.2% countywide CRE prevalence (a 53.0% relative reduction compared with baseline), while a coordinated approach with a trigger of 10 hospitals resulted in a 4.1% countywide CRE prevalence (63.2% relative reduction) at year 10. With a trigger of 20, uncoordinated and coordinated regional approaches led to 45% and 55% relative reductions in countywide prevalence, respectively, at year 10.
Table 2 shows the number of transmission events averted countywide over a 10-year period for both approaches as compared with no CRE control. Over a 5-year period, aggressive control measures (trigger of 1) reduced transmission events by almost 3,000 cases regardless of a coordinated (2,976 events) or uncoordinated (2,789 events) approach. A less aggressive trigger of 10 resulted in 408 more averted cases using the regional coordinated approach as compared with the uncoordinated approach. An even less stringent trigger of 20 also resulted in more averted cases (n = 223) using the regional coordinated approach. LTACs had the greatest reduction in transmission events, due to their higher CRE prevalence in our model.
Table 2.
Average Number of CRE Transmission Events Averted Countywide in Orange County, California, Over a 10-Year Period as Compared With No CRE-Specific Control Measures, for Uncoordinated and Coordinated Regional Approaches Using Trigger Thresholds of 1, 10, and 20
| Time Since CRE Emergence, years | Type of Approach and Trigger Threshold |
|||||
|---|---|---|---|---|---|---|
| Uncoordinated Approaches |
Coordinated Regional Approaches |
|||||
| 1 | 10 | 20 | 1 | 10 | 20 | |
| 1 | 48 | 6 | 1 | 62 | 1 | 1 |
| 2 | 294 | 121 | 57 | 342 | 115 | 11 |
| 3 | 815 | 461 | 294 | 905 | 546 | 226 |
| 4 | 1,644 | 1,067 | 768 | 1,780 | 1,298 | 809 |
| 5 | 2,789 | 1,953 | 1,497 | 2,976 | 2,361 | 1,720 |
| 6 | 4,233 | 3,108 | 2,473 | 4,480 | 3,715 | 2,914 |
| 7 | 5,951 | 4,506 | 3,678 | 6,268 | 5,331 | 4,357 |
| 8 | 7,902 | 6,107 | 5,074 | 8,297 | 7,168 | 6,003 |
| 9 | 10,030 | 7,861 | 6,616 | 10,513 | 9,170 | 7,804 |
| 10 | 12,283 | 9,721 | 8,260 | 12,862 | 11,290 | 9,712 |
Abbreviation: CRE, carbapenem-resistant Enterobacteriaceae.
Figure 2 shows CRE prevalence for each facility type. Both uncoordinated and coordinated regional approaches showed the greatest benefit in LTACs, followed by nursing homes. Coordinated regional approaches produced a more rapid decline in CRE prevalence than did the uncoordinated strategy. The effect increased with higher trigger thresholds, especially in LTACs (Figure 2B). Web Table 1 quantifies the impact of CRE interventions on acute-care hospitals, LTACs, and nursing homes for each trigger up to 20. Both strategies generated a statistically significant difference in prevalence from baseline after 2 years with a trigger of either 1 or 10. Strategies with a trigger of 20 required at least 3 years to show a statistically significant difference from baseline.
Compared with a trigger of 1, delaying control until a trigger of 10 was reached resulted in an approximate 30% loss of effect for uncoordinated strategies and an approximate 20% loss of effect for coordinated strategies in acute-care hospitals and LTACs by year 5 (Web Table 1). Reductions in impact for a trigger of 10 versus a trigger of 1 were even greater (44% for uncoordinated and 30% for coordinated) for nursing homes. Delaying until a trigger of 20 was reached resulted in approximately half the effect by year 5 compared with a trigger of 1 (an approximate 50% loss for acute-care hospitals, 40% loss for LTACs, and a 60% loss for nursing homes via either strategy; Web Table 1).
Compliance with uncoordinated approaches substantially affected the benefits of CRE control measures (Figure 3). The countywide CRE prevalence reached 10.1% at year 10 when only 15% of hospitals implemented active surveillance at detection of 10 cases (an 8.8% relative reduction over those 10 years).
Figure 3.
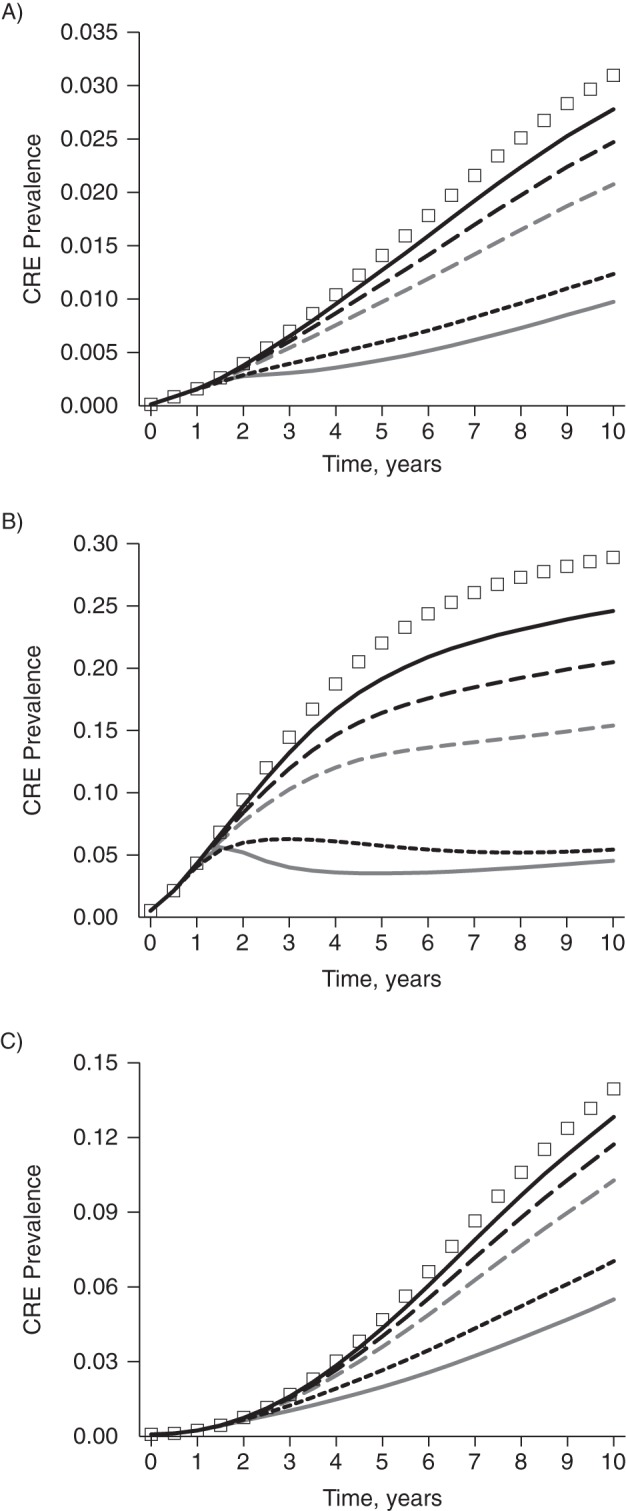
Simulated impact of hospital compliance with modeled control measures on the prevalence of carbapenem-resistant Enterobacteriaceae (CRE) in Orange County, California, when 15% (solid black line), 30% (long-dashed black line), 50% (dashed gray line), and 100% (short-dashed black line) of hospitals implement uncoordinated CRE control measures at a trigger threshold of 10, by type of health-care facility. A) acute-care hospitals; B) long-term acute-care hospitals; C) nursing homes. The line of squares represents no specific control measures, while the solid gray line represents coordinated regional control at a trigger of 10. (Note that y-axis scales are not the same across panels.)
Figure 4 shows what would happen if coordinated regional CRE control measures were not implemented until CRE became endemic in Orange County. If CRE is left unchecked without specific control measures, countywide CRE prevalence reaches 14.9% at year 15. If coordinated regional approaches are implemented in year 8, the countywide prevalence decreases to 9.4% by year 10 but steadily increases to 11.6% by year 15. If coordinated approaches are delayed until year 10, they have a marginal impact on CRE prevalence (12.2% at year 15). LTACs experience the most gain with late implementation, but the levels to which CRE are reduced are not the same as when implementation occurs before CRE become endemic (approximately 9% vs. approximately 5%; Figure 4B vs. Figure 2B).
Figure 4.
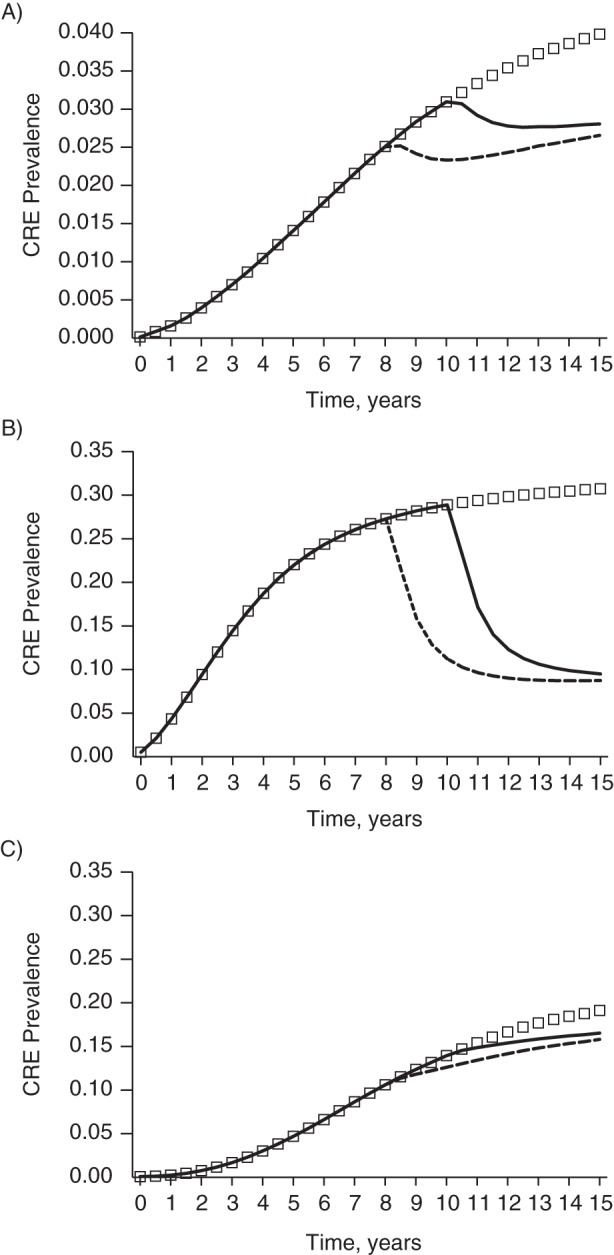
Simulated total countywide prevalence of carbapenem-resistant Enterobacteriaceae (CRE) in Orange County, California, in a model with no specific CRE control measures and coordinated regional CRE control measures implemented once CRE has become endemic (years 8 and 10). The line of squares represents no specific control measures; black lines represent coordinated regional CRE control implemented in year 8 (dashed line) or year 10 (solid line). (Note that y-axis scales are not the same across panels.)
DISCUSSION
Based on the current epidemiologic trends in CRE spread, our simulation model suggests that without implementation of CDC-recommended interventions, CRE will continue to spread among health-care facilities until they become endemic in Orange County. LTACs, which are well known epidemiologically as focal points for concentration of CRE (21–23), would experience by far the highest increase in prevalence. Likewise, nursing homes would experience a higher resulting prevalence, compared with the much smaller increases seen in hospitals. The effects observed for LTACs are due to their having greater importation of CRE among admitted patients, generally higher transmission coefficients (calibrated on the basis of studies in the literature (23–26)), longer patient lengths of stay, smaller sizes (e.g., lower bed capacity), and substantial interconnectivity with other facilities. The effects in nursing homes are due to their higher transmission coefficients (calibrated on the basis of studies in the literature (27)), longer lengths of stay, and extensive mixing among patients.
One way of mitigating CRE spread is for each acute-care hospital and LTAC to initiate CRE screening of all transfer patients (including resultant contact precautions for carriers) as soon as the number of CRE cases in that facility exceeds a certain threshold. The key is to set a low threshold (1, 10, and 20 CRE cases) for implementing control measures. If the threshold is too high, if the facility does not act quickly enough, or if the facility is not sufficiently compliant in implementing control measures, then CRE spread may not be adequately abated. Once a sufficient number of CRE cases are percolating throughout the network of facilities in a region, control becomes considerably more difficult. A major drawback of relying on individual facilities to detect cases and implement measures accordingly is the possibility that not all facilities would have the same determination of an important threshold or the same ability to ensure compliance. For instance, an individual facility might not be able to catch cases in a timely manner or might not be compliant with implementing control measures.
By comparison, we show that bringing facilities together to collectively signal the countywide presence of CRE cases and implement regional control measures can be substantially be more effective in stemming the spread of CRE. As the individual trigger for action is raised, the regional impact becomes increasingly greater than the sum of its parts. Diffusing the responsibility of detecting CRE cases across facilities makes it more likely that the CRE's spread will be detected earlier and thus contained before percolating extensively throughout the network. Countywide monitoring gives more leeway to catch the spread of CRE early. In other words, a facility does not have to wait until it sees CRE to implement CRE control measures. Therefore, the countywide triggers do not have to be as low to still be substantially more effective at controlling CRE than facilities acting individually. However, this assumes that hospitals are willing to be responsive to CRE cases occurring elsewhere in the county.
Coordinating facilities in a region may entail setting up an information system or implementing other means to facilitate more rapid communications among facilities and a centralized authority (e.g., a local or state public health department) to initiate and monitor infection control measures. Such a regional approach could have secondary benefits, such as engendering camaraderie among health-care facilities, helping control other pathogens, and fostering exchange of information and experience on disease control. A key consideration is that the burden of screening would be disproportionately shouldered by hospitals and LTACs, while the benefit would be greatest to LTACs and nursing homes. Therefore, coordinating authorities must be sensitive to this dynamic and help all facilities understand the collective and long-term benefits of such coordination.
Our results showed that impact of uncoordinated and coordinated regional approaches was, not unexpectedly, greatest in LTACs. This was probably due to many factors, including LTACs' higher prevalence rate based upon epidemiologic data, the aggressive control measures adopted by hospitals (including LTACs) as compared with nursing homes, and the high interconnectedness of LTACs with other facilities (including frequent patient-sharing with hospitals also implementing control measures). The relatively small size of LTACs also led to faster relative reductions in prevalence, as 1 fewer CRE case had a larger effect on the total prevalence.
Our simulation experiments for both uncoordinated and coordinated approaches modeled highly proactive infection control strategies. We demonstrated that preventing the spread of CRE before it fully manifests is much more effective than waiting for the problem to fully declare itself. Nevertheless, this requires hospitals to be willing to act before an outbreak or widespread transmission is noted, which may require a change of culture for many institutions. Once CRE has become endemic, more aggressive bundled interventions may be necessary. In a recent study, Hayden et al. (28) determined that a bundled intervention including high compliance screening, contact isolation, and decolonization with daily chlorhexidine bathing led to statistically significant reductions in Klebsiella pneumoniae carbapenemase-producing Enterobacteriaceae acquisition, prevalence, and bloodstream infections in LTACs.
Our results support the CDC's efforts to engage local and state health departments in active strategies focused on controlling the spread of antimicrobial-resistant pathogens (14). The extensive patient-sharing among health-care facilities in a region is the basis for the importance of interfacility cooperation (8, 29). Now evidence from both simulation modeling and clinical studies supports cooperation among facilities when attempting to control the spread of MRSA (8) and vancomycin-resistant enterococci (9, 10) in the United States and CRE in Israel (30, 31).
Our study does have limitations. All models are simplifications of real life (32), and as such they cannot represent every possible outcome. With our model, we attempted to portray outcomes that would be reasonably likely if CRE control strategies were widely adopted across a region. However, we assumed fairly proactive and aggressive measures. In several scenarios, we assumed that all hospitals would reliably implement CRE control strategies once the triggers had been reached, presumably in response to a regional public health request; in reality, individual facilities may not implement any control strategy, and consistency and sustainability may be an issue. Our results are also limited by the fact that the model was tailored to 1 region's extensive data on patient-sharing across facilities. To the extent that patient-sharing is uncommon due to large geographic distances between facilities or insurance restrictions, results may be quite different in different parts of the country. Moreover, our model assumed minimal community transmission of CRE and did not include pediatric facilities, although the literature suggests that children are less important drivers of the current epidemic. Finally, our model does not currently provide the necessary detail with which to evaluate high-risk patient characteristics, such as the impact of ventilator dependency or other comorbidity in driving CRE transmission.
Our study suggests that CRE will become endemic in a region without adequate interventions. Individual facilities can substantially reduce the spread of CRE by implementing the recommendations in the CDC toolkit (7), particularly if they initiate such control measures before CRE has become endemic. The most effective strategy may be to employ a regional coordinated approach in which all facilities implement the CDC toolkit measures when CRE cases appear in a threshold number of facilities. This proactive and coordinated approach appears to rapidly confine the spread of CRE.
Supplementary Material
ACKNOWLEDGMENTS
Author affiliations: Public Health Computational and Operations Research, Bloomberg School of Public Health, Johns Hopkins University, Baltimore, Maryland (Bruce Y. Lee, Sarah M. Bartsch); Center for Simulation and Modeling, University of Pittsburgh, Pittsburgh, Pennsylvania (Kim F. Wong); Infectious Disease Clinical Outcomes Research Unit, Los Angeles Biomedical Research Institute, Harbor-UCLA Medical Center, Torrance, California (James A. McKinnell); Torrance Memorial Medical Center, Torrance, California (James A. McKinnell, Loren G. Miller); Division of Healthcare Quality Promotion, Centers for Disease Control and Prevention, Atlanta, Georgia (Rachel B. Slayton, Alexander J. Kallen, John A. Jernigan); and Division of Infectious Diseases and Health Policy Research Institute, School of Medicine, UC Irvine Health, Irvine, California (Chenghua Cao, Diane S. Kim, Susan S. Huang).
All authors contributed significantly to this work.
This work was supported by the Agency for Healthcare Research and Quality (grant R01HS023317), the Eunice Kennedy Shriver National Institute of Child Health and Human Development, the Office of Behavioral and Social Sciences Research of the National Institutes of Health, and the Global Obesity Prevention Center at Johns Hopkins (grants U54HD070725 and 1 U01 HD086861). Personnel time was supported in part by an intergovernmental personnel act agreement with the Centers for Disease Control and Prevention. The research was also supported in part by the University of Pittsburgh Center for Simulation and Modeling through the supercomputing resources provided.
Preliminary results of this study were presented at the Society for Healthcare Epidemiology of America conference, Orlando, Florida, May 14–17, 2015.
The funders played no role in the design and conduct of the study; the collection, management, analysis, and interpretation of the data; or the preparation, review, or approval of the manuscript. The findings and conclusions in this report are those of the authors and do not necessarily represent the official position of the Centers for Disease Control and Prevention or the Agency for Healthcare Research and Quality.
S.S.H. conducts studies in participating hospitals and nursing homes which receive contributed products from Sage Products LLC (Cary, Illinois), Mölnlycke Health Care (Göteborg, Sweden), 3M (St. Paul, Minnesota), and the Clorox Company (Oakland, California).
REFERENCES
- 1.Centers for Disease Control and Prevention. Antibiotic Resistance Threats in the United States, 2013. Atlanta, GA: Centers for Disease Control and Prevention; 2013. [Google Scholar]
- 2.Jacob JT, Klein E, Laxminarayan R et al. Vital signs: carbapenem-resistant Enterobacteriaceae. Morb Mortal Wkly Rep. 2013;629:165–170. [PMC free article] [PubMed] [Google Scholar]
- 3.Guh AY, Limbago BM, Kallen AJ. Epidemiology and prevention of carbapenem-resistant Enterobacteriaceae in the United States. Expert Rev Anti Infect Ther. 2014;125:565–580. [DOI] [PMC free article] [PubMed] [Google Scholar]
- 4.Thaden JT, Lewis SS, Hazen KC et al. Rising rates of carbapenem-resistant Enterobacteriaceae in community hospitals: a mixed-methods review of epidemiology and microbiology practices in a network of community hospitals in the southeastern United States. Infect Control Hosp Epidemiol. 2014;358:978–983. [DOI] [PMC free article] [PubMed] [Google Scholar]
- 5.Centers for Disease Control and Prevention. Healthcare associated infections: tracking CRE. http://www.cdc.gov/hai/organisms/cre/TrackingCRE.html Updated July 8, 2015. Accessed July 13, 2015.
- 6.California Department of Public Health. California CRE Prevalence Survey, 2012. https://www.cdph.ca.gov/programs/hai/Pages/Carbapenem-ResistantEnterobacteriaceae.aspx Updated January 26, 2015. Accessed July 13, 2015.
- 7.Centers for Disease Control and Prevention. 2012 CRE Toolkit—Guidance for Control of Carbapenem-Resistant Enterobacteriaceae (CRE) Atlanta, GA: National Center for Emerging and Zoonotic Infections Diseases, Centers for Disease Control and Prevention; 2012. [Google Scholar]
- 8.Lee BY, Bartsch SM, Wong KF et al. Simulation shows hospitals that cooperate on infection control obtain better results than hospitals acting alone. Health Aff (Millwood). 2012;3110:2295–2303. [DOI] [PMC free article] [PubMed] [Google Scholar]
- 9.Ostrowsky BE, Trick WE, Sohn AH et al. Control of vancomycin-resistant enterococcus in health care facilities in a region. N Engl J Med. 2001;34419:1427–1433. [DOI] [PubMed] [Google Scholar]
- 10.Lee BY, Yilmaz SL, Wong KF et al. Modeling the regional spread and control of vancomycin-resistant enterococci. Am J Infect Control. 2013;418:668–673. [DOI] [PMC free article] [PubMed] [Google Scholar]
- 11.Lee BY, Wong KF, Bartsch SM et al. The Regional Healthcare Ecosystem Analyst (RHEA): a simulation modeling tool to assist infectious disease control in a health system. J Am Med Inform Assoc. 2013;20(e1):e139–e146. [DOI] [PMC free article] [PubMed] [Google Scholar]
- 12.Office of Statewide Health Planning and Development. California Inpatient Data Reporting Manual. MIRCal: Medical Information Reporting for California. Seventh Edition, Version 8.3, 2014. Sacramento, CA: California Office of Statewide Health Planning and Development; 2014. http://www.oshpd.ca.gov/HID/MIRCal/Text_pdfs/ManualsGuides/IPManual/TofC.pdf Updated September 2014. Accessed June 16, 2014. [Google Scholar]
- 13.Centers for Medicare & Medicaid Services. Long Term Care Minimum Data Set. Baltimore, MD: Centers for Medicare & Medicaid Services; 2014. [Google Scholar]
- 14.Slayton RB, Toth D, Lee BY et al. Vital signs: estimated effects of a coordinated approach for action to reduce antibiotic-resistant infections in health care facilities—United States. MMWR Morb Mortal Wkly Rep. 2015;6430:826–831. [PMC free article] [PubMed] [Google Scholar]
- 15.Wang HE, Shah MN, Allman RM et al. Emergency department visits by nursing home residents in the United States. J Am Geriatr Soc. 2011;5910:1864–1872. [DOI] [PMC free article] [PubMed] [Google Scholar]
- 16.Gohil S, Singh RD, Gombosev A et al. , eds. Emergence of carbapenemase resistant Enterobactereaceae (CRE) in Orange County, CA and support for regional strategies to limit spread. Presented at ID Week: A Joint Meeting of the Infectious Disease Society of America, Society for Healthcare Epidemiology of America, HIV Medicine Association, and the Pediatric Infectious Disease Society, Philadelphia, Pennsylvania, October 8–12, 2014. [Google Scholar]
- 17.Lewis JD, Enfield KB, Mathers AJ et al., eds. The limits of serial surviellance cultures in predicting clearance of colonization with carbapenemase-producing Enterobacteriaceae. Presented at ID Week: A Joint Meeting of the Infectious Disease Society of America, Society for Healthcare Epidemiology of America, HIV Medicine Association, and the Pediatric Infectious Disease Society, Philadelphia, Pennsylvania, October 8–12, 2014. [Google Scholar]
- 18.Vrioni G, Daniil I, Voulgari E et al. Comparative evaluation of a prototype chromogenic medium (ChromID CARBA) for detecting carbapenemase-producing Enterobacteriaceae in surveillance rectal swabs. J Clin Microbiol. 2012;506:1841–1846. [DOI] [PMC free article] [PubMed] [Google Scholar]
- 19.Wilkinson KM, Winstanley TG, Lanyon C et al. Comparison of four chromogenic culture media for carbapenemase-producing Enterobacteriaceae. J Clin Microbiol. 2012;509:3102–3104. [DOI] [PMC free article] [PubMed] [Google Scholar]
- 20.Adler A, Navon-Venezia S, Moran-Gilad J et al. Laboratory and clinical evaluation of screening agar plates for detection of carbapenem-resistant Enterobacteriaceae from surveillance rectal swabs. J Clin Microbiol. 2011;496:2239–2242. [DOI] [PMC free article] [PubMed] [Google Scholar]
- 21.Gupta N, Limbago BM, Patel JB et al. Carbapenem-resistant Enterobacteriaceae: epidemiology and prevention. Clin Infect Dis. 2011;531:60–67. [DOI] [PubMed] [Google Scholar]
- 22.Marquez P, Terashita D. Long-term acute care hospitals and carbapenem-resistant Enterobacteriaceae: a reservoir for transmission. Clin Infect Dis. 2013;579:1253–1255. [DOI] [PubMed] [Google Scholar]
- 23.Lin MY, Lyles-Banks RD, Lolans K et al. The importance of long-term acute care hospitals in the regional epidemiology of Klebsiella pneumoniae carbapenemase-producing Enterobacteriaceae. Clin Infect Dis. 2013;579:1246–1252. [DOI] [PMC free article] [PubMed] [Google Scholar]
- 24.Bhargava A, Hayakawa K, Silverman E et al. Risk factors for colonization due to carbapenem-resistant Enterobacteriaceae among patients exposed to long-term acute care and acute care facilities. Infect Control Hosp Epidemiol. 2014;354:398–405. [DOI] [PubMed] [Google Scholar]
- 25.Munoz-Price LS, Hayden MK, Lolans K et al. Successful control of an outbreak of Klebsiella pneumoniae carbapenemase-producing K. pneumoniae at a long-term acute care hospital. Infect Control Hosp Epidemiol. 2010;314:341–347. [DOI] [PubMed] [Google Scholar]
- 26.Prabaker K, Lin MY, McNally M et al. Transfer from high-acuity long-term care facilities is associated with carriage of Klebsiella pneumoniae carbapenemase-producing Enterobacteriaceae: a multihospital study. Infect Control Hosp Epidemiol. 2012;3312:1193–1199. [DOI] [PMC free article] [PubMed] [Google Scholar]
- 27.Ben-David D, Masarwa S, Navon-Venezia S et al. Carbapenem-resistant Klebsiella pneumoniae in post-acute-care facilities in Israel. Infect Control Hosp Epidemiol. 2011;329:845–853. [DOI] [PubMed] [Google Scholar]
- 28.Hayden MK, Lin MY, Lolans K et al. Prevention of colonization and infection by Klebsiella pneumoniae carbapenemase-producing Enterobacteriaceae in long-term acute-care hospitals. Clin Infect Dis. 2015;608:1153–1161. [DOI] [PMC free article] [PubMed] [Google Scholar]
- 29.Ciccolini M, Donker T, Köck R et al. Infection prevention in a connected world: the case for a regional approach. Int J Med Microbiol. 2013;303(6-7):380–387. [DOI] [PubMed] [Google Scholar]
- 30.Schwaber MJ, Lev B, Israeli A et al. Containment of a country-wide outbreak of carbapenem-resistant Klebsiella pneumoniae in Israeli hospitals via a nationally implemented intervention. Clin Infect Dis. 2011;527:848–855. [DOI] [PubMed] [Google Scholar]
- 31.Schwaber MJ, Carmeli Y. An ongoing national intervention to contain the spread of carbapenem-resistant Enterobacteriaceae. Clin Infect Dis. 2014;585:697–703. [DOI] [PubMed] [Google Scholar]
- 32.Lee BY. Digital decision making: computer models and antibiotic prescribing in the twenty-first century. Clin Infect Dis. 2008;468:1139–1141. [DOI] [PubMed] [Google Scholar]
- 33.Pisney LM, Barron MA, Kassner E et al. Carbapenem-resistant Enterobacteriaceae rectal screening during an outbreak of New Delhi metallo-β-lactamase-producing Klebsiella pneumoniae at an acute care hospital. Infect Control Hosp Epidemiol. 2014;354:434–436. [DOI] [PubMed] [Google Scholar]
- 34.O'Fallon E, Gautam S, D'Agata EMC. Colonization with multidrug-resistant gram-negative bacteria: prolonged duration and frequent cocolonization. Clin Infect Dis. 2009;4810:1375–1381. [DOI] [PubMed] [Google Scholar]
- 35.Feldman N, Adler A, Molshatzki N et al. Gastrointestinal colonization by KPC-producing Klebsiella pneumoniae following hospital discharge: duration of carriage and risk factors for persistent carriage. Clin Microbiol Infect. 2013;194:E190–E196. [DOI] [PubMed] [Google Scholar]
- 36.Zimmerman FS, Assous MV, Bdolah-Abram T et al. Duration of carriage of carbapenem-resistant Enterobacteriaceae following hospital discharge. Am J Infect Control. 2013;413:190–194. [DOI] [PubMed] [Google Scholar]
- 37.Nordmann P, Poirel L, Dortet L. Rapid detection of carbapenemase-producing Enterobacteriaceae. Emerg Infect Dis. 2012;189:1503–1507. [DOI] [PMC free article] [PubMed] [Google Scholar]
Associated Data
This section collects any data citations, data availability statements, or supplementary materials included in this article.