

Abstract
To reestablish homeostasis and mitigate stress, cells must activate a series of adaptive intracellular signaling pathways. The participation of the transcription factors TFEB and TFE3 in cellular adaptation to starvation is well established. Here, we show that TFEB and TFE3 also play an important role in the cellular response to ER stress. Treatment with ER stressors causes translocation of TFEB and TFE3 to the nucleus in a process that is dependent on PERK and calcineurin but not on mTORC1. Activated TFEB and TFE3 enhance cellular response to stress by inducing direct transcriptional upregulation of ATF4 and other UPR genes. Under conditions of prolonged ER stress, TFEB and TFE3 contribute to cell death, thus revealing an unexpected role for these proteins in controlling cell fate. This work evidences a broader role of TFEB and TFE3 in the cellular response to stress than previously anticipated and reveals an integrated cooperation between different cellular stress pathways.
Keywords: ATF4, ER stress, PERK, TFE3, TFEB
Subject Categories: Autophagy & Cell Death, Membrane & Intracellular Transport, Transcription
Introduction
Eukaryotic cells must adapt to a variety of fluctuating environmental conditions. When those fluctuations exceed a critical threshold, cells activate a series of adaptive intracellular signaling pathways aimed to mitigate stress, prevent potential damage, and restore homeostasis.
One of the best‐characterized stress pathways is the unfolded protein response (UPR), which is activated by perturbations of endoplasmic reticulum (ER) homeostasis (Hetz, 2012). The ER plays a critical role in lipid and protein biosynthesis as well as calcium store regulation. Accumulation of misfolded proteins in the ER lumen triggers UPR by the activation of three different but complimentary signaling pathways. These pathways are initiated by the activation of three ER membrane‐associated proteins, PERK (double‐stranded RNA‐activated protein kinase (PKR)‐like ER kinase), ATF6 (activating transcription factor‐6), and IRE1 (inositol requiring enzyme 1).
Activated PERK phosphorylates eukaryotic translation initiation factor 2 alpha (eIF2alpha). This leads to a global translational attenuation, thus reducing protein burden within the ER (Wek et al, 2006). Phosphorylation of eIF2alpha also results in translational upregulation of specific UPR‐dependent genes, such as activating transcriptional factor 4 (ATF4) (Harding et al, 2000). ATF4 promotes cell survival by inducing transcriptional upregulation of a number of genes required for autophagy, redox homeostasis, and amino acid import and synthesis (Harding et al, 2003; Schroder & Kaufman, 2005; Ameri & Harris, 2008). However, when ER stress is prolonged or too severe, ATF4 may contribute to apoptosis by promoting expression of CHOP (C/EBP homologous protein), a transcription factor that inhibits expression of BCL‐2 while upregulating pro‐apoptotic BIM (BCL‐2 interacting protein), thus triggering the activation of the mitochondria‐dependent apoptotic pathway. In addition, CHOP promotes expression of GADD34 (growth‐arrest and DNA damage‐inducible 34), which dephosphorylates eIF2alpha thereby resuming protein synthesis and sensitizing cells to apoptotic signals (Tabas & Ron, 2011). Phosphorylation of eIF2alpha and activation of ensuing signaling pathways is known as “integrated stress response” (ISR) (Harding et al, 2003).
Starvation is another major stressor to which cells must adapt. Recent evidence suggests that lysosomes play a critical role as nutrient sensors. This is due in part to the fact that mTORC1, a master regulator of nutrient sensing, is activated on the surface of lysosomal membranes in response to amino acids and growth factors (Sancak et al, 2008, 2010; Bar‐Peled et al, 2012). Under starvation conditions, inactivation of mTORC1 allows nuclear translocation of TFEB and TFE3, two transcription factors that mediate cellular adaptation to stress by simultaneously promoting lysosomal biogenesis, autophagy induction, as well as expression of critical mitochondrial and metabolic regulators (Sardiello et al, 2009; Settembre et al, 2011, 2012, 2013; Martina et al, 2012, 2014b; Roczniak‐Ferguson et al, 2012; Martina & Puertollano, 2013).
Relatively little is known about the interplay between different stress signaling pathways. Amino acid starvation induces activation of GCN2 (general control non‐derepressible 2), a high molecular weight protein kinase activated by uncharged tRNAs (Hinnebusch, 2005; Chaveroux et al, 2010; Baird & Wek, 2012). Activated GCN2 phosphorylates eIF2alpha and promotes upregulation of ATF4. In turn, ATF4 induces expression of REDD1, a negative regulator of mTORC1 (Whitney et al, 2009).
In this study, we addressed whether TFEB and TFE3 contribute in alleviating cellular stress in response to ER malfunction. We found that PERK‐mediated activation of calcineurin promoted nuclear translocation of TFEB and TFE3. Over‐expression of TFEB or TFE3 strengthened the cellular response to ER stress by upregulating expression of several UPR‐dependent genes, including ATF4, CHOP, and GADD34. Conversely, simultaneous depletion of TFEB and TFE3 made cells less susceptible to apoptosis upon prolonged treatment with tunicamycin. Overall, our results reveal an integrated cooperation between different cellular adaptation pathways in response to stress.
Results
TFE3 and TFEB translocate from the cytosol to the nucleus in response to ER stress
We have recently reported that TFE3 localizes mainly to the cytosol under normal conditions, but rapidly translocates to the nucleus when cells are placed in medium lacking serum or amino acids (starvation conditions) (Martina et al, 2014b) (Fig 1A). Once in the nucleus, TFE3 promotes cell adaptation to nutrient deprivation by upregulating transcription of numerous autophagic and lysosomal genes (Martina et al, 2014b). To test whether TFE3 might also be activated in response to other types of cellular stress, we treated ARPE‐19 cells with tunicamycin, an inhibitor of protein glycosylation widely used to induce ER stress. As seen in Fig 1A, treatment of cells with tunicamycin for 16 h caused a strong accumulation of endogenous TFE3 into the nucleus. As expected, we observed a robust increase in ATF4, phospho‐eIF2alpha, and CHOP protein levels, thus confirming that the ER stress response was activated under our experimental conditions (Fig 1B and C). Quantification of several independent experiments demonstrated that TFE3 accumulated in the nucleus in approximately 50% of cells after tunicamycin treatment, whereas only 10% of cells showed TFE3 nuclear staining in control conditions (Fig 1D). TFE3 localization to the nucleus was more pronounced under starvation conditions, with over 90% of starved cells showing nuclear TFE3 (Fig 1D). Activation of TFE3 in response to tunicamycin was also observed in MEFs (Fig 1E). Interestingly, the accumulation of TFE3 in the nucleus was stronger after long periods of incubation with the drugs (16 and 24 h), thus suggesting that TFE3 primarily respond to prolonged ER stress conditions (Fig 1E). Additionally, activation of TFE3 was detected upon induction of ER stress with brefeldin A (BFA) (Fig 1F and G).
Figure 1. TFEB and TFE3 translocate from the cytosol to the nucleus in response to ER stress.

- ARPE‐19 cells were incubated in the presence of DMSO (Control), tunicamycin (5 μg/ml), or starved (EBSS) for 16 h. Cells were fixed, permeabilized, and stained with an antibody against TFE3. Scale bar, 10 μm. Data are representative of three independent experiments.
- Immunoblot of protein lysates of ARPE‐19 cells treated as shown in (A). Data are representative of three independent experiments.
- ARPE‐19 cells incubated with tunicamycin as indicated in (A) were immunostained with antibody against CHOP. Scale bar, 10 μm. Data are representative of three independent experiments.
- Quantification of the percentage of ARPE‐19 cells with nuclear TFE3 upon tunicamycin (Tun.) or starvation (Strv.) treatments as indicated in (A) (mean ± SD of three independent experiments, one‐way ANOVA versus control‐treated cells, ***P < 0.001; n > 400 cells per condition).
- Wild‐type mouse embryonic fibroblast (MEF) cells were incubated in the presence of DMSO (Control) or tunicamycin (0.1 μg/ml) for the indicated times. Cells were fixed, permeabilized, and stained with antibodies against TFE3 (green) and CHOP (red). Scale bar, 10 μm. Data are representative of three independent experiments.
- Wild‐type MEF cells were incubated in the presence of DMSO (Control) or BFA (2.5 μg/ml) for 16 h. Cells were fixed, permeabilized, and stained with antibodies against TFE3 (green) and CHOP (red). Scale bar, 10 μm. Data are representative of three independent experiments.
- Quantification of the percentage of MEF cells with nuclear TFE3 upon DMSO (Control) or BFA 16‐h treatment (mean ± SD of two independent experiments, Student's t‐test analysis versus DMSO‐treated cells, ***P < 0.001; n > 400 cells per condition).
- Immunoblots of the subcellular distribution of TFE3 and TFEB in MEF cells incubated with DMSO (Ctrl.) or tunicamycin (Tun.) for 16 h using antibodies against TFE3, TFEB, Lamp1 (as a lysosomal membrane marker), and H3b (as a nuclear marker). Data are representative of three independent experiments.
Source data are available online for this figure.
To confirm our results, we performed subcellular fractionation analysis in MEFs. As expected, we found that the amount of endogenous TFE3 in the nucleus increased upon treatment with tunicamycin (Fig 1H). Interestingly, we also observed augmented accumulation of nuclear TFEB in response to ER stress (Fig 1H). These results suggest that both transcription factors might participate in UPR.
PERK is necessary for TFE3 activation in response to ER stress
To further confirm that translocation of TFE3 to the nucleus in response to tunicamycin was a direct consequence of ER stress, we assessed TFE3 activation in PERK and GCN2‐knockout MEFs. PERK and GCN2 phosphorylate eIF2alpha in response to ER stress and amino acid starvation, respectively, thus promoting translational upregulation of specific UPR‐dependent genes. In agreement with previous reports, we observed that upregulation of ATF4 and CHOP was reduced in PERK‐KO MEFs in response to tunicamycin but not in response to starvation. Conversely, the absence of GCN2 inhibited upregulation of ATF4 and CHOP by starvation but not tunicamycin treatment (Fig 2A). We next monitored nuclear accumulation of TFE3 in response to ER stress. Similarly to ARPE‐19 cells, only a very small percent of wild‐type MEFs (< 5%) showed accumulation of TFE3 in the nucleus under normal conditions, whereas this number increased to almost 60% upon treatment with tunicamycin for 16 h (Fig 2B and E). The absence of GCN2 did not noticeably affect TFE3 activation under ER stress conditions (Fig 2C and E). In contrast, activation of TFE3 in response to tunicamycin was severely impaired in PERK‐KO MEFs with almost no variation in the levels of nuclear TFE3 between control and treated cells (Fig 2D and E). The requirement of PERK for TFE3 activation by tunicamycin is relevant because it argues against the possibility that TFE3 could be sensing the hypothetical effect of tunicamycin in other cellular compartments (e.g. lysosomes). Consequently, our results suggest that TFE3 activation is directly induced by ER stress.
Figure 2. Tunicamycin‐induced TFE3 activation requires PERK .

-
AImmunoblot of protein lysates from wild‐type, PERK‐KO, and GCN2‐KO MEF cells incubated in the presence of DMSO (Control), tunicamycin (0.1 μg/ml), or starved in EBSS for 16 h. Data are representative of three independent experiments.
-
B–DWild‐type (B), GCN2‐KO (C), and PERK‐KO (D) MEF cells incubated in the presence of DMSO (Control) or tunicamycin (0.1 μg/ml) as indicated in (A). Cells were fixed, permeabilized, and stained with antibodies against TFE3 (green) and CHOP (red). Scale bar, 10 μm. Data are representative of three independent experiments.
-
E, FQuantification of the percentage of MEF cells with nuclear TFE3 upon DMSO (Control), tunicamycin treatments for 16 h (E), or starvation for 2 h (F) (mean ± SD of three independent experiments, one‐way ANOVA versus DMSO‐treated cells, ns= not significant, ***P < 0.001; n > 400 cells per condition).
-
GQuantification of phospho‐4EBP1 protein levels in wild‐type and GCN2‐KO MEF cells upon starvation for 2 h (the mean ± SD of the fold increase of the phospho‐4EBP1 to total 4EBP1 ratio from three independent experiments, one‐way ANOVA versus starvation‐treated wild‐type cells, ***P < 0.001).
-
HQuantification of the percentage of MEF cells with nuclear TFE3 upon DMSO (Control) or Torin‐1 (250 nM) treatments for 1 h (mean ± SD of three independent experiments, one‐way ANOVA versus DMSO‐treated wild‐type cells, ***P < 0.001; n > 400 cells per condition).
Source data are available online for this figure.
Nuclear accumulation of TFE3 in response to starvation was normal in PERK‐KO cells (Fig 2F), further confirming that only the ER stress‐induced activation of TFE3 is mediated by PERK. Unexpectedly, we found that TFE3 activation in response to starvation was significantly impaired in GCN2‐KO MEFs (Fig 2F). This reveals a previously uncharacterized role for GCN2 in TFE3 response to nutrient deprivation. It was previously suggested that GCN2 might contribute to mTORC1 regulation. In the liver of GCN2 KO mice, phosphorylation of 4EBP1 and p70S6 kinase persisted after prolonged leucine starvation (Anthony et al, 2004). Consistent with these results, we observed sustained mTORC1 activation in starved GCN2‐KO MEFs (Fig 2G). Moreover, treatment with Torin‐1, a catalytic inhibitor of mTOR, resulted in comparable TFE3 activation in wild‐type and GCN2‐KO MEFs (Fig 2H). Therefore, our results suggest that the inefficient TFE3 activation observed in starved GCN2‐KO MEFs may be a result of persistent mTORC1 activation. However, it is also possible that GCN2 have additional contributions to TFE3 activation under starvation conditions.
Calcineurin contributes to TFE3 activation in response to tunicamycin
We have previously shown that mTORC1 plays a critical role in the regulation of TFE3 activity (Martina et al, 2014b). In fully fed cells, mTORC1 phosphorylates TFE3 at serine 321 (S321), thus promoting binding of TFE3 to 14‐3‐3 and retention of the transcription factor in the cytosol. Inactivation of mTORC1 by starvation leads to dissociation of the TFE3/14‐3‐3 complex and transport of TFE3 to the nucleus (Appendix Fig S1A). Likewise, mutation of S321 to alanine prevents the interaction between TFE3 and 14‐3‐3 and results in TFE3 nuclear accumulation even when cells are grown in nutrient‐rich conditions (Martina et al, 2014b and Fig 3A). To further understand the mechanism of TFE3 activation in response to ER stress, we generated a phospho‐specific antibody that recognizes TFE3 only when phosphorylated at S321. As expected, our antibody efficiently recognized wild‐type TFE3 but not the TFE3‐S321A mutant (Fig 3B). We then performed subcellular fractionation experiments in ARPE‐19 cells and MEFs after treatment with either tunicamycin or the mTOR inhibitor Torin‐1. Importantly, we found that our antibody recognized cytosolic but not nuclear TFE3, thus indicating that the fraction of TFE3 present in the nucleus upon tunicamycin or Torin‐1 treatment is not phosphorylated at S321 (Fig 3C and Appendix Fig S1B). Moreover, nuclear TFE3 was unable to bind 14‐3‐3 (Fig 3D).
Figure 3. Contribution of calcineurin to the activation of TFE3 in response to tunicamycin.

- ARPE‐19 cells infected with either adenovirus expressing TFE3‐WT‐Myc or TFE3‐S321A‐Myc for 16 h. Cells were fixed, permeabilized, and stained with antibodies against Myc. Scale bar, 10 μm. Quantification of the percentage of ARPE‐19 cells with nuclear TFE3‐Myc (means ± SD of 3 independent experiments, Student's t‐test, ****P < 0.0001; n > 400 cells per condition).
- Immunoblots of protein lysates from ARPE‐19 cells infected as indicated in (A). Data are representative of three independent experiments.
- Immunoblots of TFE3‐Ser321 phosphorylation state in nuclear fractions of ARPE‐19 cells incubated with DMSO (Ctrl.), tunicamycin (Tun.), or Torin‐1. Data are representative of three independent experiments.
- Immunoblots of protein of a GST pull‐down from nuclear fractions of MEF cells treated with DMSO or tunicamycin (5 μg/ml) (Tun.) for 16 h. Data are representative of three independent experiments.
- Immunoblots of protein lysates from ARPE‐19 cells incubated in the presence of DMSO (Ctrl.), tunicamycin (5 μg/ml) (Tun.), or starved in EBSS (Strv.) for 16 h. Data are representative of three independent experiments.
- Quantification of the percentage of ARPE‐19 cells with nuclear TFE3 upon tunicamycin (Tun.) or tunicamycin + FK506 treatments for 16 h (mean ± SD of three independent experiments, one‐way ANOVA versus tunicamycin‐treated cells, ***P < 0.001; n > 400 cells per condition).
- Quantification of the percentage of calcineurin‐depleted ARPE‐19 cells with nuclear TFE3 upon tunicamycin (Tun.) or starvation (Strv.) treatments for 16 h (mean ± SD of three independent experiments, one‐way ANOVA versus siNon‐target‐treated cells within the indicated treatment, ns = not significant, *P < 0.05, **P < 0.01, ***P < 0.001; n > 400 cells per condition).
- Immunoblots of protein lysates from ARPE‐19 cells depleted of calcineurin catalytic subunits PPP3CA and PPP3CB. Data are representative of three independent experiments.
- Relative quantitative real‐time PCR analysis of PPP3CA and PPP3CB mRNA transcript levels in ARPE‐19 cells depleted of calcineurin catalytic subunits PPP3CA and PPP3CB (mean ± SD of the RNA fold change of indicated mRNAs normalized to actin mRNA from three independent experiments, one‐way ANOVA versus the siNon‐Target (siNT)‐treated cells, ***P < 0.001).
- Quantification of the percentage of ATF4‐depleted ARPE‐19 cells with nuclear TFE3 upon tunicamycin treatment for 16 h (mean ± SD of two independent experiments, one‐way ANOVA versus siNon‐target‐treated cells within the indicated treatment, ***P < 0.001; n > 400 cells per condition).
Source data are available online for this figure.
Next, we assessed whether the decreased S321 phosphorylation observed in tunicamycin‐treated cells was due to reduced mTORC1 activity. ARPE‐19 cells were either starved or treated with tunicamycin for 16 h, and mTORC1 activity was measured by monitoring the phosphorylation status of 4EBP1 and p70S6 kinase, two well‐known targets of mTORC1. Expectedly, starvation resulted in strong mTORC1 inactivation (Fig 3E). In contrast, tunicamycin treatment did not noticeably alter mTORC1 activity (Fig 3E). To further confirm these data, we performed a time course for mTORC1 activity in response to ER stress. ARPE‐19 cells were treated with tunicamycin for 6, 8, 16, and 24 h. Quantification of three independent experiments did not reveal significant differences in the phosphorylation status of AKT or the mTORC1 substrates p70S6K and 4EBP following tunicamycin treatment (Appendix Fig S1C–E). In addition, mTORC1 stayed associated with lysosomes at all times in tunicamycin‐treated cells, further suggesting that mTOR remains active under ER stress conditions (Appendix Fig S1F). Although we observed a slight increase in the amount of cytosolic mTOR at 24 h tunicamycin treatment, Person's coefficient analysis did not reveal significant differences in co‐localization between mTOR and LAMP1 at any of the analyzed time points (Appendix Fig S1G). In contrast to ARPE‐19 cells, long‐term tunicamycin treatment caused some decrease in mTORC1 activity in MEFs (Appendix Fig S1H). However, this reduction was not sufficient to cause TFE3 nuclear translocation, since the level of mTORC1 inhibition was comparable or even more pronounced in cells depleted of PERK and yet TFE3 activation was abolished in PERK‐KO MEFs. All together, our results indicate that ER stress‐induced TFE3 nuclear translocation does not require mTORC1 inactivation.
The Ballabio group has recently reported that the calmodulin‐regulated protein phosphatase calcineurin plays an important role in TFEB regulation (Medina et al, 2015). By dephosphorylating specific residues, calcineurin promotes transport of TFEB to the nucleus. Importantly, phosphorylated PERK increases the enzymatic activity of calcineurin by direct interaction both in myocytes and in endocrine pancreatic β‐cells (Bollo et al, 2010; Wang et al, 2013; Liu et al, 2014). Furthermore, in pancreatic β‐cells, PERK is thought to coordinate Ca2+ dynamics between the ER and cytoplasm and that this regulation is mediated by calcineurin (Wang et al, 2013). Therefore, we assessed whether calcineurin might regulate TFE3 activity and whether it contributes to TFE3 activation in response to ER stress. As seen in Fig 3F, translocation of TFE3 to the nucleus upon tunicamycin treatment was significantly reduced in the presence of the calcineurin inhibitor FK506. To ensure that calcineurin was efficiently inactivated under our experimental conditions, we monitored the activation of a well‐known calcineurin effector, NFAT, in response to thapsigargin (Prasad & Inesi, 2009; Fric et al, 2012). As expected, inactivation of calcineurin by FK506 completely abolished translocation of NFAT to the nucleus (Appendix Fig S1I).
Calcineurin is a heterodimeric protein consisting of a regulatory and a catalytic subunit. Two catalytic subunits, PPP3CA and PPP3CB, encoded by different genes, have been described. To confirm the role of calcineurin in TFE3 activation, we used siRNAs to deplete endogenous calcineurin. Interestingly, depletion of PPPC3B, but not PPPC3A, resulted in reduced TFE3 activation in tunicamycin‐treated cells (Fig 3G). In contrast, PPP3CA depletion had a stronger effect on TFE3 activation under starvation conditions (Fig 3G). Simultaneous depletion of both catalytic subunits further decreased nuclear TFE3 under both, starvation and ER stress conditions (Fig 3G). In all cases, efficient depletion of calcineurin was confirmed by immunoblot and quantitative RT–PCR (Fig 3H and I). It is important to note that inhibition or depletion of calcineurin significantly reduced but did not completely abolish translocation of TFE3 to the nucleus. Although we cannot rule out that FK506 may be inducing only a partial inhibition of calcineurin or that our calcineurin depletion is not 100% efficient, it is likely that additional, unidentified factors participate in TFE3 activation under ER stress and starvation conditions. Interestingly, depletion of ATF4 did not prevent TFE3 nuclear translocation in tunicamycin‐treated cells, thus indicating that ATF4 downstream signaling is not required for TFE3 activation and further suggesting a direct PERK–calcineurin connection (Fig 3J). All together, our results reveal a novel role for calcineurin in TFE3 regulation and suggest that the relative contribution of PPP3CA and PPP3CB on TFE3 activation may depend on the type of cellular stress.
TFE3 and TFEB induce transcriptional upregulation of lysosomal and autophagic genes in response to ER stress
It is well established that TFE3 and TFEB induce transcriptional upregulation of autophagic and lysosomal genes in response to starvation. Increased expression of autophagic genes is also an important component of the cellular response to ER stress. However, it remains to be determined whether ER stress leads to increased lysosomal biogenesis. To test this possibility, we monitored expression of lysosomal and autophagic genes under ER stress conditions. We found that transcription of several lysosomal (MCOLN1, ATP6V1C1, HEXA) and autophagic (UVRAG) genes markedly increased in response to tunicamycin. Interestingly, this upregulation was significantly impaired in cells depleted of TFE3 and TFEB (Fig 4A and B). These results indicate that TFE3 and TFEB promote expression of autophagic and lysosomal genes in response to ER stress.
Figure 4. TFEB‐ and TFE3‐dependent upregulation of lysosomal and autophagic genes upon tunicamycin treatment.

- Relative quantitative real‐time PCR analysis of TFEB and TFE3 mRNA transcript levels in ARPE‐19 cells depleted of TFEB and TFE3 (mean ± SD of the RNA fold change of indicated mRNAs normalized to actin mRNA from three independent experiments, Student's t‐test versus siNon‐Target (siNT)‐treated cells, ***P < 0.001).
- Relative quantitative real‐time PCR analysis of MCOLN1, ATP6V1C1, HEXA, and UVRAG mRNA transcript levels in ARPE‐19 cells depleted of TFEB and TFE3 upon incubation with DMSO (Control) or tunicamycin (5 μg/ml) for 16 h (mean ± SD of the RNA fold change of indicated mRNAs normalized to actin mRNA from three independent experiments, one‐way ANOVA versus the same treatment condition in the siNon‐Target (siNT)‐treated cells or versus the DMSO condition in siNon‐Target (siNT)‐treated cells, *P < 0.05, **P < 0.01, ***P < 0.001).
TFE3 and TFEB enhance UPR by inducing transcriptional upregulation of ATF4
We next investigated whether TFEB and TFE3 contribute to UPR in additional ways. For this, we over‐expressed a constitutively active version of TFEB (TFEB‐S211A). This mutant cannot bind 14‐3‐3 and primarily accumulates in the nucleus (Martina et al, 2012; Roczniak‐Ferguson et al, 2012). As seen in Fig 5A and B, the induction of several UPR genes, including ATF4 and the ATF4 targets, CHOP and GADD34, was significantly increased in tunicamycin‐treated cells expressing TFEB‐S211A when compared to control cells. Expression of ATF4, CHOP, and GADD34 was also dramatically upregulated by TFEB‐S211A in cells subjected to starvation stress (Fig 5A and B). Over‐expression of wild‐type TFE3 also resulted in increased ATF4 protein levels following either starvation or tunicamycin treatment (Fig 5A and B). These results suggest that TFEB and TFE3 contribute to enhance the ATF4‐mediated stress response.
Figure 5. Over‐expression of TFEB or TFE3 enhances the ATF4‐mediated stress response.

- Immunoblots of protein lysates from ARPE‐19 cells infected with either adenovirus expressing Null, TFEB‐S211A, or TFE3 upon incubation with DMSO (Control), tunicamycin (5 μg/ml) or starved in EBSS for 16 h. Data are representative of five independent experiments.
- Quantification of ATF4, CHOP, and GADD34 protein levels in ARPE‐19 cells treated as indicated in (A) (mean ± SD of the fold change of the indicated protein to actin ratio from three independent experiments, one‐way ANOVA versus the corresponding treatment condition in the adenovirus‐Null‐infected cells, *P < 0.05, **P < 0.01, ***P < 0.001).
- Relative quantitative real‐time PCR analysis of ATF4, CHOP, GADD34, and MCOLN1 mRNA transcript levels in ARPE‐19 cells treated as indicated in (A) (mean ± SD of the RNA fold change of indicated genes normalized to actin mRNA from three independent experiments, one‐way ANOVA versus the corresponding treatment condition in the adenovirus‐Null‐infected cells, **P < 0.01, ***P < 0.001).
Source data are available online for this figure.
Under normal conditions, ATF4 is almost undetectable due to its short half‐life and low translation efficiency. This explains why TFEB and TFE3 did not increase ATF4 levels in control conditions (Fig 5A and B). The primary mechanism of ATF4 induction includes increased translation rate and reduced proteasomal degradation. However, some stress pathways may also increase transcription of ATF4. To determine whether TFEB‐S211A induces transcriptional upregulation of ATF4, we analyzed cells exposed to starvation or ER stress by quantitative RT–PCR. We found that the ATF4 transcript levels were significantly increased in cells expressing TFEB‐S211A under stress conditions (Fig 5C). As expected, the mRNA levels of the ATF4 targets CHOP and GADD34 were also increased by TFEB‐S211A (Fig 5C). MCOLN1, a well‐characterized target of TFEB and TFE3, was used as a positive control (Fig 5C) (Medina et al, 2011; Martina et al, 2014b). Over‐expression of TFEB‐S211A also increased ATF4 mRNA levels in MEFs (Appendix Fig S1J). All together, our data suggest that TFEB increases transcriptional upregulation of ATF4 under stress conditions.
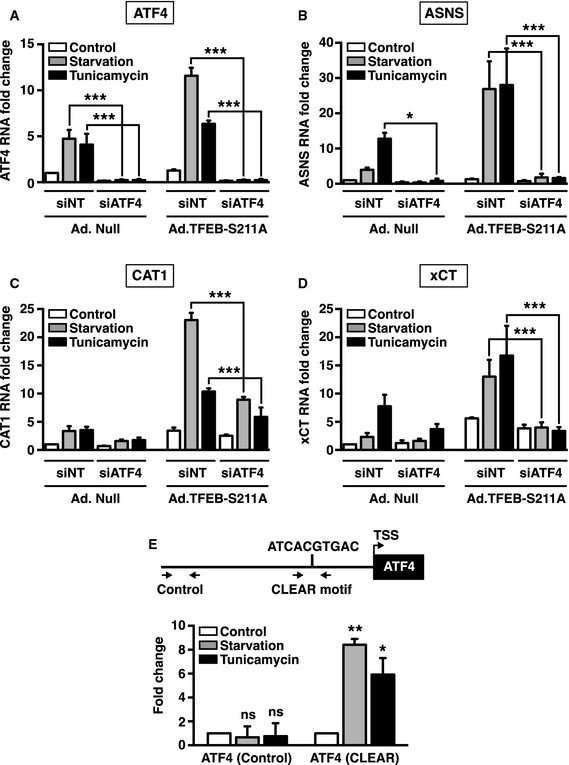
A critical contribution of ATF4 to cellular survival is to promote expression of genes implicated in amino acid import and synthesis. Therefore, we next tested the effect of TFEB‐S211A over‐expression on additional ATF4 targets. In agreement with previous reports, we found that the mRNA levels of ASNS (asparagine synthetase), CAT1 (cationic amino acid transporter 1), and xCT (sodium‐independent aspartate/glutamate/cystine transporter) increased in response to tunicamycin or starvation, and this increase was ATF4 dependent (Fig 6A–D). In addition, over‐expression of TFEB‐S211A further augmented the stress‐induced increase in ASNS, CAT1, and xCT levels (Fig 6A–D). Notably, depletion of ATF4 abolished or severely reduced the TFEB‐S211A‐mediated upregulation of these genes (Fig 6A–D). Therefore, our results suggest that by increasing transcriptional upregulation of ATF4, TFEB and TFE3 potentiate expression of key ATF4 targets under different cellular stress conditions.
Figure 6. TFEB and TFE3 enhance the integrated stress response by inducing transcriptional upregulation of ATF4.
-
A–DRelative quantitative real‐time PCR analysis of ATF4 (A), ASNS (B), CAT1 (C), and xCT (D) mRNA transcript levels in ATF4‐depleted ARPE‐19 cells infected with either adenovirus expressing Null or TFEB‐S211A upon incubation with DMSO (Control), tunicamycin (5 μg/ml), or starved in EBSS for 16 h (mean ± SD of the RNA fold change of indicated mRNAs normalized to actin mRNA from three independent experiments, one‐way ANOVA versus the corresponding treatment condition in the adenovirus‐Null‐infected and siRNA Non‐Target (siNT)‐treated cells, *P < 0.05, ***P < 0.001).
-
EChIP‐qPCR analysis of the ATF4 promoter and 2,000 bp upstream of the region of interest (ATF4 Control) from MEF cells that were untreated (Control), starved for 2 h, or treated with tunicamycin (0.1 μg/ml) for 16 h. Amplification regions are indicated by arrows. Chromatin DNA was immunoprecipitated with antibodies for TFE3. Bar graphs show the amount of immunoprecipitated DNA detected by the real‐time PCR assay. Values were normalized to the input and plotted as relative enrichment compared to untreated conditions (means ± SD of three independent experiments, Student's t‐test, *P < 0.05, **P < 0.01).
It is well established that TFEB and TFE3 recognize E‐box type DNA sequences named CLEAR motifs (GTCACGTGAC) (Aksan & Goding, 1998; Sardiello et al, 2009; Martina et al, 2014b). To confirm that ATF4 is a direct target of TFEB and TFE3, we analyzed its promoter and identified a CLEAR motif (ATCACGTGAC) located 875 bp from the transcription start site. Chromatin immunoprecipitation coupled with quantitative PCR (ChIP‐qPCR) of MEFs starved or treated with tunicamycin showed increased binding of endogenous TFE3 to this CLEAR motif when compared with untreated cells (Fig 6E). These results confirm that TFE3 directly regulates stress‐induced expression of ATF4.
TFE3 and TFEB modulate expression of several critical regulators of the cellular stress response
Next, we assessed whether TFEB and TFE3 may target additional UPR genes. For this, we performed genomewide chromatin immunoprecipitation sequencing (ChIP‐seq) in MEFs subjected to either ER stress or nutrient deprivation and promoter occupancy by TFE3 was assessed. Compared to control conditions, 1,391 genes with peaks surrounding the transcription start site of their promoter were identified in tunicamycin‐treated cells and 1,169 genes in starved cells. These peaks were mapped to the nearest transcription start sites of unique genes based on gene annotations of USCS known genes (mm9). TFE3 ChIP‐seq peaks did not accumulate when a control IgG was used. Notably, 901 TFE3 targets overlapped between the two stress conditions, indicating that close to 80% of the genes regulated by TFE3 in starvation conditions are also modulated by this transcription factor under ER stress (Fig 7A). This suggests the existence of a common transcriptional network regulated by TFE3 under different stress conditions. As expected, our ChIP‐seq analysis detected increased binding of endogenous TFE3 to the region of the ATF4 promoter containing the CLEAR motif both under ER stress or nutrient deprivation, further corroborating the direct regulation of ATF4 expression by TFE3 (Fig 7B and C).
Figure 7. TFEB and TFE3 regulate expression of critical regulators of the ER stress response.

-
AVenn diagram showing overlapping genes in analyzed data sets.
-
B, CSchematic representations of TFE3 binding region in the ATF4 promoter in MEF cells treated with tunicamycin (0.1 μg/ml) for 16 h (B) or starved in EBSS for 2 h (C). The distance upstream of the transcription start site (TSS) of a potential E‐box sequence is indicated in base pairs (bp).
-
D, EE‐box distance from transcription start site for targets categorized as lysosomal genes in MEF treated with tunicamycin (0.1 μg/ml) for 16 h (D) or starved in EBSS for 2 h (E). Peaks called as TFE3 binding sites were analyzed for E‐box elements using UCSC genome browser and distance from transcription start site was assessed. Graphs represent the number of genes with E‐box distance × (in kbp) from the transcription start site.
-
FRelative quantitative real‐time PCR analysis of SUMF1, DERL1, ATF6, APEX1, and GPX1 mRNA transcript levels in ARPE‐19 cells infected with either adenovirus expressing Null or TFEB‐S211A (mean ± SD of the RNA fold change of indicated mRNAs normalized to actin mRNA from three independent experiments, Student's t‐test, **P < 0.01, ***P < 0.001).
-
GImmunoblots of protein lysates from ARPE‐19 cells infected with either adenovirus expressing Null or TFEB‐S211A. Data are representative of three independent experiments.
-
HQuantification of IRE1α and APEX1 protein levels in ARPE‐19 cells infected as indicated in (G) (mean ± SD of the fold increase of the indicated protein to actin ratio from three independent experiments, Student's t‐test, ***P < 0.001).
Source data are available online for this figure.
To identify the common pathways controlled by TFE3 under stress, we performed gene ontology (GO) analysis of the TFE3 targets looking for over‐represented classes of genes. The analysis of “cellular compartment” terms showed that, as expected, the enrichment for classes linked to lysosomes was the most significant one (Appendix Fig S2A and Appendix Table S1). However, components associated with endosomes, melanosomes, mitochondria, Golgi apparatus, and ER were also over‐represented (Appendix Fig S2A and Appendix Table S1). When we further analyzed the lysosomal category under starvation or ER stress conditions, we found that TFE3 mainly bound to CLEAR elements located at the proximal promoter regions of these target genes, with 80% of the binding regions located within 1 Kb of the transcription initiation site (Fig 7D and E, Appendix Table S2). These data confirm that TFE3 regulates expression of lysosomal genes not only under starvation, but also ER stress conditions.
Consistent with these data, the analysis of “biological function” terms showed a very significant enrichment in genes implicated in vacuole organization and proton transport (Appendix Fig S2B and Appendix Table S3). Also expected was the enrichment in genes implicated in and autophagy and cell cycle (Zanocco‐Marani et al, 2006; Barroca et al, 2009; Betschinger et al, 2013). Furthermore, a significant number of genes involved in stress response were also identified among TFE3 targets. These include those implicated in cellular response to stress (34 genes), response to DNA damage (28 genes), regulation of apoptosis (31 genes), genome stability (54 genes), and signaling (63 genes) (Appendix Fig S2B and Appendix Table S3). Motif analysis of the TFE3 binding sites revealed the presence of one or more E‐boxes or CLEAR elements in almost all the genes implicated in the regulation of cellular response to stress, apoptosis, and ER homeostasis (Appendix Tables S4, S5 and S6).
In agreement with our ChIP‐seq results, we found that over‐expression of TFEB‐S211A induced upregulation of several critical modulators of the cell stress and ER homeostasis response, including SUMF1 (sulfatase modifying factor 1), DERL1 (Der1‐like domain family member 1), ATF6b (activating transcription factor 6b), APEX1 (apurinic endonuclease 1), GPX1 (glutathione peroxidase), and IRE1alpha (endoplasmic reticulum to nucleus signaling) (Fig 7F–H).
All together, our results indicate that TFEB and TFE3 may modulate multiple pathways and have a more general contribution to the cellular stress response than previously anticipated.
Depletion of TFEB and TFE3 attenuates ER stress response and render cells less susceptible to apoptosis
To further address the physiological significance of TFEB/TFE3 activation under ER stress conditions, we used the CRISPR/Cas9 approach to generate MEF stable clones depleted of both transcription factors (Fig 8A). In agreement with our results showing that TFEB and TFE3 promote transcriptional upregulation of ATF4, we found that ATF4 protein levels were reduced in TFEB/TFE3‐null cells (Fig 8A and B). This reduction was especially significant after prolonged periods of ER stress that is consistent with the times at which we observe a more robust accumulation of TFE3 and TFEB in the nucleus (Fig 8B). We did not observe noticeable differences in the levels of PERK activation between control and TFEB/TFE3‐KO cells, thus ruling out the possibility that the TFEB/TFE3‐KO might be experiencing less ER stress (Appendix Fig S3A).
Figure 8. ER stress response and susceptibility to apoptosis are regulated by TFEB and TFE3.

-
AImmunoblots of protein lysates from Null‐ or TFEB/3 knockout‐MEF cells incubated in the presence of DMSO (Control) or tunicamycin (Tun.) (0.1 μg/ml) for the indicated times. Data are representative of three independent experiments.
-
BQuantification of ATF4 protein levels in Null‐ or TFEB/3 knockout‐MEF cells treated as indicated in (A) (mean ± SD of the ATF4 to actin protein ratio from three independent experiments, Student's t‐test versus the corresponding time point in Null‐MEF cells, ns = not significant, **P < 0.01).
-
CCell viability was determined in Null‐ or TFEB/3 knockout‐MEF cells incubated in the presence of DMSO (Control) or tunicamycin (Tun.) (0.1 μg/ml) for the indicated times (mean ± SD of the percentage of viable cells compared to control from three independent experiments, one‐way ANOVA versus the corresponding time point in Null‐MEF cells, ***P < 0.001).
-
DChromatin condensation, an indication of cells undergoing apoptosis, was assessed in Null‐ or TFEB/3 knockout‐MEF cells incubated in the presence of DMSO (Control) or tunicamycin (0.1 μg/ml) for the indicated times. Confocal microscopy images were obtained from fixed cells stained with Hoechst 33342. Scale bar, 20 μm. Data are representative of three independent experiments.
-
EImmunoblots of protein lysates from Null‐ or TFEB/3 knockout‐MEF cells treated as described in (A). Data are representative of three independent experiments.
-
F–HQuantification of CHOP (F), PUMA (G), and NOXA (H) protein levels in Null‐ or TFEB/3 knockout‐MEF cells treated as indicated in (E) (mean ± SD of the indicated protein to actin ratio from three independent experiments, Student's t‐test analysis versus the corresponding time point in Null‐MEF cells, ns = not significant, *P < 0.05, **P < 0.01).
-
IImmunoblots of protein lysates from ARPE‐19 cells infected with either adenovirus expressing Null, TFEB‐S211A, or TFE3. Data are representative of three independent experiments.
-
JQuantification of PUMA protein levels in ARPE‐19 cells infected as indicated in (I) (mean ± SD of the fold change of the indicated protein to actin ratio from three independent experiments, one‐way ANOVA versus the adenovirus‐Null‐infected cells, *P < 0.05, ***P < 0.001).
Source data are available online for this figure.
It is well established that when cells fail to reach homeostasis and undergo continued stress, the UPR program can lead to apoptosis. Therefore, we monitored cell viability under prolonged ER stress conditions by measuring ATP bioluminescence after treatment with tunicamycin for 16 and 24 h. Notably, cells lacking TFEB and TFE3 showed a significantly lower susceptibility to ER stress‐induced cell death (Fig 8C). After 16 h of tunicamycin treatment, 80% of control cells remained viable, whereas no cell death was observed in TFEB/TFE3‐KO MEFs. This trend was more pronounced at 24 h, when only 15% of the control cells versus 56% of the KO cells survived. The reduced cell death in cells lacking TFEB and TFE3 was confirmed by Hoechst staining. As seen in Fig 8D, the appearance of condensed and fragmented nuclei was decreased in TFEB/TFE3‐KO cells compared to control cells. Apoptosis was also measured using a combination of Annexin V‐Pacific Blue and 7‐AAD staining that allows calculation of the percentage of healthy, early apoptotic, and late apoptotic/dead cells. Our results confirmed that the number of late apoptotic/dead cells was significantly reduced in TFEB/TFE3‐KO cells (Appendix Fig S3B). Furthermore, we also observed reduced ATF4 induction and cell death in TFEB/TFE3‐KO MEFs in response to starvation (Appendix Fig S3C and D). This suggests that TFEB and TFE3 may promote apoptosis under different stress conditions.
ER malfunction promotes apoptosis by the transcriptional induction of pro‐apoptotic factors such as CHOP, NOXA, and PUMA, which are direct targets of ATF4 and CHOP, respectively (Wang et al, 2009; Galehdar et al, 2010). Consistent with the decreased levels of apoptosis observed in TFEB/TFE3‐KO MEFs, we found reduced tunicamycin‐mediated induction of CHOP, PUMA, and NOXA in these cells (Fig 8E–H). Interestingly, CHOP and PUMA were identified as putative TFE3 targets in our ChIP‐seq analysis and both genes contain E‐boxes in their promoter regions (Appendix Fig S3E). Moreover, over‐expression of TFEB‐S211A or TFE3 induced a significant upregulation of PUMA even under non‐stress conditions (Fig 8I and J). Therefore, TFEB and TFE3 might regulate levels of CHOP and PUMA either by inducing ATF4 expression or by direct binding to their promoters. Consistent with this idea, we found that prolonged expression (40 h) of either TFEB‐S211A or TFE3‐S321A in MEFs was sufficient to cause a significant reduction in cell viability (Appendix Fig S3F).
All together our results suggest that TFEB and TFE3 contribute to cell death under conditions of prolonged ER or starvation stress.
Discussion
The present study identifies a novel role for TFEB and TFE3 in cellular response to ER stress. After prolonged treatment with ER stress inducers, TFEB and TFE3 translocate to the nucleus where they upregulate expression of ATF4 and other critical regulators of the cellular stress response (Appendix Fig S4).
The participation of TFEB and TFE3 in cellular adaptation to starvation is well established. In conditions in which nutrients are scarce, TFEB and TFE3 activate the coordinated lysosomal expression and regulation (CLEAR) response leading to autophagy induction, increased lysosomal activity, and expression of critical metabolic regulators. Interestingly, our current work suggests that TFEB and TFE3 may respond to other types of cellular stress besides starvation. However, some important differences are observed in the activation of TFEB and TFE3 in response to either starvation or ER stress. For example, nutrient deprivation causes a rapid inactivation of mTORC1, thus preventing phosphorylation of TFE3 in Ser321 (or TFEB‐S211) and inhibiting 14‐3‐3‐mediated retention of TFE3 in the cytosol. In contrast, the activity of mTORC1 was not significantly reduced by ER stress under our experimental conditions, suggesting that this is an mTORC1‐independent process. Still, phosphorylation of TFE3 at S321 was dramatically reduced by ER stress. A possible explanation is that ER stress leads to the activation of specific TFE3 phosphatases. In agreement with this idea, we found that depletion or inhibition of calcineurin significantly diminished TFE3 activation in response to tunicamycin. However, since TFE3 translocation to the nucleus was not completely blocked, it is possible that additional factors contribute to TFE3 activation in response to ER stress. We also observed different times of response under different stress conditions. Translocation of TFEB and TFE3 to the nucleus following starvation is very fast (< 30 min) which is in agreement with the rapid mTORC1 inactivation achieved under these conditions. However, activation of TFEB and TFE3 was only observed after prolonged periods of ER stress (> 12 h). Finally, activation of TFE3 in response to ER stress, but not starvation, was inhibited in PERK‐KO MEFs, further confirming the presence of different mechanisms of TFE3 activation in response to diverse stressors. Furthermore, the requirement of PERK implies that TFE3 activation might be considered a novel UPR component.
The question that remains is how TFEB and TFE3 contribute to UPR? We found that TFE3 directly binds to a CLEAR element present in the promoter region of the transcription factor ATF4. ATF4 is a critical regulator of the integrated stress response (ISR). Under ER stress conditions, PERK‐mediated upregulation of ATF4 leads to the expression of a myriad of genes aimed at restoring cellular homeostasis. This includes genes implicated in autophagy activation, redox homeostasis, and amino acid import and synthesis.
Although ATF4 activity is critical for the initial pro‐survival activity of UPR, prolonged ER stress leads to stress‐induced apoptosis. The underlying mechanisms by which the PERK/ATF4 pathway can signal cell death are not well understood. It is suggested that chronic stress leads to ATF4‐dependent expression of pro‐apoptotic factors such as CHOP, PUMA, and NOXA. Notably, we found that ATF4 levels were significantly lower in TFEB/TFE3‐KO MEFs following prolonged ER stress. Accordingly, the protein levels of the pro‐apoptotic factors CHOP, PUMA, and NOXA were also reduced and TFEB/TFE3‐KO MEFs were more resistant to apoptosis. Therefore, TFEB and TFE3 may facilitate apoptosis under prolonged conditions of ER stress by promoting sustained ATF4 activation.
Our study shows that TFEB and TFE3 also upregulate ATF4 in nutrient‐depleted cells, thus unveiling ATF4 as novel component of the transcriptional network regulated by TFEB/TFE3 following starvation. It is well established that activation of the GCN2 kinase by amino acid depletion results in ATF4 upregulation. Interestingly, we found that GCN2 is required for efficient TFE3 activation in response to starvation, further evidencing cross talk between different nutrient sensing pathways.
Our ChIP‐Seq analysis revealed that regardless of ER stress or starvation, TFE3 regulates a common set of genes, many of which are implicated in response to stress. Those include not only lysosomal and autophagy genes, but also regulators of apoptosis, chromatin organization, signaling, and ER homeostasis. These results suggest that TFEB and TFE3 may have a more global effect on cellular response to stress than previously anticipated.
Therefore, we suggest that TFEB and TFE3 may play a dual role in determining cellular fate. Under certain cellular conditions, such as early stages of ER stress or starvation, TFEB and TFE3 may promote cell survival by enhancing expression of pro‐survival genes (ATF4, genes implicated in autophagy, lysosomal biogenesis, ER homeostasis, metabolic regulators). Conversely, under prolonged stress conditions, activation of TFEB and TFE3 may increase expression of pro‐apoptotic factors (ATF4, CHOP, PUMA, NOXA) thus leading to cell death. In accordance, several apoptotic TFE3 targets, such as PUMA, CHOP, and BAX, are also known to be important autophagy modulators, whereas some autophagic TFE3 targets, including ATG3, UVRAG, and p62, have roles in apoptosis (Mukhopadhyay et al, 2014).
In addition to TFEB, TFE3, and ATF4, many other transcription factors are known to have a dual role in survival/cell death. Those include p53 and several members of the FOXO family (Budanov, 2014; Wang et al, 2014). In all cases, whether cellular stress triggers cell death or cell survival programs is determined by a set of different factors, among them the initial stress stimulus, cell type, and environmental factors. Given the extraordinary potential of TFEB and TFE3 as therapeutic targets for treatment of lysosomal and neurological disorders (Medina et al, 2011; Martina et al, 2014a,b), as well as their implication in different types of cancer (Argani, 2015; Perera et al, 2015), the identification of a novel role for these transcription factors in apoptosis regulation is of great importance.
In summary, our work indicates that TFEB and TFE3 have a more general role in cellular adaptation to stress than previously recognized. Their ability to respond to changes in the activity of either mTORC1 or PERK makes them ideal modulators of the cross talk between lysosomes and ER. Therefore, we propose that TFEB and TFE3 are novel master regulators of the integrated stress response.
Materials and Methods
Cell line cultures and treatments
ARPE‐19 cells (CRL‐2302, American Type Culture Collection) were grown at 37°C in a 1:1 mixture of DMEM and Ham's F12 media supplemented with 10% fetal bovine serum (Invitrogen), 2 mM Glutamax™, 100 U/ml penicillin, and 100 μg/ml streptomycin (Gibco) in a humidified 5% CO2 atmosphere. Mouse embryonic fibroblasts (MEF), wild‐type (CRL‐2977, American Type Culture Collection), GCN2‐KO (CRL‐2978, American Type Culture Collection), and PERK‐KO (CRL‐2976, American Type Culture Collection), were grown in DMEM supplemented with fetal bovine serum, Glutamax™, and antibiotics as indicated for ARPE‐19 cells media. For infection experiments, cells were infected with adenoviruses according to the manufacturer's recommendations. Analyses were performed 40–48 h post‐infection. For drug treatment experiments, cells were incubated the indicated period of time at 37°C in medium containing one of the following reagents: DMSO (Sigma‐Aldrich), 250 nM Torin‐1 (TOCRIS), 1 μM FK‐506, 1.25 μM thapsigargin, or 0.1–5 μg/ml tunicamycin (Cell Signaling Technology). For starvation experiments, cells were washed three times in Hank's balanced salt solution (Invitrogen) and incubated for 2–16 h at 37°C in Earle's balanced salt solution (Starvation media) (Sigma‐Aldrich).
Virus‐mediated gene expression
Adenovirus expressing Null, TFEB‐S211A‐FLAG and TFE3‐WT‐MYC, and TFE3‐S321A‐MYC were prepared, amplified and purified by Welgen, Inc. Adenovirus expressing Null and TFEB‐S211A‐FLAG have been previously described (Martina et al, 2012, 2014b).
For knockout of TFEB and TFE3, CRISPR‐Cas9 guide RNA targeting sequences for mouse TFEB and TFE3 were identified bioinformatically using the CRISPR Design Tool available at genomeengineering.org (Hsu et al, 2013). The targeting sequence search was limited to the first constitutively expressed exon common to all isoforms of the genes. Targeting sequences used were CACGTACTGTCCACCTCGGC for TFEB and GAGGCGTGAGCGGCGGGAAC for TFE3. Targeting sequences were cloned in to the lentiCRISPR plasmid (http://www.addgene.org/49535/) described in (Shalem et al, 2014). Lentivirus was produced for the TFEB and TFE3 targeting sequences as well as an empty lentiCRISPR vector for control lines. Lentiviral transfer plasmids were co‐transfected with VSV‐G envelope (https://www.addgene.org/12259/) and packaging plasmids (https://www.addgene.org/12260/) into HEK293T cells using Lipofectamine LTX (Life Technologies). Media was changed after 24 h and centrifuged and collected 72 h post‐transfection.
Wild‐type MEF cells at ~30% confluency were transduced with hexadimethrine bromide (Sigma‐Aldrich) and viruses containing control or TFEB and TFE3 targeting sequences. Media was removed after 24 h and cells selected with 5 μg/ml puromycin (Sigma‐Aldrich). Individual clones were isolated by limiting dilution cloning, and TFEB/3 knockout was confirmed via immunoblotting.
Immunofluorescence confocal microscopy
Cells grown on glass coverslips were washed with PBS and fixed with 4% formaldehyde at room temperature for 15 min. After fixation, cells were washed with PBS and then permeabilized with 0.2% Triton X‐100 in PBS at room temperature for 10 min. Cells were then incubated with the indicated primary antibodies in IF buffer (PBS containing 10% fetal bovine serum and 0.1% (w/v) saponin) for 1 h at room temperature. Cells were washed three times with PBS and incubated with the corresponding secondary antibodies conjugated to Alexa Fluor 568‐conjugated goat anti‐mouse IgG or Alexa Fluor 488‐conjugated goat anti‐rabbit IgG (1:1,000; Life Technologies) in IF buffer for 30 min at room temperature. For chromatin condensation analysis, fixed cells were incubated with 1 mM Hoechst 33342 (Life Technologies, 62249) in PBS for 10 min at room temperature. PBS washed coverslips were mounted onto glass slides with Fluoromount‐G (Southern Biotech).
Co‐localization of confocal images was quantitated using ImageJ with the JACoP plugin (Bolte & Cordelieres, 2006). Pearson's coefficients were calculated between red and green channels with images from five randomly chosen fields of view from a 63× objective. Minimums of 50 cells were analyzed for each time point during each trial.
Images were acquired on a Zeiss LSM 510 confocal system equipped with filter sets for FITC and rhodamine, 488 and 543 nm laser excitation, an AxioCam camera, a 63X NA 1.4 or 40X NA 1.3 oil immersion objectives, and LSM 510 operating software (Carl Zeiss). Confocal images taken with the same acquisition parameters were processed with ImageJ software (NIH), and Photoshop CS4 was used to produce the figures. Antibodies are listed in Appendix Table S7.
Immunoprecipitation, GST pull‐down, electrophoresis, and immunoblotting
Cells washed with ice‐cold PBS were lysed in lysis buffer containing 25 mM Hepes‐KOH, pH 7.4, 150 mM NaCl, 5 mM EDTA, and 1% Triton X‐100 (w/v) and supplemented with protease and phosphatase inhibitors cocktail (Roche). Cell lysates were incubated on ice for 30 min and then were passed 10 times through a 25‐gauge needle. Cell lysates were centrifuged at 16,000 × g for 10 min at 4°C. For immunoprecipitation, the soluble fractions were incubated with 1 μg of anti‐TFE3 antibody and protein G‐Sepharose beads (GE Healthcare) for 4 h at 4°C. The immunoprecipitates were collected, washed three times with lysis buffer, and proteins were eluted with Laemmli sample buffer.
For GST pull‐down experiments, MEF cells incubated with DMSO or tunicamycin (0.1 μg/ml) for 16 h were lysed and processed as described under “Subcellular fractionation” and the cytosol and nuclear fractions were incubated with 1 μg of GST‐14‐3‐3 gamma fusion protein (kindly provided by Dr. Heissler, NHLBI, NIH) immobilized on glutathione beads for 2 h at 4°C. Beads were washed 3 times with Triton X‐100‐containing lysis buffer, and bound proteins were eluted with Laemmli sample buffer.
Samples were analyzed by SDS–PAGE (4–20% gradient gels, Life Technologies) under reducing conditions and transferred to nitrocellulose. Membranes were immunoblotted using the indicated antibodies. Horseradish peroxidase‐conjugated anti‐mouse, anti‐rabbit IgG, or anti‐rat IgG (Cell Signaling Technology) were used at a dilution of 1:8,000. HRP‐chemiluminescence was developed using Western Lightning Chemiluminescence Reagent Plus (PerkinElmer Life Sciences). The exposed films were scanned and the protein band intensities quantified using ImageJ software (NIH), and Photoshop CS4 software was used to produce the figures. Antibodies are listed in Appendix Table S7.
Production of anti‐phospho‐TFE3 (Ser321) antibody
For antibody production, the synthesis and purification of a phospho‐specific TFE3 peptide (AITVSN‐pS‐CPAELPN; amino acids 315–328) and a non‐phosphorylated peptide counterpart (AITVSNSCPAELPN) as well as the production of polyclonal antisera was performed by YenZym Antibodies (South San Francisco, CA). Two New Zealand white rabbits were immunized with the phosphopeptide following a 90 days immunization protocol. The antisera were further purified by affinity chromatography against the same phosphopeptide used for immunization. The purified antibody was then affinity‐absorbed against the non‐phosphorylated peptide counterpart, to separate the phosphopeptide‐specific antibody from the cross‐reactive population. The specificity of anti‐phospho‐TFE3 antibody was examined by immunoblotting.
Cell viability assay
Ten thousand MEF‐Null or MEF‐TFEB/3 KO cells were seeded in triplicates in 100 μl of culture medium per well of 96‐well opaque‐walled plates. The following day, the culture medium was exchanged with medium containing either DMSO or 0.1 μg/ml tunicamycin and cells were incubated for 16 and 24 h at 37°C. Cell viability was then assessed using CellTiter‐Glo Luminescence Cell Viability Assay (Promega) following manufacturer's recommendations. Treated cells were briefly equilibrated at room temperature for 30 min. Then, 100 μl of CellTiter‐Glo reagent was added to each well and cells were mix for 2 min on an orbital shaker to induce cell lysis. Plates were then incubated at room temperature for 10 min to stabilize luminescent signal. Luminescence was recorded using a GloMax 96 Microplate Luminometer (Promega) preloaded with CellTiter‐Glo protocol. An integration time of 1 sec per well was used. Control wells containing medium without cells were measured to obtain a value for background luminescence. The mean of triplicate values for each time point was compared to untreated wells after the subtraction of background luminescence, and the percentage of viable cells were calculated.
Chromatin immunoprecipitation
For ChIP‐seq, MEF cells that were cultured for 24 h were either incubated for 16 h with 0.1 μg/ml tunicamycin or 2 h in Earle's balanced salt solution (Starvation media) (Sigma‐Aldrich) and subsequently crosslinked in 1% formaldehyde and processed according the Myer's laboratory ChIP‐seq protocol. Cells were lysed with Buffer 1 (5 mM PIPES pH 8.0, 85 mM KCl, 0.5% NP‐40, protease inhibitors) and pelleted. Pellets were resuspended in Buffer 1 and homogenized on ice and pelleted. Pellet was resuspended in Buffer 2 (1× PBS, 1% NP‐40, 0.5% sodium deoxycholate, 0.1% SDS, protease inhibitors). The chromatin fraction was sheared by sonication (15 × 30 s) in 1.5‐ml siliconized Eppendorf tubes. A 10‐μg aliquot of DNA was reverse crosslinked to assess chromatin size (100–600 bp). Five hundred micrograms of the resulting sheared chromatin samples was cleared overnight at 4°C using Invitrogen DynaIbeads. Also, TFE3 (5 μg/sample) and non‐specific rabbit IgG antibody (for background control) were incubated with magnetic beads overnight and washed with Buffer 3 (100 mM Tris pH 7.5, 50 mM LiCl, 1% NP‐40, 1% sodium deoxycholate). Precleared chromatin samples were added to washed beads and incubated at 4°C overnight. Beads were washed with Buffer 3 and then eluted and reverse crosslinked with Buffer 4 (1% SDS, 0.1 M NaHCO3) at 65°C overnight. ChIP‐seq data and sample annotations were deposited in GEO under accession number GSE75757.
ChIP‐qPCR (chromatin immunoprecipitation quantitative PCR)
Chromatin immunoprecipitation (ChIP) analysis was performed as described by the SimpleChIP Enzymatic Chromatin IP Kit (magnetic beads) from Cell Signaling Technology. The chromatin was immunoprecipitated with normal immunoglobulin G (IgG; negative control; Cell Signaling no. 2729), anti‐histone H3 (positive control; Cell Signaling no. 4620), and anti‐TFE3 (Sigma‐Aldrich) antibodies. Two percent of the supernatant fraction from the chromatin lacking primary antibody was used as the “input sample”. Quantitative real‐time PCR was performed using QuantStudio 12K Flex Real‐Time PCR system (Applied Biosystems, Life Technologies) in triplicate with specific primers amplifying the E‐box element in the promoter region of ATF4 and 2,000‐bp upstream of the ATF4 promoter. Primers used:
5′‐GACGATCTCTAACGCCACAGTTAC, ATF4 sense
5′‐CCTAAACCCGCCCTTTATAGCC, ATF4 antisense
5′‐AAAGCTCAAGCCAAGGTAAATGAG, ATF4‐UP sense
5′‐ATCACTCCACCTGCAGTTAAACAT, ATF4‐UP antisense
The thermal profile of the reaction was: 95°C for 3 min and 40 cycles of 95°C for 15 s followed by 60°C for 1 min.
Statistical analysis
Obtained data were processed in Excel (Microsoft Corporation) and Prism (GraphPad Software) to generate bar charts and perform statistical analyses. Student's t‐test or one‐way ANOVA and pairwise post‐tests were run for each dependent variable, as specified in each figure legend. All data are presented as mean ± SD. P ≤ 0.05 was considered statistically significant (*) and P ≤ 0.001 extremely significant (***). P > 0.05 was considered not significant (ns).
For more Materials and Methods, see the Appendix.
Author contributions
JAM was involved in experimental strategy, performed most of the experiments, and analyzed the data; HID performed the ChIP‐seq and ChIP‐qPCR experiments and analyzed the data; OAB generated the TFEB/TFE3 knockout MEFs; RP designed the research, analyzed the data, supervised the project, and wrote the manuscript. All the authors reviewed the manuscript.
Conflict of interest
The authors declare that they have no conflict of interest.
Supporting information
Appendix
Review Process File
Source Data for Figure 1
Source Data for Figure 2
Source Data for Figure 3
Source Data for Figure 5
Source Data for Figure 7
Source Data for Figure 8
Acknowledgements
This work was supported by the Intramural Research Program of the National Institutes of Health, National Heart, Lung, and Blood Institute (NHLBI). We thank Dr. Philip McCoy and Dr. Pradeep Dagur (Flow Cytometry Core, NHLBI) for their assistance in the Annexin V apoptosis analysis. We also thank Dr. Gustavo Gutierrez and Dr. Hossein Zare (NIAMS) for their assistance in the analysis of the ChIP‐seq data and Dr. Douglas Forrest (NIDDK) for assistance with the GloMax 96 Microplate Luminometer.
The EMBO Journal (2016) 35: 479–495
References
- Aksan I, Goding CR (1998) Targeting the microphthalmia basic helix‐loop‐helix‐leucine zipper transcription factor to a subset of E‐box elements in vitro and in vivo . Mol Cell Biol 18: 6930–6938 [DOI] [PMC free article] [PubMed] [Google Scholar]
- Ameri K, Harris AL (2008) Activating transcription factor 4. Int J Biochem Cell Biol 40: 14–21 [DOI] [PubMed] [Google Scholar]
- Anthony TG, McDaniel BJ, Byerley RL, McGrath BC, Cavener DR, McNurlan MA, Wek RC (2004) Preservation of liver protein synthesis during dietary leucine deprivation occurs at the expense of skeletal muscle mass in mice deleted for eIF2 kinase GCN2. J Biol Chem 279: 36553–36561 [DOI] [PubMed] [Google Scholar]
- Argani P (2015) MiT family translocation renal cell carcinoma. Semin Diagn Pathol 32: 103–113 [DOI] [PubMed] [Google Scholar]
- Baird TD, Wek RC (2012) Eukaryotic initiation factor 2 phosphorylation and translational control in metabolism. Adv Nutr 3: 307–321 [DOI] [PMC free article] [PubMed] [Google Scholar]
- Bar‐Peled L, Schweitzer LD, Zoncu R, Sabatini DM (2012) Ragulator is a GEF for the rag GTPases that signal amino acid levels to mTORC1. Cell 150: 1196–1208 [DOI] [PMC free article] [PubMed] [Google Scholar]
- Barroca H, Castedo S, Vieira J, Teixeira M, Muller‐Hocker J (2009) Altered expression of key cell cycle regulators in renal cell carcinoma associated with Xp11.2 translocation. Pathol Res Pract 205: 466–472 [DOI] [PubMed] [Google Scholar]
- Betschinger J, Nichols J, Dietmann S, Corrin PD, Paddison PJ, Smith A (2013) Exit from pluripotency is gated by intracellular redistribution of the bHLH transcription factor Tfe3. Cell 153: 335–347 [DOI] [PMC free article] [PubMed] [Google Scholar]
- Bollo M, Paredes RM, Holstein D, Zheleznova N, Camacho P, Lechleiter JD (2010) Calcineurin interacts with PERK and dephosphorylates calnexin to relieve ER stress in mammals and frogs. PLoS ONE 5: e11925 [DOI] [PMC free article] [PubMed] [Google Scholar]
- Bolte S, Cordelieres FP (2006) A guided tour into subcellular colocalization analysis in light microscopy. J Microsc 224: 213–232 [DOI] [PubMed] [Google Scholar]
- Budanov AV (2014) The role of tumor suppressor p53 in the antioxidant defense and metabolism. Subcell Biochem 85: 337–358 [DOI] [PMC free article] [PubMed] [Google Scholar]
- Chaveroux C, Lambert‐Langlais S, Cherasse Y, Averous J, Parry L, Carraro V, Jousse C, Maurin AC, Bruhat A, Fafournoux P (2010) Molecular mechanisms involved in the adaptation to amino acid limitation in mammals. Biochimie 92: 736–745 [DOI] [PubMed] [Google Scholar]
- Fric J, Zelante T, Wong AY, Mertes A, Yu HB, Ricciardi‐Castagnoli P (2012) NFAT control of innate immunity. Blood 120: 1380–1389 [DOI] [PubMed] [Google Scholar]
- Galehdar Z, Swan P, Fuerth B, Callaghan SM, Park DS, Cregan SP (2010) Neuronal apoptosis induced by endoplasmic reticulum stress is regulated by ATF4‐CHOP‐mediated induction of the Bcl‐2 homology 3‐only member PUMA. J Neurosci 30: 16938–16948 [DOI] [PMC free article] [PubMed] [Google Scholar]
- Harding HP, Novoa I, Zhang Y, Zeng H, Wek R, Schapira M, Ron D (2000) Regulated translation initiation controls stress‐induced gene expression in mammalian cells. Mol Cell 6: 1099–1108 [DOI] [PubMed] [Google Scholar]
- Harding HP, Zhang Y, Zeng H, Novoa I, Lu PD, Calfon M, Sadri N, Yun C, Popko B, Paules R, Stojdl DF, Bell JC, Hettmann T, Leiden JM, Ron D (2003) An integrated stress response regulates amino acid metabolism and resistance to oxidative stress. Mol Cell 11: 619–633 [DOI] [PubMed] [Google Scholar]
- Hetz C (2012) The unfolded protein response: controlling cell fate decisions under ER stress and beyond. Nat Rev Mol Cell Biol 13: 89–102 [DOI] [PubMed] [Google Scholar]
- Hinnebusch AG (2005) Translational regulation of GCN4 and the general amino acid control of yeast. Annu Rev Microbiol 59: 407–450 [DOI] [PubMed] [Google Scholar]
- Hsu PD, Scott DA, Weinstein JA, Ran FA, Konermann S, Agarwala V, Li Y, Fine EJ, Wu X, Shalem O, Cradick TJ, Marraffini LA, Bao G, Zhang F (2013) DNA targeting specificity of RNA‐guided Cas9 nucleases. Nat Biotechnol 31: 827–832 [DOI] [PMC free article] [PubMed] [Google Scholar]
- Liu Z, Cai H, Zhu H, Toque H, Zhao N, Qiu C, Guan G, Dang Y, Wang J (2014) Protein kinase RNA‐like endoplasmic reticulum kinase (PERK)/calcineurin signaling is a novel pathway regulating intracellular calcium accumulation which might be involved in ventricular arrhythmias in diabetic cardiomyopathy. Cell Signal 26: 2591–2600 [DOI] [PubMed] [Google Scholar]
- Martina JA, Chen Y, Gucek M, Puertollano R (2012) MTORC1 functions as a transcriptional regulator of autophagy by preventing nuclear transport of TFEB. Autophagy 8: 903–914 [DOI] [PMC free article] [PubMed] [Google Scholar]
- Martina JA, Puertollano R (2013) Rag GTPases mediate amino acid‐dependent recruitment of TFEB and MITF to lysosomes. J Cell Biol 200: 475–491 [DOI] [PMC free article] [PubMed] [Google Scholar]
- Martina JA, Diab HI, Li H, Puertollano R (2014a) Novel roles for the MiTF/TFE family of transcription factors in organelle biogenesis, nutrient sensing, and energy homeostasis. Cell Mol Life Sci 71: 2483–2497 [DOI] [PMC free article] [PubMed] [Google Scholar]
- Martina JA, Diab HI, Lishu L, Jeong AL, Patange S, Raben N, Puertollano R (2014b) The nutrient‐responsive transcription factor TFE3 promotes autophagy, lysosomal biogenesis, and clearance of cellular debris. Sci Signal 7: ra9 [DOI] [PMC free article] [PubMed] [Google Scholar]
- Medina DL, Fraldi A, Bouche V, Annunziata F, Mansueto G, Spampanato C, Puri C, Pignata A, Martina JA, Sardiello M, Palmieri M, Polishchuk R, Puertollano R, Ballabio A (2011) Transcriptional activation of lysosomal exocytosis promotes cellular clearance. Dev Cell 21: 421–430 [DOI] [PMC free article] [PubMed] [Google Scholar]
- Medina DL, Di Paola S, Peluso I, Armani A, De Stefani D, Venditti R, Montefusco S, Scotto‐Rosato A, Prezioso C, Forrester A, Settembre C, Wang W, Gao Q, Xu H, Sandri M, Rizzuto R, De Matteis MA, Ballabio A (2015) Lysosomal calcium signalling regulates autophagy through calcineurin and TFEB. Nat Cell Biol 17: 288–299 [DOI] [PMC free article] [PubMed] [Google Scholar]
- Mukhopadhyay S, Panda PK, Sinha N, Das DN, Bhutia SK (2014) Autophagy and apoptosis: where do they meet? Apoptosis 19: 555–566 [DOI] [PubMed] [Google Scholar]
- Perera RM, Stoykova S, Nicolay BN, Ross KN, Fitamant J, Boukhali M, Lengrand J, Deshpande V, Selig MK, Ferrone CR, Settleman J, Stephanopoulos G, Dyson NJ, Zoncu R, Ramaswamy S, Haas W, Bardeesy N (2015) Transcriptional control of autophagy‐lysosome function drives pancreatic cancer metabolism. Nature 524: 361–365 [DOI] [PMC free article] [PubMed] [Google Scholar]
- Prasad AM, Inesi G (2009) Effects of thapsigargin and phenylephrine on calcineurin and protein kinase C signaling functions in cardiac myocytes. Am J Physiol Cell Physiol 296: C992–C1002 [DOI] [PMC free article] [PubMed] [Google Scholar]
- Roczniak‐Ferguson A, Petit CS, Froehlich F, Qian S, Ky J, Angarola B, Walther TC, Ferguson SM (2012) The transcription factor TFEB links mTORC1 signaling to transcriptional control of lysosome homeostasis. Sci Signal 5: ra42 [DOI] [PMC free article] [PubMed] [Google Scholar]
- Sancak Y, Peterson TR, Shaul YD, Lindquist RA, Thoreen CC, Bar‐Peled L, Sabatini DM (2008) The Rag GTPases bind raptor and mediate amino acid signaling to mTORC1. Science 320: 1496–1501 [DOI] [PMC free article] [PubMed] [Google Scholar]
- Sancak Y, Bar‐Peled L, Zoncu R, Markhard AL, Nada S, Sabatini DM (2010) Ragulator‐Rag complex targets mTORC1 to the lysosomal surface and is necessary for its activation by amino acids. Cell 141: 290–303 [DOI] [PMC free article] [PubMed] [Google Scholar]
- Sardiello M, Palmieri M, di Ronza A, Medina DL, Valenza M, Gennarino VA, Di Malta C, Donaudy F, Embrione V, Polishchuk RS, Banfi S, Parenti G, Cattaneo E, Ballabio A (2009) A gene network regulating lysosomal biogenesis and function. Science 325: 473–477 [DOI] [PubMed] [Google Scholar]
- Schroder M, Kaufman RJ (2005) The mammalian unfolded protein response. Annu Rev Biochem 74: 739–789 [DOI] [PubMed] [Google Scholar]
- Settembre C, Di Malta C, Polito VA, Garcia Arencibia M, Vetrini F, Erdin S, Erdin SU, Huynh T, Medina D, Colella P, Sardiello M, Rubinsztein DC, Ballabio A (2011) TFEB links autophagy to lysosomal biogenesis. Science 332: 1429–1433 [DOI] [PMC free article] [PubMed] [Google Scholar]
- Settembre C, Zoncu R, Medina DL, Vetrini F, Erdin S, Erdin S, Huynh T, Ferron M, Karsenty G, Vellard MC, Facchinetti V, Sabatini DM, Ballabio A (2012) A lysosome‐to‐nucleus signalling mechanism senses and regulates the lysosome via mTOR and TFEB. EMBO J 31: 1095–1108 [DOI] [PMC free article] [PubMed] [Google Scholar]
- Settembre C, De Cegli R, Mansueto G, Saha PK, Vetrini F, Visvikis O, Huynh T, Carissimo A, Palmer D, Klisch TJ, Wollenberg AC, Di Bernardo D, Chan L, Irazoqui JE, Ballabio A (2013) TFEB controls cellular lipid metabolism through a starvation‐induced autoregulatory loop. Nat Cell Biol 15: 647–658 [DOI] [PMC free article] [PubMed] [Google Scholar]
- Shalem O, Sanjana NE, Hartenian E, Shi X, Scott DA, Mikkelsen TS, Heckl D, Ebert BL, Root DE, Doench JG, Zhang F (2014) Genome‐scale CRISPR‐Cas9 knockout screening in human cells. Science 343: 84–87 [DOI] [PMC free article] [PubMed] [Google Scholar]
- Tabas I, Ron D (2011) Integrating the mechanisms of apoptosis induced by endoplasmic reticulum stress. Nat Cell Biol 13: 184–190 [DOI] [PMC free article] [PubMed] [Google Scholar]
- Wang Q, Mora‐Jensen H, Weniger MA, Perez‐Galan P, Wolford C, Hai T, Ron D, Chen W, Trenkle W, Wiestner A, Ye Y (2009) ERAD inhibitors integrate ER stress with an epigenetic mechanism to activate BH3‐only protein NOXA in cancer cells. Proc Natl Acad Sci USA 106: 2200–2205 [DOI] [PMC free article] [PubMed] [Google Scholar]
- Wang R, McGrath BC, Kopp RF, Roe MW, Tang X, Chen G, Cavener DR (2013) Insulin secretion and Ca2+ dynamics in beta‐cells are regulated by PERK (EIF2AK3) in concert with calcineurin. J Biol Chem 288: 33824–33836 [DOI] [PMC free article] [PubMed] [Google Scholar]
- Wang Y, Zhou Y, Graves DT (2014) FOXO transcription factors: their clinical significance and regulation. Biomed Res Int 2014: 925350 [DOI] [PMC free article] [PubMed] [Google Scholar]
- Wek RC, Jiang HY, Anthony TG (2006) Coping with stress: eIF2 kinases and translational control. Biochem Soc Trans 34: 7–11 [DOI] [PubMed] [Google Scholar]
- Whitney ML, Jefferson LS, Kimball SR (2009) ATF4 is necessary and sufficient for ER stress‐induced upregulation of REDD1 expression. Biochem Biophys Res Commun 379: 451–455 [DOI] [PMC free article] [PubMed] [Google Scholar]
- Zanocco‐Marani T, Vignudelli T, Gemelli C, Pirondi S, Testa A, Montanari M, Parenti S, Tenedini E, Grande A, Ferrari S (2006) Tfe3 expression is closely associated to macrophage terminal differentiation of human hematopoietic myeloid precursors. Exp Cell Res 312: 4079–4089 [DOI] [PubMed] [Google Scholar]
Associated Data
This section collects any data citations, data availability statements, or supplementary materials included in this article.
Supplementary Materials
Appendix
Review Process File
Source Data for Figure 1
Source Data for Figure 2
Source Data for Figure 3
Source Data for Figure 5
Source Data for Figure 7
Source Data for Figure 8