

Abstract
Introduction
Electronic health records (EHR), increasingly a part of healthcare, provide a wealth of untapped narrative free text data that has the potential to accurately inform clinical outcomes.
Methods
From a validated cohort of patients with Crohn’s disease (CD) or ulcerative colitis (UC), we identified patients with ≥ 1 coded or narrative mention of monoclonal antibodies to tumor necrosis factor α (anti-TNF). Chart review by ascertained true use of therapy, time of initiation and cessation of treatment, as well as clinical response stratified as non-response, partial, or complete response at one year. Internal consistency was assessed in an independent validation cohort.
Results
A total of 3,087 patients had a mention of an anti-TNF. Actual therapy initiation was within 60 days of the first coded mention in 74% of patients. In the derivation cohort, 18% of anti-TNF starts were classified as non-response at 1 year, 21% as partial, and 56% as complete response. On multivariate analysis, the number of narrative mentions of diarrhea (OR 1.08, 95% CI 1.02 – 1.14) and fatigue (OR 1.16, 95% CI 1.02 – 1.32) were independently associated with non-response at 1 year (AUC 0.82). A likelihood of non-response score comprising a weighted sum of both demonstrated a good dose response relationship across non-responders (2.18), partial (1.20), and complete (0.50) responders (p < 0.0001) and correlated well with need for surgery or hospitalizations.
Conclusions
Narrative data in an EHR offers considerable potential to define temporally evolving disease outcomes such as non-response to treatment.
Keywords: Crohn’s disease, ulcerative colitis, treatment response, biologic, Responders, non-response, infliximab, IBD, Crohn’s disease, ulcerative colitis
INTRODUCTION
The past decades have seen a tremendous increase in the adoption of electronic health records (EHR) for patient care1–4. The EHR is continuously populated with valuable clinical content generated during routine care of the patient; however, there has been limited use of such data for research5–7. A primary factor limiting more widespread use of EHR data for research is the variability in quantity and quality of its data. There is tremendous variation in the recording of narrative data by physicians and other health-care providers8–10. In addition, though codified data (administrative codes usually assigned for billing purposes) are less subjective, the accuracy and predictive value for such codes also vary widely and often require complex algorithms to achieve an acceptable positive predictive value. Use of EHR for research has thus far comprised primarily of assigning disease labels (disease present or absent) or relied on objective test results or procedures (laboratory data, biochemical parameters, hospitalizations)5, 11–19. Early attempts at using free text data to identify more subjective concepts like disease activity states suggested that automated prediction is possible but misclassification remains a challenge20. There has been limited examination of whether narrative free text concepts can be used to identify response to treatment; yet this offers a significant potential for pharmacogenomic research and personalized treatment algorithms.
Crohn’s disease (CD) and ulcerative colitis (UC) comprising inflammatory bowel diseases (IBD) are complex immunologically mediated diseases that have a protracted course characterized by remission and relapse21, 22. Monoclonal antibodies to tumor necrosis factor-α (anti-TNF biologics) are important recent additions to the armamentarium against these diseases and have substantially improved our ability to achieve better patient outcomes23. However, despite their efficacy, many patients do not respond or lose response subsequent to an initial response. With availability of newer therapies with distinct mechanisms of action against inflammation, understanding biological determinants of response (or non-response) to each type of treatment will be immensely valuable for appropriate selections of patients to each treatment, maximizing likelihood of response while minimizing adverse effects. Thus far, this has necessarily needed to rely on prospective patient cohorts which are resource and personnel intensive and expensive. Being able to accurately identify responders and non-responders from the mix of data present in an EHR will substantially increase the size of populations available for clinical and translational analyses. Consequently, we performed this study with the following aims: (1) To use a large EHR-derived cohort of patients with CD or UC to define true users and non-users of therapy based on coded and narrative free text mentions; (2) to determine accuracy of timing of initiation and cessation of therapy; and (3) to identify performance and accuracy of narrative free text data in differentiating non-responders from responders to therapy.
METHODS
Study Population
Our study population consisted of patients with CD or UC seeking care at two tertiary referral hospitals (Massachusetts General Hospital and Brigham and Women’s Hospital) and affiliated health care practices within Partners Healthcare, serving over 3 million patients in the greater Boston metropolitan area. The development and validation of our cohort has been described previously11. In brief, we identified all patients with at least one International Classification of Diseases, 9th edition, clinical modification (ICD-9-CM) code for CD or UC (n=24,182). Using a combination of narrative free text concepts identified using natural language processing (NLP) as well as codified data comprising disease-related complications and procedures as well as medication data from the electronic prescription function of our EHR, we developed and validated an algorithm to classify patients as having CD or UC with a positive predictive value of 97%. This yielded a cohort of 5,522 UC and 5,506 CD patients.
Identification of true users, initiation and cessation of therapy
The first aim of our study was to identify patients who were true users of anti-TNF biologic therapy from those who had a codified or free text mention of treatment but were in fact non-users (Figure 1). This cohort was not restricted to newly diagnosed CD or UC and includes a subset of patients who were prevalent anti-TNF users at the time of seeking care in our medical system. First, we identified all patients with ≥1 medication code for anti-TNF biologics (infliximab (IFX) or adalimumab (ADA)) or at least one note with a free text mention for IFX, ADA or certolizumab pegol (CZP). At the time of this study, CZP did not have a distinct medication code in our EHR. Medication codes could comprise outpatient billing charges (such as administration of IFX), administration in hospitalized patients, electronic prescriptions, or entry as a coded drug in the medication section of our EHR. Free text mentions of biologics were identified by processing all outpatient and inpatient notes using an open-source apache clinical Text Analysis and Knowledge Extraction System (cTAKES; ctakes.apache.org)24. Medications terms were identified using the relevant concept unique identifiers (CUI) from the Unified Medical Language System (UMLS) database.
Figure 1.
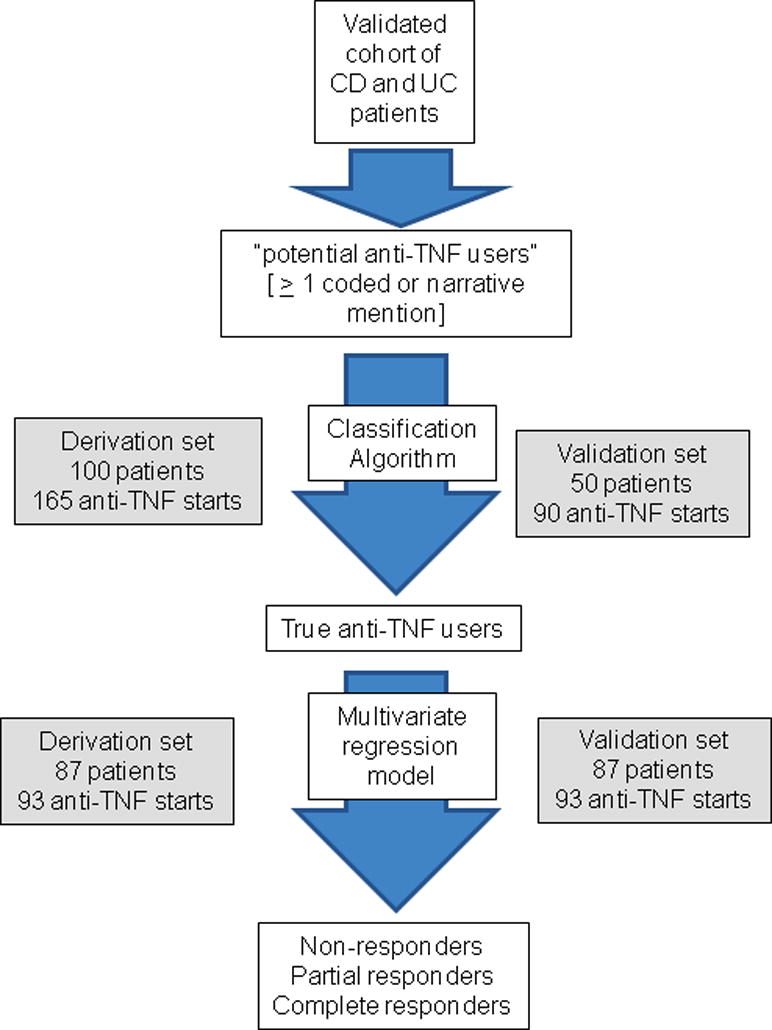
Flowchart representing study procedure to identify non-response to treatment in the electronic health record (EHR)
For differentiating users from non-users and to identify timing of initiation and cessation of therapy, we selected 100 patients at random from among those with at least one codified or free text mention of an anti-TNF biologic who comprised our derivation cohort. An independent random sample of 50 patients comprised our validation cohort. Detailed chart review was performed by a board certified gastroenterologist specializing in IBD care (A.N.A) to identify whether patients were true users of therapy and note the month of actual initiation and cessation of each anti-TNF biologic. As narrative or codified mentions may represent past, current, or hypothetical future use of therapy, we first developed criteria that could reliably separate out true users from non-users with minimal misclassification based on number of narrative and codified mentions as well as intervals between narrative and codified mentions of therapy. The performance of the criteria was assessed by calculating the area under the receiver operating characteristics curve (AUROC) and confirmed in the validation cohort. The chart review also identified whether true initiation of therapy occurred within 60 days of first codified or narrative mention of drug and to identify predictors of accuracy of date of initiation of therapy (Figure 1). A similar process was carried out to determine whether cessation of therapy occurred within 60 days of last codified or narrative mention of drug. All chart review was blinded to the predictor variables.
Prediction of response
After determining criteria to exclude non-users of therapy, a random sample of 150 ‘true users’ were selected and divided at random into derivation and validation cohorts (Figure 1). Physician chart review was performed to classify patients into clinical non-responders, partial responders, and complete responders to anti-TNF therapy based on symptoms, endoscopy, radiology, and other relevant data in the EHR within 1 year of therapy initiation. Patients who initially responded to treatment but subsequently lost response within 365 days were classified as partial responders while those who retained their response through the entire period were classified complete responders. In addition to this subjective classification of outcome, we also assessed a hard endpoint of non-response to therapy that included the need for IBD-related surgery, hospitalizations, or a new prescription for systemic steroids within 365 days of initiation of anti-TNF therapy.
The clinical expert (A.N.A) created a customized list of narrative concepts to identify potential classifiers of response and non-response to therapy. These included symptoms such as pain, diarrhea, fatigue, rectal bleeding, and tenesmus in addition to phrases that may be used in the context of response (“remission” “decreased” “response”) or non-response (“relapse”) to treatment. The frequency of use of these phrases was added up for a 1-year period after first codified mention of treatment. Logistic regression models were used to identify independent classifiers of non-response and performance assessed in the derivation and validation cohorts. Our primary outcome for this analysis was non-response to treatment at 1 year. A score – likelihood of non-response - was calculated by multiplying the log odds ratio by the number of narrative mentions for each independently significant predictor variable [score = (log-odds predictor 1 × number of mentions of predictor 1) + (log-odds predictor 2 × number of mentions of predictor 2)+….]. This score was intended to be a non-bounded measure (i.e. not restricted between 0–1) and could take any positive or negative value depending on the number of net positive mentions of each independent multivariate predictor. On a continuous scale, a higher likelihood score suggested a greater probability of that individual being classified as non-responder at 1 year; however the score was not a probability score and did not assign a percentage chance of being a non-responder. The performance of this score in predicting the composite hard outcome was assessed as also its ability to distinguish non-response from partial and complete response.
Statistical Analysis
All analyses were performed using Stata 13.1 (Stata Corp, College Station, TX). Continuous variables were summarized using median and interquartile ranges while categorical variables were summarized using proportions and compared using the chi-square test. Logistic regression with non-use as the primary outcome was performed to identify predictors of use of therapy as the first step while the outcome “non-response at 1 year” was used to identify univariate and independent predictors of response to therapy. A two-sided p-value < 0.05 indicated independent statistical significance. The study protocol was approved by the institutional review board of Partners Healthcare.
RESULTS
Study Population
Our cohort included 5,522 patients with UC and 5,506 patients with CD. The median age was 46 years (interquartile range (IQR) 32 – 61 years) and just over half (53%) were women. The median age at first diagnosis code for IBD was 39 years with a subsequent follow-up of 8 years. A total of 3,087 patients (28%) had either a codified or free text mention of an anti-TNF biologic (1,473 (12%) with codified mentions and 2,992 (27%) with narrative free text mentions). Nearly all patients (93%) with a codified mention had one or more free text mentions (93%) while only 40% of those with free text mentions had a codified mention. Patients with CD were more likely to have either codified (17% vs. 7%) or narrative free text (44% vs. 11%) mentions compared to those with UC.
Differentiation of users from non-users
We selected 100 patients at random with at least one codified or free text mention of an anti-TNF biologic, comprising 165 unique anti-TNF starts (58% IFX, 30% ADA, 12% CZP). The vast majority of patients with a coded mention of IFX or ADA were true users of therapy in comparison to those with narrative mentions where up to a quarter of patients with a narrative mention of ADA never started the therapy (Supplemental Table 1). Among the 165 unique anti-TNF starts, 5 patients had started the biologic prior to receiving care at our hospital and 34 (21%) of mentions or codes were never followed by initiation of the corresponding anti-TNF agent. The best algorithm to separate true users from non-users consisted of exclusion of patients who met all the following criteria – (i) < 3 narrative mentions of the specific anti-TNF; (ii) interval between first and last narrative mention of 0 days, and (iii) no coded mention of the therapy. These criteria excluded 20% of potential users (i.e. those with ≥1 coded or narrative mention) but captured 97% of true users and had a false positive rate (classifying non-users as users) of only 4% with an AUROC of 0.91.
Initiation and cessation of therapy
We then examined if actual start of therapy corresponded to the first coded or free text mention focusing on 122 starts of IFX or ADA. On chart review, nearly three-quarters of the starts (74%) were within 60 days from the date of first coded mention with a median interval of 23 days (IQR 6 – 57 days) (Supplemental Table 2). Fewer than 2% of the starts were 60 days or longer after the first codified mention. However, only 52% of the starts were within 60 days of the first narrative mention of the agent with a median interval of 5 days (IQR -190 to 17 days). In contrast to the ability to identify treatment start date, both codified and narrative data performed poorly in identifying time of cessation of treatment. The actual end date was within 60 days of the last codified or free text mention in only 21% and 54% of patients respectively. A similar modest performance was observed if the end date was assumed to be start date of the next anti-TNF or first free text mention of another biologic.
The validation cohort consisted of an independent random set of 50 patients comprising 90 distinct anti-TNF starts. Applying our exclusion criteria, 99% of starts included were true users of therapy. Further, only 4% of true users were left out by exclusion criteria. A similar proportion of therapy initiation in our validation cohort (73%) was within 60 days of the first coded mention, and < 5% of starts were 60 days or longer after the first coded mention, supporting the accuracy of this as a proxy for starting therapy.
Response to treatment
A random sample of 150 patients, comprising 186 distinct starts of IFX or ADA, was divided into derivation and validation cohorts comprising 93 distinct anti-TNF starts each (Table 1). There were no differences in age, gender, type of IBD or anti-TNF therapy between the two groups. On chart review, 18% of starts were classified as non-response at 1 year; 21% as partial response, and 56% as complete response with unclassifiable information on the remaining 5%. Approximately 81 starts (44%) had a prescription for systemic steroids and 15 (8%) underwent surgery within 1 year. There was good correlation between physician-assigned treatment response and the composite outcome of steroid use, surgery or hospitalization (correlation coefficient, 0.33, p < 0.0001).
Table 1.
Characteristics of the study population
| Characteristic | Median (IQR) |
|---|---|
| Age (in years) | 38 (28 – 48) |
| Age at first IBD code (in years) | 30 (22 – 40) |
| Sex | |
| Male | 67 (45%) |
| Female | 83 (55%) |
| Type of IBD | |
| Crohn’s disease | 104 (70%) |
| Ulcerative colitis | 46 (30%) |
| Anti-TNF type | |
| Infliximab | 128 (66%) |
| Adalimumab | 60 (31%) |
| Certolizumab | 6 (3%) |
| NLP concepts | |
| Pain | 32 (9 – 97) |
| Diarrhea | 3 (1 – 10) |
| Relapse | 0 (0 – 0) |
| Abdomen | 17 (7 – 39) |
| Bleeding | 2 (0 – 6) |
| Tenesmus | 0 (0 – 0) |
| Colonoscopy | 4 (1 – 9) |
| Fatigue | 1 (0 – 3) |
| Absence of pain | 0 (0 – 1) |
| Remission | 1 (0 – 4) |
| Lowest C-reactive protein (within 365 days of an anti-TNF start)a | 2 (1 – 5.4) |
| Hospitalization within 365 daysb | 72 |
| Surgery within 365 daysb | 15 |
| Prednisone prescription within 365 daysb | 81 |
| Physician ascertained response at 365 days after anti-TNF start | |
| Non-response | 33 (18%) |
| Partial response | 39 (21%) |
| Complete response | 105 (56%) |
| Unknown response | 2 (1%) |
| Lost to follow-up | 7 (4%) |
available for 118 anti-TNF starts
Out of 186 eligible anti-TNF starts
The most frequent narrative concepts from within our customized library mentioned within 1 year of initiation of therapy were pain (median 32 mentions), abdomen (17 mentions), colonoscopy (4 mentions) and diarrhea (3 mentions). Table 2 presents the results of univariate analysis with non-response at one year as the primary outcome while Table 3 presents the corresponding adjusted multivariate estimates. Two narrative variables independently identified non-responders. Each additional mention of fatigue was associated with a 16% increase in likelihood of non-response (odds ratio (OR) 1.16, 95% confidence interval (CI) 1.02 – 1.32) while an 8% increase was seen for each additional mention of diarrhea (OR 1.08, 95% CI 1.02 – 1.14). The performance of the multivariate model was good with an AUROC of 0.82. The validation cohort confirmed the independent association with fatigue and diarrhea with a similar AUROC of 0.84 (Table 3). A likelihood of non-response score could be generated by multiplying the logistic regression coefficients for diarrhea and fatigue by the number of narrative mentions. This had a median value of 0.53 (range 0 – 7.1) with higher values representing greater likelihood of non-response. The score demonstrated a good dose response relationship with incrementally lower values for non-responders (2.18), partial (1.20), and complete (0.50) responders (p < 0.0001) (Figure 2). The likelihood of non-response score was also higher in those with the composite hard endpoint than those who did not achieve this (1.36 vs. 0.50, p < 0.0001) (Figure 3). Similar results were obtained in both CD and UC and the model performed equally well in both diseases.
Table 2.
Univariate analysis of predictors of non-response to anti-TNF biologic therapy in inflammatory bowel disease
| Term | Odds ratio for non-response |
|---|---|
| Pain | 1.01 (1.00 – 1.02) |
| Diarrhea | 1.09 (1.03 – 1.15) |
| Relapse | 1.12 (0.59 – 2.11) |
| Abdomen | 1.01 (1.00 – 1.02) |
| Bleeding | 1.01 (0.92 – 1.10) |
| Tenesmus | 1.01 (0.50 – 2.05) |
| Colonoscopy | 1.03 (0.99 – 1.08) |
| Fatigue | 1.18 (1.04 – 1.34) |
| Absence of pain | 0.92 (0.65 – 1.29) |
| Remission | 1.00 (0.89 – 1.12) |
TNF – tumor necrosis factor α
Table 3.
Multivariable analysis of predictors of non-response to anti-TNF biologic therapy in inflammatory bowel disease
| Predictor | Derivation cohort Odds ratio (95% CI) |
Validation cohort Odds ratio (95% CI) |
|---|---|---|
| Fatigue | 1.16 (1.02 – 1.32) | 1.12 (1.01 – 1.24) |
| Diarrhea | 1.08 (1.02 – 1.14) | 1.09 (1.03 – 1.15) |
| AUROC | 0.82 | 0.84 |
AUROC – area under the receiver operating characteristics curve
Figure 2.
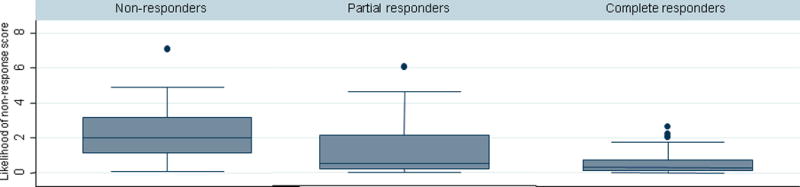
Likelihood of classification as non-responder, partial responder, and complete responder based on narrative free text data
Figure 3. Correlation between hospitalization, surgery, or corticosteroid prescription and narrative classification of non-response.

Composite outcome was defined as requiring IBD-related surgery, hospitalization, or new prescription for corticosteroids within 365 days of initiating biologic therapy.
DISCUSSION
The growth in EHR utilization from 9% of the hospitals in 2008 to over 59% of the hospitals in 2013 makes it a valuable but underutilized resource for clinical research4, 6, 7. Bioinformatics algorithms incorporating codified and narrative free text data have demonstrated the ability to assign disease labels with a high level of accuracy11–13, 18. Such disease classifiers can then be linked with genetic data to perform genome-wide (GWAS) and phenome-wide association studies (PheWAS), replicating findings previously requiring carefully curated prospective cohorts15, 18, 19. Yet, more nuanced analyses of temporal changes in disease states such as disease activity or response to treatment has been more challenging due, in significant part, to variations in quality and structure of data in the EHR. In this study, using a large cohort of patients with IBD, we present a novel algorithm to identify true users of anti-TNF biologic therapy, establish timing of initiation of treatment, and define narrative free text concepts that can be used to identify non-responders to anti-TNF treatment.
Identification of timing of initiation and cessation of treatment is inherently challenging in the EHR for several reasons. Discussion regarding initiation of a drug may precede the actual start by several weeks or even months. This may be particularly relevant for drugs such as anti-TNF biologics, where there are multiple choices within a treatment class, all of comparable efficacy yet varying by dose, ease and route of administration, thus influencing patient (and provider) preferences. As well for expensive medications, formulary coverage within individual insurance plans may influence choice of treatment, and thus narrative mention may not translate into actual initiation of therapy. In contrast, codified data that is populated by a healthcare provider entry, electronic prescription, or billing information performed better in identifying true use of treatment as well as correlated well with timing of initiation of treatment. However, codified data was also susceptible to misclassifying past users as non-users if there was no active use during the period of care at one of our hospitals. The accuracy of codified data may have been further diluted by the self-administered nature of two of the biologics (ADA, CZP) which may thus be captured less well in the EHR. Both narrative and codified data performed poorly in identifying actual ending of treatment as narrative mentions of past use and failure or therapy continue to be frequent in the chart well after treatment has been stopped. As well, medications are frequently not inactivated on cessation of use, evidenced by the growing recognition of the need for medication reconciliation at every healthcare encounter25–27.
Our final logistic regression model incorporating number of mentions of diarrhea and fatigue demonstrated good performance in identifying non-response to treatment in both our derivation and validation cohorts. The classifiers intuitively carry face value as diarrhea is the most commonly noted symptom of both CD and UC. Fatigue is increasingly being recognized as an important extra-intestinal manifestation in IBD and correlates strongly with disease activity28. In a large study of 318 patients with IBD, 72% of those with active disease reached clinical thresholds for fatigue compared to 30% with inactive disease28, and participants with consistently inactive disease had the lowest level of fatigue29. The performance of the model was superior in predicting clinical response to treatment when compared to a harder composite outcome of surgery, hospitalizations, or prescription for systemic steroids. This may be because although disease activity is an important determinant of the composite outcome, need for hospitalization in IBD is often multi-factorial with patient and provider preferences also playing a role. While we did not observe a significant correlation between the lowest C-reactive protein level and our likelihood of non-response score, this may reflect in part the small numbers of patients with available CRP measures as well as variation in physician practice in obtaining CRP such that these tests may be ordered only when non-response is suspected, introducing bias.
Use of EHR data in longitudinal research has traditionally been restricted to defining diseases, laboratory markers, procedures, or hospitalizations. However, the EHR also consists of a wealth of narrative data that include patients self-report of symptoms and the treated providers’ perspective on the health status of the patient. Such granular data offers the potential to temporally track changes in activity states for a given disease, over time and in response to interventions. There have been a few attempts at using EHR data to model such temporally changing disease states or for pharmacogenomic research30. Lin et al. developed an automated prediction model incorporating laboratory, codified, and narrative free text data to predict rheumatoid arthritis disease activity in an EHR cohort20. Their model demonstrated a good ability to assign disease activity when compared to physician review (AUROC 0.83), similar to that identified in our study. Their algorithm performed better in separating out extreme categories of disease activity when compared to intermediate strata, similar to our experience where our likelihood of non-response score had a better AUROC in separating out non-response from complete response (AUROC 0.87) when compared to non-response from partial response (AUROC 0.72). Xia et al. used EHR data to derive a multiple sclerosis severity score which correlated well with experience from prospective cohorts13. Perlis et al. were able identify patients with treatment resistant depression using narrative phrases such as ‘depressed’, ‘anxious mood’ and ‘much better’ with their model combining narrative and codified data having an AUC of 0.88 for prediction of the ‘well’ state31. However, all these studies assessed activity states cross-sectionally, in distinction to the present study which looked at response over time.
There are several limitations to our study. The cohort consisted of patients receiving care at one of two tertiary hospital centers specializing in the care of IBD and is likely skewed towards those with more refractory disease. Within each hospital, the care of these patients is managed by several different gastroenterologists and other healthcare providers. Given the recognized inter-provider variation in quality and format of documentation in the EHR, this lends generalizability to our findings. Second, we focused on patients initiating treatment with anti-TNF biologics and consequently likely had more severe disease and may have closer follow-up with frequent healthcare visits than those with milder disease initiating other therapies. Third, our gold standard was assignment of a response category by a specialized IBD physician. One may argue that correlating with standardized disease activity indices may have provided a more robust endpoint. However, such disease activity measures are not usually part of routine clinical care and furthermore have been shown to correlate poorly with objective markers of inflammation32, 33. A fourth limitation is the potential for fractured care documentation between different providers who may not all be captured within our EHR, such as patients’ local gastroenterologists. While defining diseases based on algorithms has demonstrated portability across diverse EHRs, similar studies are required for analysis of narrative data and temporally changing disease activity states. Fifth, it is possible that a subset of patients initiating biologics may have steroid dependent disease, and thus remained with milder symptoms than others not on steroids, leading us to assign them a lower likelihood of non-response. However, it is unlikely that no attempt was made to taper off steroids and symptomatic relapses requiring re-initiation or escalation of dose of steroids would have been captured through office visits, phone contacts or electronic communications within the EHR. The low density of EHR documentation within the first few weeks of therapy precluded our ability to differentiate primary from secondary non-responders. Finally, like other studies, compliance to medications could not be assessed, particularly for self-administered agents.
In conclusion, we demonstrate that despite the inherent variation in quality of documentation within an EHR, it is possible to identify non-responders to anti-TNF biologics in a population of patients with IBD with a high level of accuracy. Automated prediction of treatment response has significant potential to facilitate efficient development of large clinical cohorts for pharmacogenetic studies, an endeavor that has hitherto relied on the prospectively collected cohorts which are expensive and personnel intensive. With availability of newer therapies with distinct mechanisms of action, personalizing treatment by matching patient probability of response to each individual agent is likely to become increasingly important, and EHR-derived research has a significant potential to help address this unmet need.
Supplementary Material
Acknowledgments
Sources of Funding: The study was supported by NIH U54-LM008748. A.N.A is supported by funding from the US National Institutes of Health (K23 DK097142) and Amgen. K.P.L. is supported by NIH K08 AR060257 and the Harold and Duval Bowen Fund. E.W.K is supported by grants from the NIH (K24 AR052403, P60 AR047782, R01 AR049880).
Footnotes
Conflicts of interest: Ananthakrishnan and Churchill received funding from Amgen; Ananthakrishnan has received research support from Cubist and has served on the scientific advisory boards for Cubist and Abbvie. None of the authors have any conflicts of interest.
Specific author contributions:
Study concept – Ananthakrishnan
Study design – Ananthakrishnan
Data Collection – Ananthakrishnan, Gainer, Cagan, Cai, Churchill, Kohane, Shaw, Liao, Murphy, Savova
Analysis – Ananthakrishnan
Preliminary draft of the manuscript – Ananthakrishnan
Approval of final version of the manuscript – Ananthakrishnan, Gainer, Cagan, Cai, Churchill, Kohane, Shaw, Liao, Murphy, Savova
Guarantor of the article: Ananthakrishnan
All authors approved the final version of the manuscript.
References
- 1.Jha AK, Burke MF, DesRoches C, et al. Progress toward meaningful use: hospitals’ adoption of electronic health records. Am J Manag Care. 2011;17:SP117–24. [PubMed] [Google Scholar]
- 2.Jha AK, DesRoches CM, Kralovec PD, et al. A progress report on electronic health records in U.S. hospitals. Health Aff (Millwood) 2010;29:1951–7. doi: 10.1377/hlthaff.2010.0502. [DOI] [PubMed] [Google Scholar]
- 3.Nakamura MM, Harper MB, Jha AK. Change in adoption of electronic health records by US children’s hospitals. Pediatrics. 2013;131:e1563–75. doi: 10.1542/peds.2012-2904. [DOI] [PubMed] [Google Scholar]
- 4.Charles D, King J, Patel V, et al. Adoption of Electronic Health Record Systems among US Non federal Acute Care Hospitals: 2008–2012. Washington, DC: Office of the National Coordinator for Health Information Technology; Mar, 2013. (ONC Data Brief, no 9). [Google Scholar]
- 5.Gottesman O, Kuivaniemi H, Tromp G, et al. The Electronic Medical Records and Genomics (eMERGE) Network: past, present, and future. Genet Med. 2013;15:761–71. doi: 10.1038/gim.2013.72. [DOI] [PMC free article] [PubMed] [Google Scholar]
- 6.Kohane IS. Using electronic health records to drive discovery in disease genomics. Nat Rev Genet. 2011;12:417–28. doi: 10.1038/nrg2999. [DOI] [PubMed] [Google Scholar]
- 7.Mandl KD, Kohane IS. Escaping the EHR trap–the future of health IT. N Engl J Med. 2012;366:2240–2. doi: 10.1056/NEJMp1203102. [DOI] [PubMed] [Google Scholar]
- 8.Edwards ST, Neri PM, Volk LA, et al. Association of note quality and quality of care: a cross-sectional study. BMJ Qual Saf. 2014;23:406–13. doi: 10.1136/bmjqs-2013-002194. [DOI] [PubMed] [Google Scholar]
- 9.Pollard SE, Neri PM, Wilcox AR, et al. How physicians document outpatient visit notes in an electronic health record. Int J Med Inform. 2013;82:39–46. doi: 10.1016/j.ijmedinf.2012.04.002. [DOI] [PubMed] [Google Scholar]
- 10.Stetson PD, Bakken S, Wrenn JO, et al. Assessing Electronic Note Quality Using the Physician Documentation Quality Instrument (PDQI-9) Appl Clin Inform. 2012;3:164–174. doi: 10.4338/ACI-2011-11-RA-0070. [DOI] [PMC free article] [PubMed] [Google Scholar]
- 11.Ananthakrishnan AN, Cai T, Savova G, et al. Improving case definition of Crohn’s disease and ulcerative colitis in electronic medical records using natural language processing: a novel informatics approach. Inflamm Bowel Dis. 2013;19:1411–20. doi: 10.1097/MIB.0b013e31828133fd. [DOI] [PMC free article] [PubMed] [Google Scholar]
- 12.Liao KP, Cai T, Gainer V, et al. Electronic medical records for discovery research in rheumatoid arthritis. Arthritis Care Res (Hoboken) 2010;62:1120–7. doi: 10.1002/acr.20184. [DOI] [PMC free article] [PubMed] [Google Scholar]
- 13.Xia Z, Secor E, Chibnik LB, et al. Modeling disease severity in multiple sclerosis using electronic health records. PLoS One. 2013;8:e78927. doi: 10.1371/journal.pone.0078927. [DOI] [PMC free article] [PubMed] [Google Scholar]
- 14.Carroll RJ, Thompson WK, Eyler AE, et al. Portability of an algorithm to identify rheumatoid arthritis in electronic health records. J Am Med Inform Assoc. 2012;19:e162–9. doi: 10.1136/amiajnl-2011-000583. [DOI] [PMC free article] [PubMed] [Google Scholar]
- 15.Cronin RM, Field JR, Bradford Y, et al. Phenome-wide association studies demonstrating pleiotropy of genetic variants within FTO with and without adjustment for body mass index. Front Genet. 2014;5:250. doi: 10.3389/fgene.2014.00250. [DOI] [PMC free article] [PubMed] [Google Scholar]
- 16.Kho AN, Pacheco JA, Peissig PL, et al. Electronic medical records for genetic research: results of the eMERGE consortium. Sci Transl Med. 2011;3:79re1. doi: 10.1126/scitranslmed.3001807. [DOI] [PMC free article] [PubMed] [Google Scholar]
- 17.Kullo IJ, Ding K, Shameer K, et al. Complement receptor 1 gene variants are associated with erythrocyte sedimentation rate. Am J Hum Genet. 2011;89:131–8. doi: 10.1016/j.ajhg.2011.05.019. [DOI] [PMC free article] [PubMed] [Google Scholar]
- 18.Ritchie MD, Denny JC, Crawford DC, et al. Robust replication of genotype-phenotype associations across multiple diseases in an electronic medical record. Am J Hum Genet. 2010;86:560–72. doi: 10.1016/j.ajhg.2010.03.003. [DOI] [PMC free article] [PubMed] [Google Scholar]
- 19.Ritchie MD, Denny JC, Zuvich RL, et al. Genome- and phenome-wide analyses of cardiac conduction identifies markers of arrhythmia risk. Circulation. 2013;127:1377–85. doi: 10.1161/CIRCULATIONAHA.112.000604. [DOI] [PMC free article] [PubMed] [Google Scholar]
- 20.Lin C, Karlson EW, Canhao H, et al. Automatic prediction of rheumatoid arthritis disease activity from the electronic medical records. PLoS One. 2013;8:e69932. doi: 10.1371/journal.pone.0069932. [DOI] [PMC free article] [PubMed] [Google Scholar]
- 21.Baumgart DC, Sandborn WJ. Crohn’s disease. Lancet. 2012;380:1590–605. doi: 10.1016/S0140-6736(12)60026-9. [DOI] [PubMed] [Google Scholar]
- 22.Ordas I, Eckmann L, Talamini M, et al. Ulcerative colitis. Lancet. 2012;380:1606–19. doi: 10.1016/S0140-6736(12)60150-0. [DOI] [PubMed] [Google Scholar]
- 23.D’Haens GR, Panaccione R, Higgins PD, et al. The London Position Statement of the World Congress of Gastroenterology on Biological Therapy for IBD with the European Crohn’s and Colitis Organization: when to start, when to stop, which drug to choose, and how to predict response? Am J Gastroenterol. 2011;106:199–212. doi: 10.1038/ajg.2010.392. quiz 213. [DOI] [PubMed] [Google Scholar]
- 24.Savova GK, Masanz JJ, Ogren PV, et al. Mayo clinical Text Analysis and Knowledge Extraction System (cTAKES): architecture, component evaluation and applications. J Am Med Inform Assoc. 2010;17:507–13. doi: 10.1136/jamia.2009.001560. [DOI] [PMC free article] [PubMed] [Google Scholar]
- 25.Duran-Garcia E, Fernandez-Llamazares CM, Calleja-Hernandez MA. Medication reconciliation: passing phase or real need? Int J Clin Pharm. 2012;34:797–802. doi: 10.1007/s11096-012-9707-2. [DOI] [PubMed] [Google Scholar]
- 26.Lehnbom EC, Stewart MJ, Manias E, et al. Impact of medication reconciliation and review on clinical outcomes. Ann Pharmacother. 2014;48:1298–312. doi: 10.1177/1060028014543485. [DOI] [PubMed] [Google Scholar]
- 27.Quelennec B, Beretz L, Paya D, et al. Potential clinical impact of medication discrepancies at hospital admission. Eur J Intern Med. 2013;24:530–5. doi: 10.1016/j.ejim.2013.02.007. [DOI] [PubMed] [Google Scholar]
- 28.Pellino G, Sciaudone G, Caserta V, et al. Fatigue in inflammatory bowel diseases: relationship with age and disease activity. Int J Surg. 2014;12(Suppl 2):S60–3. doi: 10.1016/j.ijsu.2014.08.379. [DOI] [PubMed] [Google Scholar]
- 29.Graff LA, Clara I, Walker JR, et al. Changes in fatigue over 2 years are associated with activity of inflammatory bowel disease and psychological factors. Clin Gastroenterol Hepatol. 2013;11:1140–6. doi: 10.1016/j.cgh.2013.03.031. [DOI] [PubMed] [Google Scholar]
- 30.Yasmina A, Deneer VH, Maitland-van der Zee AH, et al. Application of routine electronic health record databases for pharmacogenetic research. J Intern Med. 2014;275:590–604. doi: 10.1111/joim.12226. [DOI] [PubMed] [Google Scholar]
- 31.Perlis RH, Iosifescu DV, Castro VM, et al. Using electronic medical records to enable large-scale studies in psychiatry: treatment resistant depression as a model. Psychol Med. 2012;42:41–50. doi: 10.1017/S0033291711000997. [DOI] [PMC free article] [PubMed] [Google Scholar]
- 32.Jones J, Loftus EV, Jr, Panaccione R, et al. Relationships between disease activity and serum and fecal biomarkers in patients with Crohn’s disease. Clin Gastroenterol Hepatol. 2008;6:1218–24. doi: 10.1016/j.cgh.2008.06.010. [DOI] [PubMed] [Google Scholar]
- 33.Solem CA, Loftus EV, Jr, Tremaine WJ, et al. Correlation of C-reactive protein with clinical, endoscopic, histologic, and radiographic activity in inflammatory bowel disease. Inflamm Bowel Dis. 2005;11:707–12. doi: 10.1097/01.mib.0000173271.18319.53. [DOI] [PubMed] [Google Scholar]
Associated Data
This section collects any data citations, data availability statements, or supplementary materials included in this article.