

Abstract
Mitochondrial dysfunction and altered proteostasis are central features of neurodegenerative diseases. The pitrilysin metallopeptidase 1 (PITRM1) is a mitochondrial matrix enzyme, which digests oligopeptides, including the mitochondrial targeting sequences that are cleaved from proteins imported across the inner mitochondrial membrane and the mitochondrial fraction of amyloid beta (Aβ). We identified two siblings carrying a homozygous PITRM1 missense mutation (c.548G>A, p.Arg183Gln) associated with an autosomal recessive, slowly progressive syndrome characterised by mental retardation, spinocerebellar ataxia, cognitive decline and psychosis. The pathogenicity of the mutation was tested in vitro, in mutant fibroblasts and skeletal muscle, and in a yeast model. A Pitrm1 +/− heterozygous mouse showed progressive ataxia associated with brain degenerative lesions, including accumulation of Aβ‐positive amyloid deposits. Our results show that PITRM1 is responsible for significant Aβ degradation and that impairment of its activity results in Aβ accumulation, thus providing a mechanistic demonstration of the mitochondrial involvement in amyloidotic neurodegeneration.
Keywords: amyloid beta, mitochondrial targeting sequence, mitochondrial disease, neurodegeneration, pitrilysin 1
Subject Categories: Genetics, Gene Therapy & Genetic Disease; Metabolism; Neuroscience
Introduction
Mitochondrial dysfunction, whether primary or secondary, is increasingly recognised as a hallmark of neurodegeneration (Johri & Beal, 2012; Moran et al, 2012). Not only is the brain a major target in primary, genetically determined mitochondrial disease, but mitochondrial dysfunction is also a prominent feature in many of the most prevalent neurodegenerative diseases including Parkinson's disease (PD) and Alzheimer's dementia (AD) (Manczak et al, 2006; Morais & De Strooper, 2010; Friedland‐Leuner et al, 2014). For instance, AD is characterised by the accumulation of the amyloid beta (Aβ) peptide as plaques in the neuropil, and recent work has suggested that Aβ is present in the inner compartment of mitochondria (Falkevall et al, 2006; Manczak et al, 2006; Hansson Petersen et al, 2008). The mitochondrial fraction of Aβ is quantitatively digested by the pitrilysin metallopeptidase 1 (PITRM1) (Hansson Petersen et al, 2008; Pagani & Eckert, 2011; Pinho et al, 2014). PITRM1 (also known as presequence peptidase, PreP) is a 117 kDa mitochondrial matrix enzyme. In addition to its role in the disposal of mitochondrial Aβ, PITRM1 is deemed responsible for digesting the mitochondrial targeting sequence (MTS) of proteins imported across the inner mitochondrial membrane (Stahl et al, 2002; Alikhani et al, 2011a,b; Teixeira & Glaser, 2013), which are cleaved from the mature polypeptides by the mitochondrial matrix peptidase (MMP). Interestingly, the accumulation of Aβ peptides has been shown to inhibit the activity of Cym1, the PITRM1 orthologue in yeast, leading to impaired MTS processing and accumulation of precursor proteins (Mossmann et al, 2014). We report here a family carrying a missense mutation in PITRM1 associated with a slowly progressive neurodegenerative phenotype. Investigations in vitro as well as in yeast and mouse models allowed us to clarify the mechanism of the disease and shed new light on the relationship between mitochondria and neurodegeneration.
Results
PITRM1 is mutated in patients with a neurodegenerative phenotype
We studied a single index family (Fig 1A) coming from a small Norwegian coastal community comprising < 200 individuals. Of five siblings, two are definitely affected (II‐2, II‐4); one unaffected sibling has a peripheral neuropathy (II‐1); another has psychiatric symptoms, but refuses investigation (II‐5); and one died of cancer (II‐3) before we ascertained the family. Our study was approved by the Regional Committee for Medical and Health Research Ethics, Western Norway. The index case (II‐2), now 68 years old, was diagnosed as a child with mild mental retardation and later developed gradual spinocerebellar ataxia (SCA), obsessional behaviour with psychotic episodes and hallucinations. Brain MRI (Fig 1B) showed marked cerebellar atrophy and unilateral signal changes in the thalamus. Routine blood profile was unremarkable, but CSF examination showed low Aβ1–42 (363 ng/l; n.v. > 550), similar to that seen in idiopathic AD (Motter et al, 1995; Andreasen et al, 1999). Total and phosphorylated Tau and 14‐3‐3 proteins were normal. A muscle biopsy showed some scattered COX‐negative fibres (Fig 1C). Her brother (II‐4) was also described as mildly mentally retarded from an early age, had obsessional behaviour and episodes of psychosis, and early onset ataxia. His CT scan showed cerebellar and some cerebral atrophy. Respiratory chain (RC) complex assays in muscle homogenate from individual II‐2 showed low specific activities of all complexes, and a concomitant decrease in citrate synthase (CS), an index of mitochondrial mass (Fig 1D). When specific activities were normalised to CS, no significant changes were observed relative to controls, except for a trend towards complex I decrease. No abnormality was seen in an enriched mitochondrial fraction from mutant immortalised fibroblasts. Combined homozygosity SNP‐based mapping and whole exome sequencing (WES) were carried out in II‐2 based on an autosomal recessive mode of inheritance. WES resulted in 20,436 genetic variants, of which 240 were coding and not found in our in‐house frequency database or in the 1000 Genomes database at > 0.5% allele frequency. A total of 13 genes contained rare variants consistent with autosomal recessive inheritance, and of these, only one gene, PITRM1, was located within a homozygous region on chromosome 10p shared by both affected siblings. The mutation NM_014889.2:c.548G>A, verified by Sanger sequencing (Appendix Fig S1), was absent in the clinically unaffected brother (II‐1), in > 300 normal control individuals from Western Norway and in the ExAc database (http://exac.broadinstitute.org). It predicts the synthesis of a p.R183Q variant. The R183 residue is conserved in both humans and baker's yeast.
Figure 1. Clinical and molecular studies on PITRM1 R183Q mutant patients.
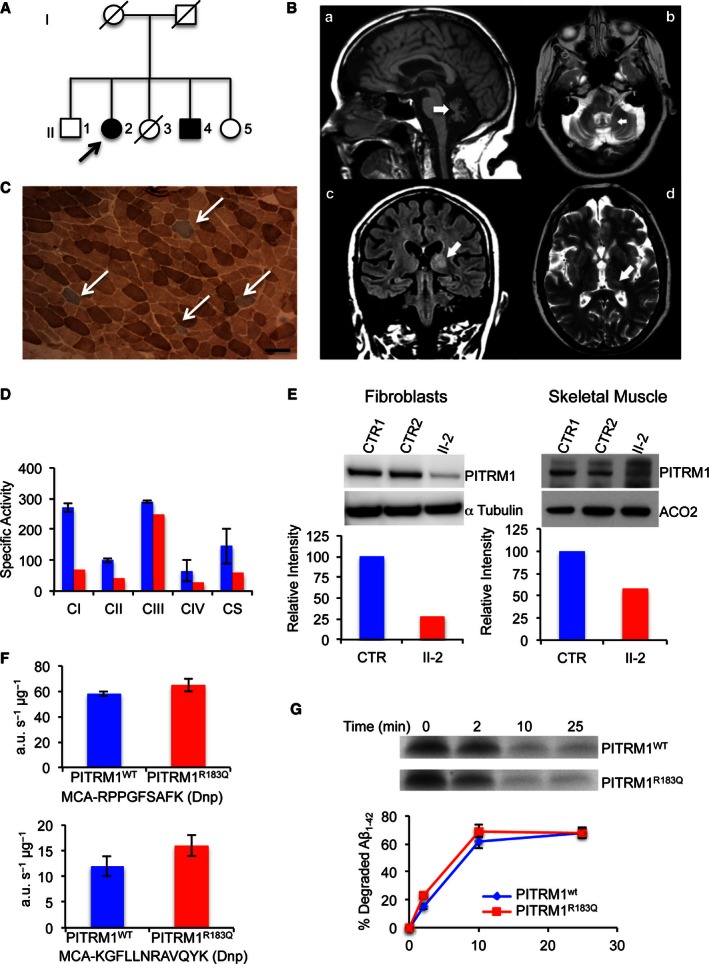
- Family tree. Affected subjects are represented by filled shapes. The index case is II‐2 (arrow).
- Brain MRI images of II‐1 (FLAIR). A: (a) sagittal interemispheric sequence showing profound cerebellar atrophy (arrow); (b) transverse sequence showing involvement of the dentate nuclei of cerebellum; (c) coronal sequence revealing cortical atrophy, a wide third ventricle, and high signal changes in the thalami, particularly on the left (arrow); (d) the thalamic lesion is indicated by an arrow.
- Histochemical staining of skeletal muscle from II‐2. Combined COX/SDH staining shows scattered COX‐negative (blue) fibres (arrows). Scale bar corresponds to 100 μm.
- Respiratory chain complex activities in skeletal muscle. Specific activities (nmol/min/mg) of complex I, II and IV are reduced in II‐2 (red) compared to the controls mean (blue); CS activity is also low (< 50% of controls), suggesting a reduction in mitochondrial mass (see main text for further details). Each activity was measured in triplicate.
- Western blot analysis of PITRM1 in primary fibroblasts (left) and skeletal muscle (right) of controls (CTR) and subject II‐2. Densitometric quantification using the Genetools software is shown below the blots. In blue is PITRM1WT and in red PITRM1R183Q.
- Proteolytic activity on two fluorescent oligopeptides (AnaSpec), reported at the bottom of each histogram, by 6‐His‐tagged PITRM1WT and PITRM1R183Q proteins expressed in E. coli and affinity‐purified by Ni‐agarose chromatography. Values are expressed as arbitrary units per sec per μg of protein (a.u./s/μg). Experiments were performed in duplicate.
- Degradation rate of Aβ1–42 by purified 6‐His‐tagged PITRM1WT and PITRM1R183Q proteins. Quantification of these experiments is displayed below the blots. Experiments were performed in duplicate.
PITRM1 R183Q is unstable and impairs mitochondrial function
To evaluate the pathogenic effect of the p.R183Q mutation, we first investigated skin fibroblasts and a skeletal muscle biopsy taken from subject II‐2.
PITRM1 RNA expression measured by qPCR was similar in PITRM1 R183Q vs. PITRM1 wt cells (not shown). However, Western blot analysis of proteins separated by SDS–PAGE showed marked reduction of PITRM1 amount in II‐2 fibroblasts and skeletal muscle (Fig 1E), suggesting protein instability.
To test the effect of the PITRM1R183Q mutation on catalytic activity, we expressed recombinant PITRM1R183Q and PITRM1wt in Escherichia coli. Both affinity‐purified protein variants showed equal ability to cleave either of two fluorogenic peptides (Fig 1F), or Aβ (Fig 1G). Taken together, these results demonstrate that PITRM1R183Q is catalytically active in vitro, but highly unstable in vivo.
To characterise the cellular pathophysiology associated with PITRM1R183Q, we studied immortalised fibroblasts from subject II‐2. These cells showed a significant growth defect on respiration‐obligatory galactose medium, but not on glycolytic‐permissive glucose medium, compared to PITRM1wt cells (Fig 2A). Interestingly, similar results were obtained in control immortalised fibroblasts stably expressing a PITRM1‐specific shRNA, which decreased its protein levels to approximately 40% of the amount found in cells transfected with the empty vector (Fig 2A and B). The mitochondrial localisation of PITRM1 was confirmed using immunofluorescence (Fig 2C). Mitochondrial DNA (mtDNA) levels were similar in PITRM1R183Q vs. PITRM1wt cells, and there was no evidence of mtDNA depletion or significant amount of multiple deletions (not shown).
Figure 2. Characterisation of immortalised cells.
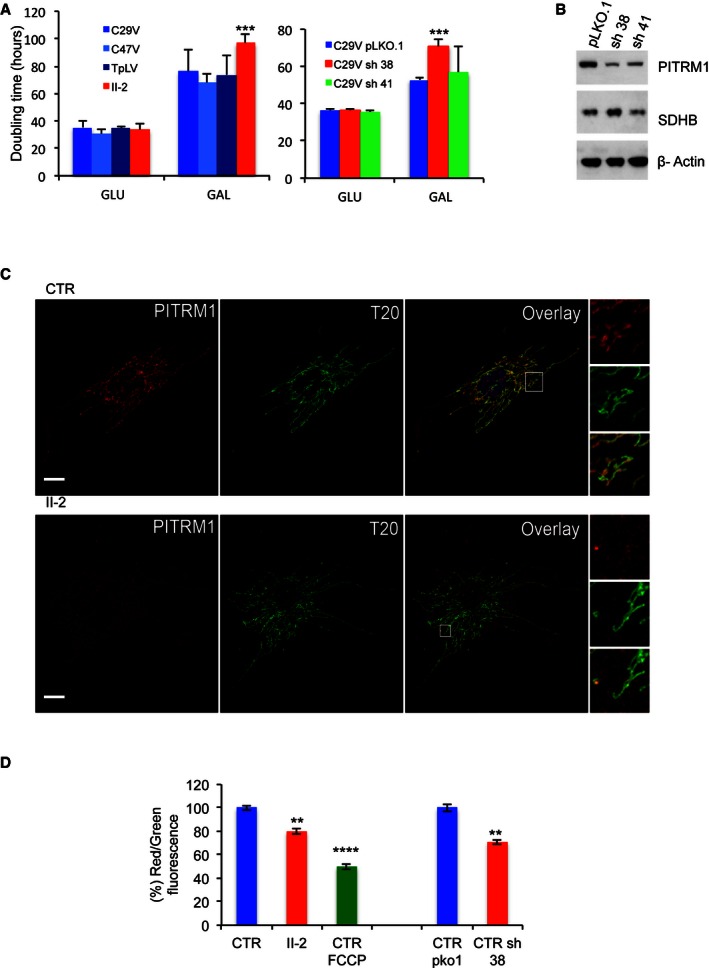
- Cell growth in glucose (GLU) and galactose (GAL). C29V, C47V and TpLV: immortalised fibroblast cell lines from control individuals; PITRM1V: immortalised fibroblasts from subject II‐2, carrying the PITRM1 R183Q mutation. pLKO.1: empty vector; sh38: shRNA38; sh41: shRNA41. Each cell line was measured six times. Statistical analysis was performed using two‐way ANOVA post hoc Bonferroni test, ***P < 0.001.
- Western blot analysis of PITRM1 in C29V cells transduced with the empty vector plKO.1 and the two shRNAs, sh38 and sh41. SDHB and β‐actin are used as loading controls.
- Co‐localisation of PITRM1 (red) with TOM20 (T20, green) in human fibroblast cells from a control (CTR) and subject II‐2. Note that the intensity of PITRM1 immunofluorescence is much lower in II‐2 cells than in CTR cells (see main text for further details). Nuclei are stained in blue by DAPI. Scale bar corresponds to 10 μm.
- Mitochondrial membrane potential (ΔP). In healthy cells with high mitochondrial ΔP, JC‐1 forms complexes known as J‐aggregates that show an intense red fluorescence. On the contrary in unhealthy cells with low ΔP, JC‐1 remains in the monomeric form, showing only green fluorescence. Values are referred to as % of those of the control means, taken as 100%. The results are the mean of three independent experiments. Statistical analysis was performed using two‐way ANOVA, **P < 0.01; ****P < 0.0001.
The mitochondrial membrane potential (ΔP) was significantly lower in PITRM1R183Q vs. PITRM1wt, but higher than that measured in PITRM1wt cells treated with the ΔP dissipator carbonyl cyanide‐p‐trifluoromethoxyphenylhydrazone (FCCP). Likewise, ΔP was significantly lower than normal in shRNA‐silenced PITRM1wt cells (Fig 2D).
In order to further ascertain the functional significance of PITRM1 R183Q, we modelled the mutation in the yeast Saccharomyces cerevisiae, whose PITRM1 orthologue is CYM1 (Alikhani et al, 2011a). The CYM1 null mutant, cym1Δ, was transformed with the cym1 R163Q allele, carrying a mutation equivalent to that found in our family.
When cultures were grown at standard temperature (28°C), hardly any difference was observed (Appendix Fig S2). At 37°C, however, the cym1Δ strain displayed impaired oxidative growth (Fig 3A), the O2 consumption rate (OCR) was as low as 25% of the wild‐type (Fig 3B), and cytochromes content was profoundly reduced (Fig 3C). All subsequent experiments were, therefore, carried out at 37°C. In these conditions, the transformation of the cym1Δ strain with CYM1 wt restored OCR and cytochrome content, whereas transformation with the cym1 R163Q variant gave intermediate but clearly defective results (Fig 3A–C). The enzymatic activities of complexes II, III and IV of the yeast strains paralleled the results of the OCR (Fig 3D). Western blot analysis of the cym1 R163Q yeast strain showed reduced amount of cym1 protein compared to the CYM1 wt strain, whereas no protein was present in the cym1Δ strain, as expected (Fig 3E). By overexposing the blot (Fig 3F), a low molecular weight band (arrow) was consistently observed below the cym1 R163Q band, likely corresponding to a cym1R163Q degradation product. These results indicate that the cym1R163Q mutant protein is unstable and prone to accelerated degradation, similar to the human PITRM1R183Q mutant protein.
Figure 3. Modelling the cym1 R163Q mutation in Saccharomyces cerevisiae .
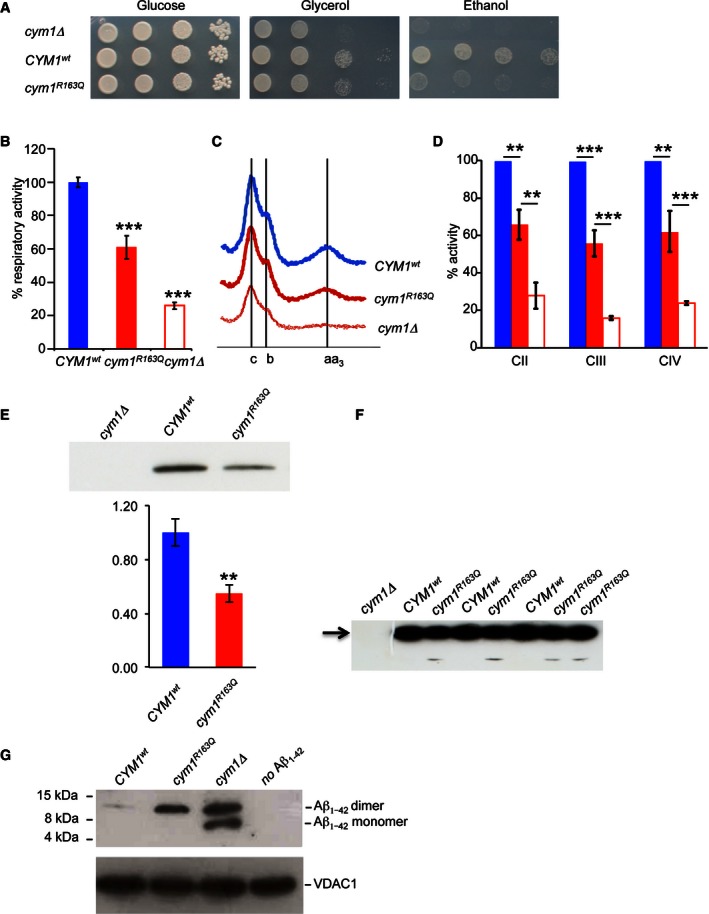
- Oxidative growth. W303‐1B cym1Δ strains harbouring the wild‐type CYM1 allele (CYM1 wt), the cym1 R163Q mutant allele or the empty vector were serially diluted from 107 to 104 cells/ml. Five microlitres of each dilution was spotted on SC agar plates without uracil, supplemented with 2% glucose, 2% glycerol or 2% ethanol. Plates were incubated at 37°C for 3–7 days.
- Oxygen consumption rate (OCR). Cells grown at 37°C SC medium without uracil were supplemented with 0.5% glucose. Values were normalised to the OCR of the CYM1 wt strain (49 nmol O2/min/mg) and represented as the mean of at least three values ± SD.
- Reduced versus oxidised cytochrome spectra. Peaks at 550, 560 and 602 nm correspond to cytochromes c, b and aa3, respectively. The height of each peak relative to the baseline is an index of cytochrome content.
- Respiratory chain complex activities. Biochemical activities of succinate quinone DCPIP reductase, SQDR (CII), NADH‐cytochrome c oxidoreductase activity NCCR (CIII) and cytochrome c oxidase (CIV) were measured on a mitochondrial enriched fraction from cells grown at 37°C as in (B). Values were normalised to that of CYM1 wt strain and represented as the mean of three independent experiments ± SD.
- Western blot on total protein extract using an anti‐HA monoclonal antibody visualising the CYM1wt and cym1R163Q recombinant proteins both fused in frame with the HA epitope on the C‐terminus. Total protein extracts were obtained by strains expressing HA‐tagged CYM1 wt and cym1 R163Q. PGK was used as a loading control, and signals were normalised to the wt. The quantification was performed on five independent blots.
- Prolonged exposure of a Western blot containing the CYM1wt and cym1R163Q recombinant proteins reveals the presence of a band corresponding to a degradation product in the cym1R163Q lanes (arrow).
- Western blot of Aβ1–42 myc monomer and dimer incubated with purified mitochondrial extracts from cells grown at 37°C in SC medium supplemented with 0.15% glucose and 2% galactose. VDAC was used as a loading control. Each experiment was performed in triplicate.
Finally, to test whether the cym1 R163Q mutation affected the stability of mitochondrial Aβ1–42, we expressed a modified Aβ1–42 fused with the mitochondrial signal peptide of Sod2. This fusion protein is targeted to mitochondria and could be identified by an anti Aβ1–42 antibody. Whilst this Aβ1–42 was almost completely eliminated in the CYM1 wt, no degradation occurred in the cym1Δ strain, and incomplete digestion of Aβ1–42 was observed in the cym1 R163Q strain (Fig 3G). Taken together, our results in yeast demonstrate the pathogenic role of the cym1 R163Q mutation equivalent to human PITRM1 R183Q.
Pitrm1 +/− mice develop a neurodegenerative phenotype, with accumulation of Aβ1–42 and signal peptides
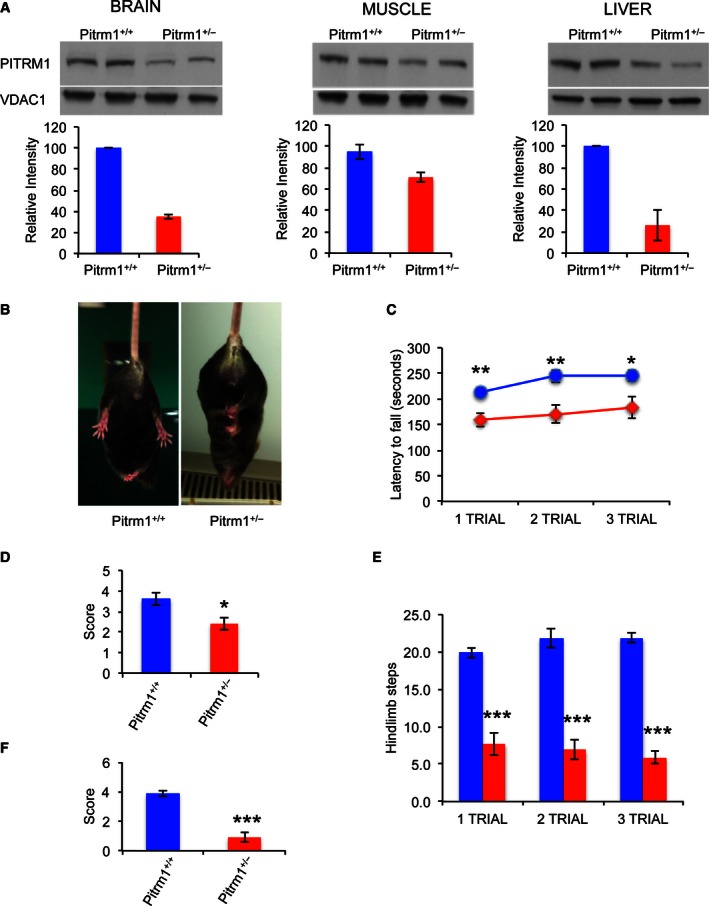
Next, a Pitrm1 knock‐out C57BL/6n‐Atm1Brd mouse line was obtained from the Wellcome Trust Sanger Institute, Cambridge, UK. Whilst the constitutive Pitrm1 −/− genotype is associated with embryonic lethality, Pitrm1 +/− heterozygotes survive to adulthood. In 4‐month‐old (mo) Pitrm1 +/−, Pitrm1 levels were well under 50% in brain and liver, and approximately 60% in skeletal muscle, compared to Pitrm1 +/+ littermates (Fig 4A), thus replicating the molecular lesion found in PITRM1 R183Q patients (reduced amount of a catalytically normal enzyme). Mice were monitored weekly for onset of postural abnormalities, weight loss and general health. No significant weight differences were found between the two groups. The first evidence of abnormality was the development of hindlimb clasping in heterozygous Pitrm1 +/− male mice from the age of 2 months. The neurological phenotype was evaluated further with a set of different coordination and sensorimotor tests in 4‐mo males. The Pitrm1 +/− heterozygous mice (n = 7) showed hindlimb clasping reflex (Brunetti et al, 2014) (Fig 4B) and performed poorly on tests of coordination, that is rotarod (Hickey et al, 2005), (Fig 4C) and negative geotaxis (Rogers et al, 1997) (Fig 4D); spontaneous rearing, that is cylinder test (Fleming et al, 2004) (Fig 4E); and basal ganglia‐related movement control, that is pole test (Fig 4F). Metabolic assessment showed significantly reduced O2 consumption and CO2 production, and reduced heat production over 36 h of observation in animals housed in a comprehensive laboratory animal monitoring system (CLAMS, Columbus Instruments, Columbus, OH, USA) (Appendix Fig S3). Next, we carried out post‐mortem analysis of Pitrm1 +/− vs. Pitrm1 +/+ mice. We first performed Western blot analysis on 4‐mo brain homogenates, using an antibody specific against the amyloid precursor protein (APP) and observed an approximately 2.5‐fold increase of APP cross‐reacting material in Pitrm1 +/− vs. Pitrm1 +/+ specimens (Fig 5A). This result was concordant with immunohistochemical analysis of formalin‐fixed and paraffin‐embedded brains of same age, using the same anti‐APP antibody (Appendix Fig S4A). In order to characterise the neuropathology of our Pitrm1 +/− animals, we then carried out histological and immunohistochemical analysis on brain tissue. Three brains from 6‐mo male Pitrm1 +/− mice showed normal histochemical reactions to COX and SDH, two respiratory chain activities (not shown), and were then analysed for amyloid detection on formalin‐fixed, paraffin‐embedded specimens, using Congo red and Thioflavin T stainings. Congo red staining was viewed under polarised light, while Thioflavin T staining was evaluated by fluorescence microscopy. This analysis revealed scattered Thioflavin and Congo red‐positive areas, indicating the presence of amyloid deposits (Fig 5B). The Congo red‐positive areas also showed apple‐green birefringence under polarised light, another characteristic reaction of amyloid. Finally, the presence of immunofluorescence‐positive areas was confirmed using an anti Aβ1–42 antibody. Similar findings were also obtained in 4‐mo and 12‐mo male Pitrm1 +/− animals (not shown). Additionally, 12‐mo Pitrm1 +/− brains underwent systematic histological and immunohistochemical analysis. Pitrm1 +/− specimens showed increased gliosis (Appendix Fig S4B), and accumulation of ubiquitin‐positive material in the neuropil and neurons (Fig 5B), with mild neuronal loss (not shown). The number of Aβ1–42‐immunoreactive areas was increased in 12‐mo Pitrm1 +/− brains, suggesting age‐dependent accumulation (Fig EV1). No such lesions were ever found in any brain specimen from Pitrm1 +/+ littermates. In Pitrm1 +/− female individuals of various ages, we found essentially the same clinical and neuropathological alterations as in males (not shown), indicating that the neurodegenerative process of the mouse model is not gender specific.
Figure 4. Behavioural studies of Pitrm1 +/− mouse.
-
AWestern blot analysis of Pitrm1 protein in brain, muscle and liver of two 4‐mo male Pitrm1 +/− mice and two Pitrm1 +/+ littermates. Densitometric analysis is reported in the histograms below the blots. Pitrm1 +/+ is in blue and Pitrm1 +/− in red.
-
BRepresentative hindlimb clasping phenomenon is shown in a 4‐mo Pitrm1 +/− male mouse, consisting in strong adduction of the hindlimbs when the animal is suspended by the tail; a littermate Pitrm1 +/+ control displays the normal reflex, consisting in wide abduction of the limbs. All examined Pitrm1 +/− animals displayed this abnormal reflex from 2 months of age.
-
CRotarod test. Blue and red lines refer to Pitrm1 +/+ (n = 9) and Pitrm1 +/− (n = 7) 4‐mo animals, respectively.
-
D–FNegative geotaxis (D), cylinder (E) and pole (F) tests. The experiments were carried out on the same group of animals as in (B).
Figure 5. Molecular and morphological analysis of Pitrm1 +/− mouse brain.
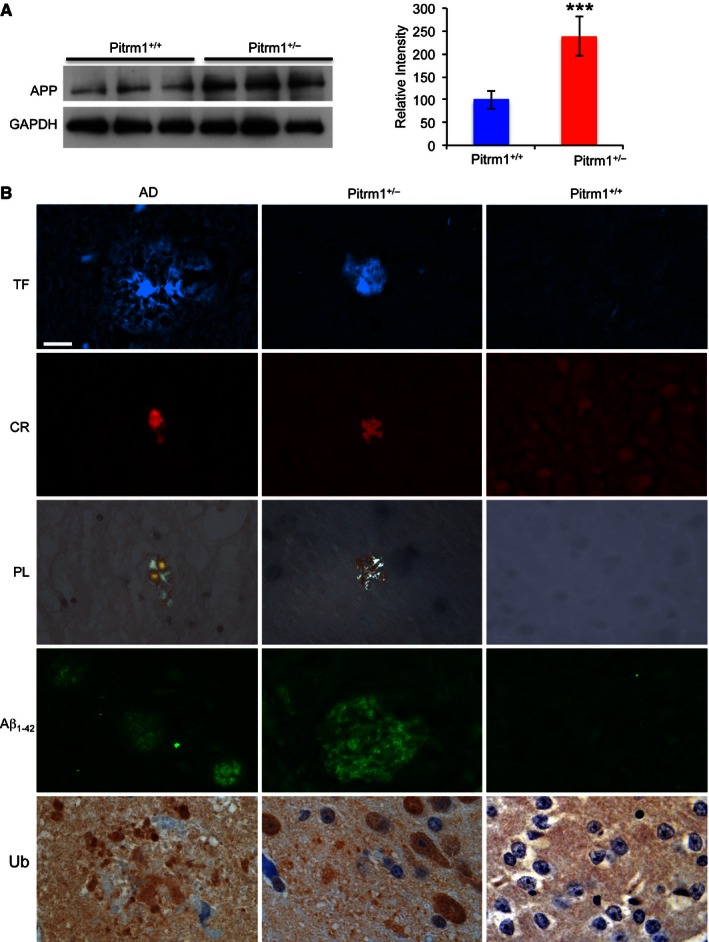
- Western blot analysis of amyloid precursor protein (APP) in 6‐mo male mice. GAPDH was used as a loading control. Densitometric analysis on a total of five independent samples is shown in the histogram on the right. ***P = 0.00058. Data are presented as mean ± SD. Statistical analysis was performed using unpaired, two‐tailed Student's t‐test.
- Morphological analysis of an AD subject and of Pitrm1 +/− and Pitrm1 +/+ mouse brains. TF: thioflavin T (thalamus); CR: Congo red (brain cortex); PL: polarised light (same sections as those stained with CR); Aβ1–42 immunostaining (pons); Ub: ubiquitin immunohistochemistry shown as brownish staining (brain cortex). Scale bar indicates 20 μm.
Source data are available online for this figure.
Figure EV1. Aβ1–42 immunostaining in brains of 12‐mo mice.
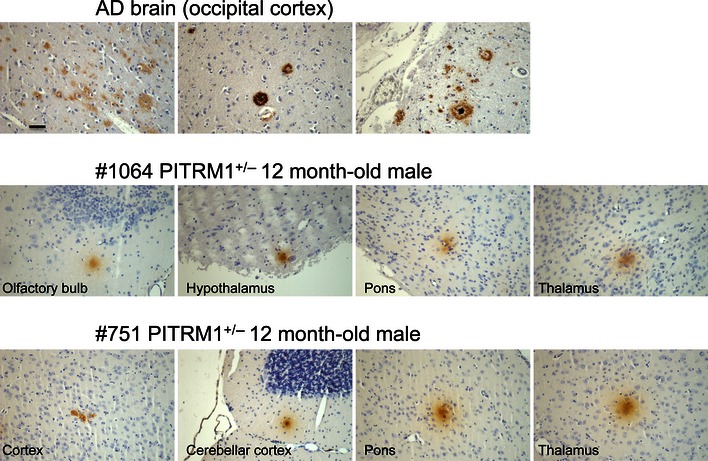
Brain sections from an AD patient are shown as positive controls. The brownish areas correspond to Aβ1–42 deposits. A black bar indicates 100×. The same magnification was used for all images.
To further test the mechanistic consequences of impaired Pitrm1 activity on mitochondrial Aβ disposal, we then performed a time course for the import of Aβ1–42 into isolated mitochondria from Pitrm1 +/+ and Pitrm1 +/− mice. Isolated liver and brain mitochondria were incubated with Aβ1–42 for 5 to 90 min. The levels of Aβ1–42 interacting with mitochondria increased with incubation time in liver and brain, in both Pitrm1 +/+ and Pitrm1 +/− mice (Fig 6A). However, in trypsin‐digested samples, where the extra‐mitochondrial proteins had been eliminated, Aβ1–42 was decreasing over time in Pitrm1 +/+, whereas it accumulated in Pitrm1 +/−, clearly indicating impaired Aβ1–42 degradation rate. Hence, we performed an Aβ1–42 chase experiment by incubating the mitochondria with Aβ1–42 for 15 min followed by treatment with trypsin and extensive washing. Imported Aβ1–42 was almost fully degraded within 30 min of chase in both liver and brain from Pitrm1 +/+ mice, whereas a significant amount of Aβ1–42 was still detected after 90 min of chase in both Pitrm1 +/− tissues (Fig 6B). These results demonstrate limited capacity of Pitrm1 +/− brain and liver mitochondria to eliminate Aβ1–42, causing this peptide to accumulate.
Figure 6. Aβ1–42 mitochondrial import and degradation.
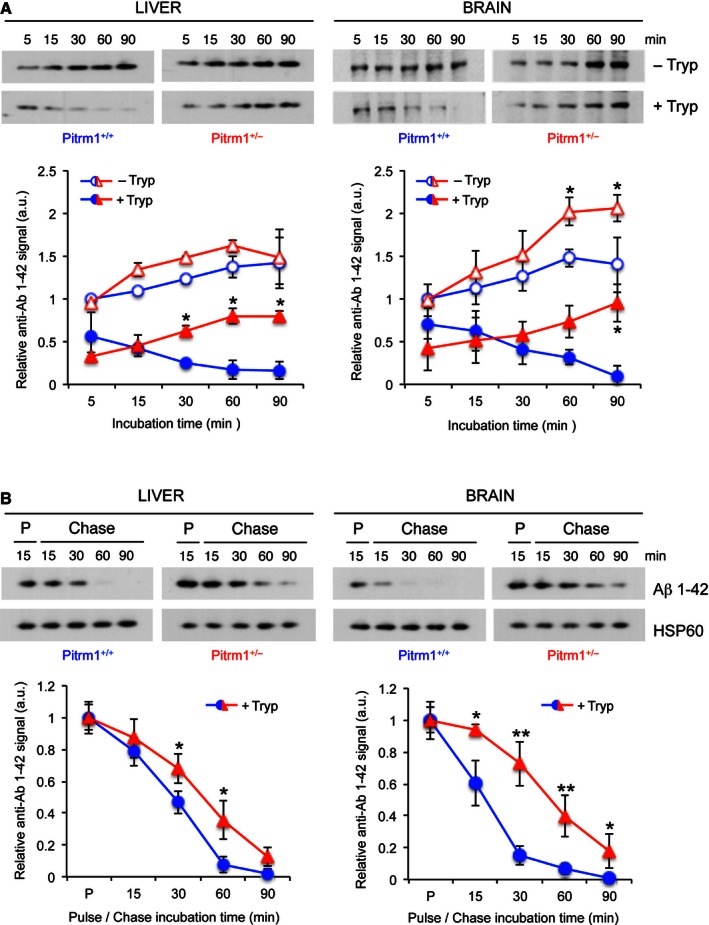
- Upper panel: import of Aβ1–42 into mitochondria. Lower panel: relative quantification from two independent experiments. Values of Aβ1–42 signal were normalised to HSP60 signal, and the resulting value at 5 min without trypsin was arbitrarily set as 1.
- Upper panel: pulse and chase experiment to assess clearance of Aβ1–42; lower panel: quantification from three independent experiments. Values of Aβ1–42 signal were normalised to HSP60 signal, and the pulse value was arbitrarily chosen as 1.
Since PITRM1 is also responsible for digesting the MTS of proteins imported across the inner mitochondrial membrane (Stahl et al, 2002; Alikhani et al, 2011a,b; Teixeira & Glaser, 2013), we analysed the levels of a MTS in Pitrm1 +/+ and Pitrm1 +/− mice. TFAM is a mitochondrial matrix protein, whose MTS serves as a substrate of PITRM1, whereas MPV17 is an inner membrane bound protein, which is not cleaved upon import into mitochondria. Radiolabelled TFAM was imported in a time‐dependent fashion and at the same levels in Pitrm1 +/+ and Pitrm1 +/− liver mitochondria (Appendix Fig S5). However, a band migrating in the region where the MTS is expected to localise was detected in Pitrm1 +/− mitochondria in significantly higher amount than in Pitrm1 +/+ mitochondria. In support that this band was indeed the TFAM MTS stands the observation that no band corresponding to the average MTS size (approximately 3–5 kDa) was detected in both Pitrm1 +/+ and Pitrm1 +/− mitochondria in the experiments carried out with radiolabelled MPV17. This result suggests that impaired Pitrm1 activity causes the accumulation of free MTS species in vivo.
Fibroblasts from Pitrm1 +/− mice and patients have reduced capacity to degrade Aβ peptides
Our data provide strong evidence that reduced Pitrm1 activity is associated with accumulation of Aβ plaques in the Pitrm1 +/− brain, possibly in an age‐dependent manner. This suggests that Aβ does enter mitochondria and that the activity of PITRM1 is biologically important for its removal.
To further explore this issue, we exposed to a fluorescent‐labelled Aβ1–40 peptide a number of cell lines, including immortalised PITRM1 R183Q fibroblasts from subject II‐2, normal human immortalised fibroblasts, Pitrm1 +/− mouse embryonic fibroblasts (MEFs), control MEFs and MEFs from mitofusin 1 or 2 ko lines (Mfn1 −/−, Mfn2 −/−). Mfn1 and Mfn2 are two proteins of the outer membrane of mitochondria, both promoting mitochondrial fusion, whereas Mfn2 also mediates interactions between mitochondria and the endoplasmic reticulum (ER) (Mishra & Chan, 2014). They were included in the experiment as “positive controls” to test whether Aβ accumulation could be associated with mitochondrial fragmentation or with reduced contacts between mitochondria and the ER. After 18 h of incubation, fluorescent‐labelled Aβ1–40 was almost completely removed in normal and Mfn1 −/− or Mfn2 −/− controls, whereas it persisted at highly significant levels in Pitrm1 +/− MEFs and PITRM1 R183Q (Fig 7A), as quantitatively ascertained by fluorescent cell sorting (Fig 7B). Taken together, these results clearly demonstrate that reduced levels of PITRM1 due to either haploinsufficiency or destabilising mutations significantly impair the disposal of Aβ1–40.
Figure 7. Degradation of Aβ1–40 peptide in fibroblasts and MEFs.
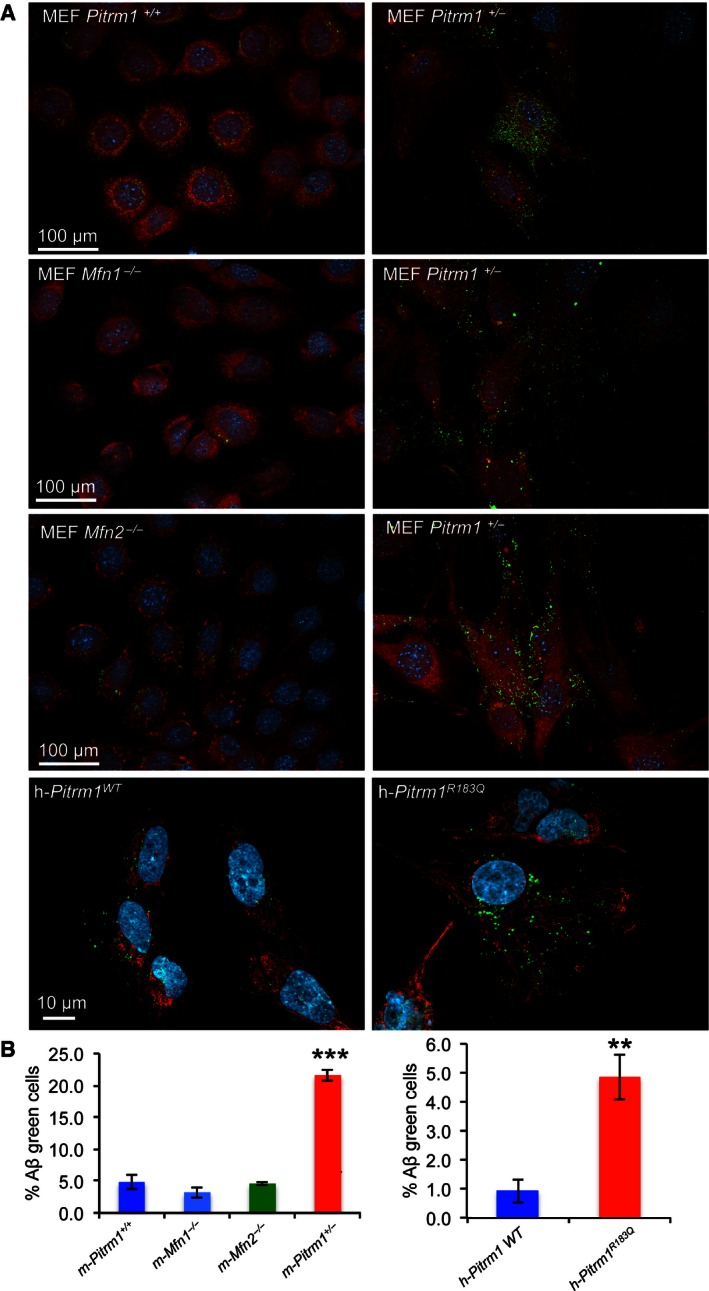
- MEFs from Pitrm1 +/+, Pitrm1 +/−, Mfn1 −/− and Mfn2 −/−, as well as h‐PITRM1 R183Q and h‐ PITRM1 WT, were exposed to Aβ1–40 peptide for 18 h. Note that Aβ1–40 signal was still evident in Pitrm1 +/− and h‐PITRM1 R183Q cells.
- Quantification of three independent experiments similar to those shown in (A). Data are presented as mean ± SD. Statistical analysis was by unpaired, two‐tailed Student's t‐test. **P < 0.01, ***P < 0.001. Exact P‐values are reported in Table EV1.
Discussion
We have shown that Aβ accumulation participates in the neurodegeneration and neurological derangement seen in the Pitrm1 mouse model and, possibly, in our PITRM1 R183Q mutant subjects as well. Aβ plaques were, however, sparse in the brain of young Pitrm1 +/− mice, suggesting that the disease mechanism may not be limited to Aβ pathology. The main role of PITRM1 is deemed to be the elimination of cleaved mitochondrial targeting peptides after protein translocation (Koppen & Langer, 2007). Typically, these peptides, located at the N‐terminus of mitochondrion‐targeted proteins, are amphiphilic species, with a polar, positively charged, arginine‐rich side, opposite to an apolar side (Roise & Schatz, 1988). The electrostatic features of these peptides allow them to both guide the insertion of the precursor proteins into the TIM23 translocon and drive their internalisation within the inner mitochondrial compartment, by exploiting the electrostatic component (ΔΨ) of the mitochondrial ΔP (Roise & Schatz, 1988). Due to their amphiphilic nature, however, these peptides, when released from the mature proteins by MMP, may act as detergent‐like, toxic agents, forming pores in the membranes and resulting in uncoupling and dissipation of ΔP (van ‘t Hof et al, 1991; Zardeneta & Horowitz, 1992; Nicolay et al, 1994). Such toxicity may explain the embryonic lethality associated with the complete ablation of PITRM1 activity in the Pitrm1 −/− mouse genotype. Furthermore, accumulation of cleaved signal peptides may also affect maturation of mitochondrial proteins by inhibiting the mitochondrial matrix peptidase, resulting in decreased activity or instability of imported, but unprocessed, proteins (Mossmann et al, 2014). The same backlogging mechanism, due to impaired degradation machinery of oligopeptides, can determine reduced rate of APP processing and explain its accumulation, as detected in the brains of Pitrm1 +/− animals.
In summary, we have identified a human neurodegenerative disease combining impaired motor coordination, cognitive and psychotic features, caused by a hypomorphic pathogenic mutation in the mitochondrial protease PITRM1 associated with protein instability. A heterozygous Pitrm1 +/− mouse model replicated several of the neurological symptoms found in humans, and showed the presence, amongst other neuropathological features, of Aβ aggregates similar to AD amyloid plaques. Our findings offer a mechanistic link between mitochondrial dysfunction and misfolded protein aggregates in the pathogenesis of neurodegeneration. Future work is warranted to test whether PITRM1 variants are associated with amyloidotic neurodegeneration, including AD. Interestingly, the observation that the hemizygous Pitrm1 +/− mouse displays slowly progressive, multisystem neurological impairment suggests that not only recessive variants, but also dominant or sporadic loss‐of‐function mutations in PITRM1 could be associated with adult‐onset neurodegeneration, possibly characterised, as in the mouse, by accumulation of APP and Aβ deposits.
In conclusion based on medical genetic evidence (a mutant family), a yeast model, in vitro assays and a mouse recombinant model, we demonstrate that partial impairment of a metallopeptidase contained within the inner compartment of mitochondria not only causes neurodegeneration, but is clearly associated with accumulation of amyloid precursor protein APP and Aβ1–42.
This wealth of independent observations leads to important conclusions, for both basic biological knowledge and translational research. First, our results conclusively resolve a long‐standing debate about the presence of Aβ within mitochondria, a hypothesis that has so far remained controversial. Second, we provide genetic evidence that confirms that PITRM1 is the peptidase specifically dedicated to Aβ clearance within mitochondria and that even partial impairment of this function, caused by either instability of a mutant variant (our family) or hemizygosity (the Pitrm1 +/− mouse), can determine neurodegeneration with accumulation of amyloidotic Aβ, directly linking the latter with abnormal mitochondrial proteostasis. This has potentially relevant implications in the etiopathogenesis of AD, a prominent cause of chronic neurological disability in the Western world. Finally, the embryonic lethality of the Pitrm1 −/− genotype underscores the essential role of the PITRM1 protein in cellular homoeostasis and, together with the proof that PITRM1 acts on both Aβ and MTS clearance, gives mechanistic support to the idea that conditions characterised by either reduced PITRM1 activity (as in our family and mouse model) or increased Aβ production (e.g. chromosome 21 trisomy) can cause saturation of the clearance pathway centred on PITRM1, resulting in accumulation of toxic peptides, including free MTS' and Aβ, as well as backlogging of precursors, for example APP and mitochondrial unprocessed proteins, which can eventually lead to progressive brain derangement.
Materials and Methods
Additional methods for DNA and RNA purification, cell cultures, Western blot, biochemical assays, yeast and mouse studies are available in the Appendix Supplementary Methods.
Genetics
Our study was approved by the Regional Committee for Medical and Health Research Ethics, Western Norway (2014/330/REK vest). Informed consent was obtained from the subjects and all the experiments conformed to the WMA Declaration of Helsinki.
Whole exome sequencing was performed at HudsonAlpha Institute for Biotechnology (Huntsville,AL) using Roche‐NimbleGen Sequence Capture EZ Exome v2 kit and paired‐end 100 nt sequencing on the Illumina HiSeq. The reads were mapped using v6.2 aligner, PCR duplicates removed with Picard v1.118 (http://broadinstitute.github.io/picard), and the alignment refined using Genome Analysis Toolkit (GATK) v3.2‐2 and called using GATK HaplotypeCaller requiring a minimum coverage of 8 reads, and 5 reads for the variant allele. Filtering and annotation of variants were done in ANNOVAR (Haugarvoll et al, 2013). Coding and putative splice sites (defined as 2 bps flanking coding exons) were filtered against variants with MAF > 0.8% in an in‐house database of more than 300 Norwegian exomes, and variants present at > 0.5% allele frequency in the 1000 Genomes database (phase 1 release v3 called from 20101123 alignment).
Mitochondrial membrane potential
Detection of mitochondrial transmembrane potential (ΔP) change was performed using the lipophilic, cationic dye JC‐1 (ChemoMetec) and Nucleo Counter NC‐3000 according to manufacturer instructions. In healthy cells with high mitochondrial ΔP, JC‐1 forms complexes known as J‐aggregates that show an intense red fluorescence. On the contrary in unhealthy cells with low ΔP, JC‐1 remains in the monomeric form, showing only green fluorescence. Red vs. green fluorescence intensity ratio was quantified, and differences between cell lines were analysed statistically using two‐way ANOVA.
Indirect immunofluorescence
Fibroblasts were seeded on glass coverslips and grown for 48 h. The cells were fixed for 30 min with 3% paraformaldehyde (PFA) in 0.1 M phosphate buffer, pH 7.2 at room temperature and stained as described (Sannerud et al, 2008).
In vitro protein modelling
Purification of recombinant human PITRM1
Production and purification of PITRM1 (wild‐type and R183Q variant) were performed as previously described (Teixeira et al, 2012). The PITRM1R183Q variant was constructed by site‐directed mutagenesis using the QuikChange II kit (Agilent Technologies) and appropriate primers and confirmed by sequencing.
PITRM1 activity
For the analysis of Aβ degradation, PITRM1 samples (wt or R183Q, 1 μg) were incubated with 1 μg of Aβ 1–42 (Alexotech) for the indicated time in degradation buffer (50 mM HEPES‐KOH pH 8.2, 10 mM MgCl2) at 37°C (experiments performed in duplicate). After incubation, the reactions were resolved on NuPAGE 4–12% Bis‐Tris gels and stained with Coomassie brilliant blue (Sigma).
In the fluorescence‐based assays, PITRM1 samples (wt or R183Q, 0.2 μg) were mixed with either 1 μg Substrate V (sequence RPPGFSAFK, R&D Systems) or 4 μg F1β 43–53 presequence fragment (sequence KGFLLNRAVQYK, custom synthesis), and the increase in fluorescence (excitation 327 nm; emission 395 nm) was recorded on a plate reader (SpectraMax Gemini). Experiments were performed in duplicate, and the results are shown as substrate degradation rates.
Yeast studies
Strains and oligos used in this work are reported in Appendix Tables S1 and S2, respectively. Strain W303‐1B cym1Δ was obtained by one‐step gene disruption with a KanMX4 cassette amplified from the corresponding BY4742 deleted strain, using primers CYM1DCFw and CYM1DCRv. All experiments, except transformation, were performed in synthetic complete (SC) media (0.19% YNB without amino acids and NH4SO4 powder (ForMedium, Norfolk, UK), 0.5% NH4SO4) supplemented with 1 g/l dropout mix without amino acids or bases necessary except those necessary to keep plasmids. Media were supplemented with various carbon sources as indicated below (Carlo Erba Reagents, Milan, Italy) in liquid phase or after solidification with 20 g/l agar (ForMedium). Growth was performed with constant shaking at 37°C. Transformation with suitable recombinant plasmids was used to express CYM1wt and cym1R163Q protein variants, each carrying an HA epitope on the C‐terminus for immunovisualisation. Additional details are reported in Appendix Supplementary Methods.
Mouse studies
All animal experiments were carried out in accordance with the UK Animals (Scientific Procedures) Act 1986 and EU Directive 2010/63/EU for animal experiments. The C57BL/6n‐Atm1Brd Pitrm1 +/− mice used in this study were kindly provided by the Sanger Institute (http://www.informatics.jax.org/allele/MGI:5085349). Animals were housed two or three per cage in a temperature‐controlled (21°C) room with a 12‐h light–dark cycle and 60% relative humidity. The experimental design included two groups of male mice of 3–6 months of age (9 Pitrm1 +/+ vs. 7 Pitrm1 +/−).
Morphological analysis of mouse brain
Histological and immunohistochemical analyses were performed on formalin‐fixed and paraffin‐embedded brain tissues. Five‐μm‐thick serial sections were stained with haematoxylin–eosin and viewed by light microscopy. For histochemical studies, tissues were frozen in liquid‐nitrogen precooled isopentane and serial 8‐μm‐thick sections were stained for COX, SDH and NADH as described (Sciacco & Bonilla, 1996). Congo red and Thioflavin T stainings were performed as described (Puchtler & Sweat, 1962; Burns et al, 1967). Congo red‐positive areas were viewed under polarised light, while Thioflavin T staining was evaluated by fluorescence microscopy.
Mitochondrial import and degradation of Aβ
For import experiments, Aβ1–42, human TFAM and MPV17 radiolabelled proteins were obtained via coupled transcription and translation (TNT) in a reticulocyte system in the presence of [35S]‐metionine. Liver and brain mitochondria were isolated by differential centrifugation (Reyes et al, 2011) and incubated with 0.36 mg/ml Aβ1–42, for 5 to 90 min in import buffer (Petruzzella et al, 1998). Then, half of the reaction was treated with trypsin for 15 min, and mitochondrial pellets were resolved on 10–20% PAGE gels. Aβ1–42 and HSP60, used as loading control, were analysed by Western blot.
For degradation experiments with Aβ1–42, liver and brain mitochondria were incubated with 0.36 mg/ml Aβ1–42 for 15 min (pulse) followed by trypsin digestion and incubation for 15 to 90 min (chase).
Exposure of human and mouse cells to fluorescent Aβ
MEFs (Pitrm1 +/+ and Pitrm1 +/−) and human immortalised fibroblast (PITRM1 WT and PITRM1 R183Q) were grown for 24 h on glass slides and then exposed for 18 h to fluorescent Aβ1–40 peptide (Aβ1–40 HiLite fluor 488‐labelled, AnaSpec), freshly dissolved in PBS and added to culture medium at a final concentration of 1 μM for 18 h at 37°C. Subsequently, the medium was changed and MitroTracker Red (Invitrogen) was added for 30 min at 37°C. Cells were washed with PBS and fixed with 2% PAF for 20 min. Cells were washed with PBS and mounted using Prolong Gold antifade reagent with DAPI. The samples were visualised by an inverted laser scanning microscope (Axio Observer.Z1).
Statistics
Unless differently indicated in the figure legends, statistical analysis was performed using unpaired, two‐way Student's t‐test. Data are presented as mean ± SD. Exact P‐values for all experiments are reported in Table EV1.
Author contributions
JT performed laboratory investigations of patient samples. WT was involved in ascertaining and following the patient and organising clinical investigations. PS, SJ and HB were responsible for SNP chip analysis and WES and data interpretation. PT and EG were responsible for generating recombinant PITRM1 and testing activity. DB characterised the Pitrm1 +/− mouse, and performed part of the experiments on mouse and human cells. AR performed the import and pulse and chase experiments on mouse cells and isolated mitochondria. CD, EB, PG and IF designed and performed the experiments on the yeast models, and EF‐V performed and supervised most of the experiments on human cell lines and tissues and contributed to those on isolated mitochondria. RC, CP and GD performed and interpreted the histochemical and histological data. CV supervised the work on the mouse model. MZ and LAB designed the study and wrote the manuscript.
Conflict of interest
The authors declare that they have no conflict of interest.
The paper explained.
Problem
Two siblings of a consanguineous family with a slowly progressive neurodegenerative disorder of unknown origin were investigated to establish the cause.
Results
A homozygous, disease‐segregating missense mutation was found in the PITRM1 gene in both siblings. The pathogenic role of the mutation, causing PITRM1 instability, was validated by in vitro assays, characterisation of mutant fibroblasts from patients, in PITRM1 knocked‐down human fibroblasts and in a mutant yeast model. A hemizygous PITRM1 knockout mouse displayed reduced amounts of PITRM1 and slowly progressive neurodegeneration, characterised by accumulation of amyloid beta (Aβ) in the brain.
Impact
We have identified a clinically peculiar human neurodegenerative disorder caused by a pathogenic, homozygous mutation in PITRM1, a gene encoding an oligopeptidase of the mitochondrial inner compartment. The neuropathology of a Pitrm1 −/+ mouse provides genetic evidence that Aβ is present within mitochondria, and demonstrates a link between impaired PITRM1 activity and Aβ amyloidotic neurodegeneration in mammals.
Supporting information
Appendix
Expanded View Figures PDF
Table EV1
Review Process File
Source Data for Figure 1E and G
Source Data for Figure 2B
Source Data for Figure 3
Source Data for Figure 4A
Source Data for Figure 5A
Acknowledgements
We thank the Wellcome Trust Sanger Institute Mouse Genetics Project (Sanger MGP) and its funders for providing the mutant mouse line. Funding and associated primary phenotypic information may be found at http://www.sanger.ac.uk/science/collaboration/mouse-resource-portal. Our work is supported by the following grants: Cariplo 2011‐0526, ERC FP7‐322424 (to M.Z.); the Swedish Research Council (to EG); Helse Vest 911810 (PMK); Forening for muskelsyke (to LAB); and GR‐2010‐2306‐756 from the Italian Ministry of Health (to CV). We are grateful to: Charalampos Tzoulis for help with figures, Hrvoje Miletic for the immunohistochemistry figure Roberta Ruotolo and Simone Ottonello for pYES2‐mtβ42 vector; Alan Robinson for the bioinformatics analysis; Ian Fearnley and Mike Harbour for the proteomics; Sabrina Ravaglia for advice in some statistical analyses; and Jorunn Bringsli for technical assistance; the personnel at ARES and Phenomics Animal Care Facilities for the support in managing our colonies. This paper is dedicated to the memory of Gottfried Schatz, PhD and Stefano di Donato, MD.
EMBO Mol Med (2016) 8: 176–190
See also: V Boczonadi & R Horvath (March 2016)
References
- Alikhani N, Berglund AK, Engmann T, Spanning E, Vogtle FN, Pavlov P, Meisinger C, Langer T, Glaser E (2011a) Targeting capacity and conservation of PreP homologues localization in mitochondria of different species. J Mol Biol 410: 400–410 [DOI] [PubMed] [Google Scholar]
- Alikhani N, Guo L, Yan S, Du H, Pinho CM, Chen JX, Glaser E, Yan SS (2011b) Decreased proteolytic activity of the mitochondrial amyloid‐beta degrading enzyme, PreP peptidasome, in Alzheimer's disease brain mitochondria. J Alzheimers Dis 27: 75–87 [DOI] [PMC free article] [PubMed] [Google Scholar]
- Andreasen N, Hesse C, Davidsson P, Minthon L, Wallin A, Winblad B, Vanderstichele H, Vanmechelen E, Blennow K (1999) Cerebrospinal fluid beta‐amyloid(1‐42) in Alzheimer disease: differences between early‐ and late‐onset Alzheimer disease and stability during the course of disease. Arch Neurol 56: 673–680 [DOI] [PubMed] [Google Scholar]
- Brunetti D, Dusi S, Giordano C, Lamperti C, Morbin M, Fugnanesi V, Marchet S, Fagiolari G, Sibon O, Moggio M et al (2014) Pantethine treatment is effective in recovering the disease phenotype induced by ketogenic diet in a pantothenate kinase‐associated neurodegeneration mouse model. Brain 137: 57–68 [DOI] [PMC free article] [PubMed] [Google Scholar]
- Burns J, Pennock CA, Stoward PJ (1967) The specificity of the staining of amyloid deposits with thioflavine T. J Pathol Bacteriol 94: 337–344 [DOI] [PubMed] [Google Scholar]
- Falkevall A, Alikhani N, Bhushan S, Pavlov PF, Busch K, Johnson KA, Eneqvist T, Tjernberg L, Ankarcrona M, Glaser E (2006) Degradation of the amyloid beta‐protein by the novel mitochondrial peptidasome, PreP. J Biol Chem 281: 29096–29104 [DOI] [PubMed] [Google Scholar]
- Fleming SM, Zhu C, Fernagut PO, Mehta A, DiCarlo CD, Seaman RL, Chesselet MF (2004) Behavioral and immunohistochemical effects of chronic intravenous and subcutaneous infusions of varying doses of rotenone. Exp Neurol 187: 418–429 [DOI] [PubMed] [Google Scholar]
- Friedland‐Leuner K, Stockburger C, Denzer I, Eckert GP, Muller WE (2014) Mitochondrial dysfunction: cause and consequence of Alzheimer's disease. Prog Mol Biol Transl Sci 127: 183–210 [DOI] [PubMed] [Google Scholar]
- Hansson Petersen CA, Alikhani N, Behbahani H, Wiehager B, Pavlov PF, Alafuzoff I, Leinonen V, Ito A, Winblad B, Glaser E et al (2008) The amyloid beta‐peptide is imported into mitochondria via the TOM import machinery and localized to mitochondrial cristae. Proc Natl Acad Sci USA 105: 13145–13150 [DOI] [PMC free article] [PubMed] [Google Scholar]
- Haugarvoll K, Johansson S, Tzoulis C, Haukanes BI, Bredrup C, Neckelmann G, Boman H, Knappskog PM, Bindoff LA (2013) MRI characterisation of adult onset alpha‐methylacyl‐coA racemase deficiency diagnosed by exome sequencing. Orphanet J Rare Dis 8: 1 [DOI] [PMC free article] [PubMed] [Google Scholar]
- Hickey MA, Gallant K, Gross GG, Levine MS, Chesselet MF (2005) Early behavioral deficits in R6/2 mice suitable for use in preclinical drug testing. Neurobiol Dis 20: 1–11 [DOI] [PubMed] [Google Scholar]
- van ‘t Hof R, Demel RA, Keegstra K, de Kruijff B (1991) Lipid‐peptide interactions between fragments of the transit peptide of ribulose‐1,5‐bisphosphate carboxylase/oxygenase and chloroplast membrane lipids. FEBS Lett 291: 350–354 [DOI] [PubMed] [Google Scholar]
- Johri A, Beal MF (2012) Mitochondrial dysfunction in neurodegenerative diseases. J Pharmacol Exp Ther 342: 619–630 [DOI] [PMC free article] [PubMed] [Google Scholar]
- Koppen M, Langer T (2007) Protein degradation within mitochondria: versatile activities of AAA proteases and other peptidases. Crit Rev Biochem Mol Biol 42: 221–242 [DOI] [PubMed] [Google Scholar]
- Manczak M, Anekonda TS, Henson E, Park BS, Quinn J, Reddy PH (2006) Mitochondria are a direct site of A beta accumulation in Alzheimer's disease neurons: implications for free radical generation and oxidative damage in disease progression. Hum Mol Genet 15: 1437–1449 [DOI] [PubMed] [Google Scholar]
- Mishra P, Chan DC (2014) Mitochondrial dynamics and inheritance during cell division, development and disease. Nat Rev Mol Cell Biol 15: 634–646 [DOI] [PMC free article] [PubMed] [Google Scholar]
- Morais VA, De Strooper B (2010) Mitochondria dysfunction and neurodegenerative disorders: cause or consequence. J Alzheimers Dis 20(Suppl 2): S255–S263 [DOI] [PubMed] [Google Scholar]
- Moran M, Moreno‐Lastres D, Marin‐Buera L, Arenas J, Martin MA, Ugalde C (2012) Mitochondrial respiratory chain dysfunction: implications in neurodegeneration. Free Radic Biol Med 53: 595–609 [DOI] [PubMed] [Google Scholar]
- Mossmann D, Vogtle FN, Taskin AA, Teixeira PF, Ring J, Burkhart JM, Burger N, Pinho CM, Tadic J, Loreth D et al (2014) Amyloid‐beta peptide induces mitochondrial dysfunction by inhibition of preprotein maturation. Cell Metab 20: 662–669 [DOI] [PubMed] [Google Scholar]
- Motter R, Vigo‐Pelfrey C, Kholodenko D, Barbour R, Johnson‐Wood K, Galasko D, Chang L, Miller B, Clark C, Green R et al (1995) Reduction of beta‐amyloid peptide42 in the cerebrospinal fluid of patients with Alzheimer's disease. Ann Neurol 38: 643–648 [DOI] [PubMed] [Google Scholar]
- Nicolay K, Laterveer FD, van Heerde WL (1994) Effects of amphipathic peptides, including presequences, on the functional integrity of rat liver mitochondrial membranes. J Bioenerg Biomembr 26: 327–334 [DOI] [PubMed] [Google Scholar]
- Pagani L, Eckert A (2011) Amyloid‐Beta interaction with mitochondria. Int J Alzheimers Dis 2011: 925050 [DOI] [PMC free article] [PubMed] [Google Scholar]
- Petruzzella V, Tiranti V, Fernandez P, Ianna P, Carrozzo R, Zeviani M (1998) Identification and characterization of human cDNAs specific to BCS1, PET112, SCO1, COX15, and COX11, five genes involved in the formation and function of the mitochondrial respiratory chain. Genomics 54: 494–504 [DOI] [PubMed] [Google Scholar]
- Pinho CM, Teixeira PF, Glaser E (2014) Mitochondrial import and degradation of amyloid‐beta peptide. Biochim Biophys Acta 1837: 1069–1074 [DOI] [PubMed] [Google Scholar]
- Puchtler H, Sweat F (1962) Amidoblack as a stain for hemoglobin. Arch Pathol 73: 245–249 [PubMed] [Google Scholar]
- Reyes A, He J, Mao CC, Bailey LJ, Di Re M, Sembongi H, Kazak L, Dzionek K, Holmes JB, Cluett TJ et al (2011) Actin and myosin contribute to mammalian mitochondrial DNA maintenance. Nucleic Acids Res 39: 5098–5108 [DOI] [PMC free article] [PubMed] [Google Scholar]
- Rogers DC, Fisher EM, Brown SD, Peters J, Hunter AJ, Martin JE (1997) Behavioral and functional analysis of mouse phenotype: SHIRPA, a proposed protocol for comprehensive phenotype assessment. Mamm Genome 8: 711–713 [DOI] [PubMed] [Google Scholar]
- Roise D, Schatz G (1988) Mitochondrial presequences. J Biol Chem 263: 4509–4511 [PubMed] [Google Scholar]
- Sannerud R, Marie M, Hansen BB, Saraste J (2008) Use of polarized PC12 cells to monitor protein localization in the early biosynthetic pathway. Methods Mol Biol 457: 253–265 [DOI] [PubMed] [Google Scholar]
- Sciacco M, Bonilla E (1996) Cytochemistry and immunocytochemistry of mitochondria in tissue sections. Methods Enzymol 264: 509–521 [DOI] [PubMed] [Google Scholar]
- Stahl A, Moberg P, Ytterberg J, Panfilov O, Brockenhuus Von Lowenhielm H, Nilsson F, Glaser E (2002) Isolation and identification of a novel mitochondrial metalloprotease (PreP) that degrades targeting presequences in plants. J Biol Chem 277: 41931–41939 [DOI] [PubMed] [Google Scholar]
- Teixeira PF, Pinho CM, Branca RM, Lehtio J, Levine RL, Glaser E (2012) In vitro oxidative inactivation of human presequence protease (hPreP). Free Radic Biol Med 53: 2188–2195 [DOI] [PMC free article] [PubMed] [Google Scholar]
- Teixeira PF, Glaser E (2013) Processing peptidases in mitochondria and chloroplasts. Biochim Biophys Acta 1833: 360–370 [DOI] [PubMed] [Google Scholar]
- Zardeneta G, Horowitz PM (1992) Analysis of the perturbation of phospholipid model membranes by rhodanese and its presequence. J Biol Chem 267: 24193–24198 [PubMed] [Google Scholar]
Associated Data
This section collects any data citations, data availability statements, or supplementary materials included in this article.
Supplementary Materials
Appendix
Expanded View Figures PDF
Table EV1
Review Process File
Source Data for Figure 1E and G
Source Data for Figure 2B
Source Data for Figure 3
Source Data for Figure 4A
Source Data for Figure 5A